Analysis of dynamic features in intersecting pedestrian flows∗
2017-08-30HaiRongDong董海荣QiMeng孟琦XiuMingYao姚秀明XiaoXiaYang杨晓霞andQianLingWang王千龄
Hai-Rong Dong(董海荣),Qi Meng(孟琦),Xiu-Ming Yao(姚秀明), Xiao-Xia Yang(杨晓霞),and Qian-Ling Wang(王千龄)
1 State Key Laboratory of Rail Traffic Control and Safety,Beijing Jiaotong University,Beijing 100044,China
2 School of Electronic and Information Engineering,Beijing Jiaotong University,Beijing 100044,China
Analysis of dynamic features in intersecting pedestrian flows∗
Hai-Rong Dong(董海荣)1,Qi Meng(孟琦)1,Xiu-Ming Yao(姚秀明)2,†, Xiao-Xia Yang(杨晓霞)1,and Qian-Ling Wang(王千龄)1
1 State Key Laboratory of Rail Traffic Control and Safety,Beijing Jiaotong University,Beijing 100044,China
2 School of Electronic and Information Engineering,Beijing Jiaotong University,Beijing 100044,China
This paper focuses on the simulation analysis of stripe formation and dynamic features of intersecting pedestrian flows. The intersecting flows consist of two streams of pedestrians and each pedestrian stream has a desired walking direction. The model adopted in the simulations is the social force model,which can reproduce the self-organization phenomena successfully.Three scenarios of different cross angles are established.The simulations confirm the empirical observations that there is a stripe formation when two streams of pedestrians intersect and the direction of the stripes is perpendicular to the sum of the directional vectors of the two streams.It can be concluded from the numerical simulation results that smaller cross angle results in higher mean speed and lower level of speed fluctuation.Moreover,the detailed pictures of pedestrians’moving behavior at intersections are given as well.
intersecting pedestrian flows,social force model,stripes formation,cross angle
1.Introduction
Thousands of people died and more were injured in crowd stampedes over the past 100 years around the world.[1]Cities are densely populated nowadays and the collective behaviors seem to occur more frequently,such as traveling by subway,shopping in malls,and watching sports games in stadia. Hence,how to guarantee the safety and comfort of pedestrian motion and improve the efficiency of public space has become an urgent problem to be solved.
Pedestrian dynamics refers to the study of how and where crowds form and move,which usually studies the dynamic features of pedestrian flows.The study on pedestrian dynamics has attracted considerable attention of researchers infields of physics,transportation,and more.Some good pedestrian models have been put forward with the advance of research.In general,pedestrian models are divided into three categories:(i)macroscopic models,where pedestrians are studied as a group without considering the interactions among pedestrians and pedestrian flows are analogous to gases and fluids in some sense;[2](ii)microscopic models,where every pedestrian is treated as an individual and the interactions among pedestrians are considered;[3](iii)mesoscopic models,which inherit from both macroscopic models and microscopic models.[4]The overview of some representative pedestrian models can be found in Refs.[5]–[7].Pedestrian models can describe the individual and group behaviors and reproduce the empirical scenarios,so they can help researchers to analyze the walking behaviors and dynamic features of pedestrian flows.In the previous investigations,arch-like blockings in bottlenecks,lane formation in bidirectional flows,and other self-organization phenomena have been observed and studied by various approaches.[1,8]Furthermore,the escape panic[9,10]and the emergency evacuation process under normal conditions and from a smoke-filled or afire room[11–15]have been studied by using multiple pedestrian models.
Recently,intersecting flows become one of the topics of most concern because they are practically unavoidable and likely to cause clogging and accidents.The stripe formation is observed when two pedestrian flows intersect,but no stable pattern exists when three or more pedestrian flows intersect.[1,8]Zhang et al.proposed a two-dimensional model based on the cellular automata model in order to simulate pedestrians’crossing behaviors and the simulation results showed that this model can be applied successfully.[16]Saegusa et al.studied the intersecting flows under a periodic boundary condition by using the lattice gas model,and found that the overshooting in the fundamental diagram is attributed to the unstable congestion.[17]Guo et al.put forward a new microscopic model which is similar to the discrete choice model,and conducted several real pedestrian experiments with different intersecting angles to calibrate it.[18]Besides,pedestrians’avoidance behaviors in crossing flow were investigated in Ref.[19].
On the basis of the previous studies,little research has been reported about the dynamic features of intersecting flows with different cross angles,so we aim to find the direction of the stripes,the influence of the cross angles on dynamic fea-tures,and the moving details of pedestrians at intersections in this paper.The model we choose is the social force model, which is a continuous microscopic model.It is universally accepted that self-organization phenomena are the consequence of interactions,which are considered in the social force model. By using the social force model,we can reproduce the stripes formation successfully.To reflect the effect of the cross angles, we set up several simulation scenarios in which only the cross angles are different,and then investigate the mean speeds and the fluctuations of speed.By comparing the mean speeds and the standard deviations,we can obtain whether the cross angles affect the motion of pedestrians and what the effects are. As for the moving details,we adopt the approach that picks some individuals and then snapshots them for each second in a time period when they are at intersections,then we find the common regularities.
The organization of this paper is as follows.In Section 2, we will introduce the social force model.Section 3 presents the simulation scenarios.Section 4 shows the simulation results and their analysis.Section 5 is the conclusion summarizing the whole paper.
2.The social force model
Based on socio-psychological studies that both sociopsychology and physical forces affect the motion of pedestrians,Helbing et al.introduced the social force model to investigate the pedestrian movement,which is particularly suited for describing the occurrence of pressure in crowds.[9]
The social force model considers the influence of the neighboring pedestrians and the environment on individuals’movement in crowds.Pedestrians are driven by:the desired force,the interaction forcefijbetween pedestriansiand j, the interaction forcefiWbetween pedestrianiand wall W.The mathematical formula of the social force model is expressed as

where miis the mass of pedestrian i,and viis his or her actual velocity at time t.
Generally,pedestrians have certain destinations,so each pedestrian has a desired velocity and a desired direction.In practice,the actual speed and the desired speed are different due to the interference of obstacles and other neighboring pedestrians.The desired force expresses pedestrians’willingness to achieve the desired velocity.Pedestrianilikes to move with a certain desired speedin a certain directionand therefore tends to adapt his or her actual velocity viwith a certain characteristic time τi.So the desired force is given by
Pedestrian i prefers to keep a distance from other pedestrian j,so there exists an interaction forcefij.This force describes not only the psychological tendency to stay away from others,but also the physical force that occurs when the pedestrians touch each other.The interaction force between pedes-triansiandj is given by
where ridenotes the position of the center of mass of pedestrian i.In two-dimensional space,ri=(xi,yi),xiand yiare respectively the horizontal and vertical coordinates of the center of mass of pedestrian i.denotes the distance between the centers of the two pedestrians.rijdenotes the sum of the radii of the two pedestrians,namely,rij=ri+rj,where riand rjare the radii of pedestriansi and j,respectively.nijrepresents the unit vector pointing from pedestrian j to pedestrian i,tijrepresents the tangential direction,
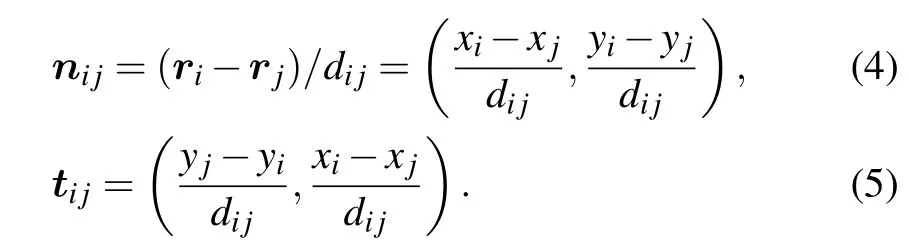

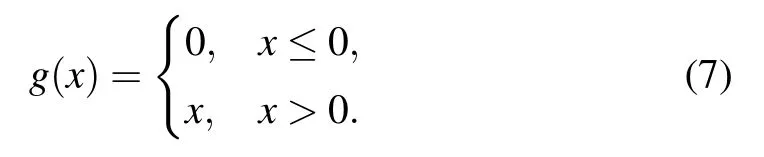
g(x)is a piecewise function
The term Aiexp[(rij−dij)/Bi]nijreflects the repulsive force describing the tendency that each pedestrian would like to keep a distance from others to avoid collisions,where Aiand Biare constants.
When dijis smaller than rij,the pedestrians touch each other and compressions emerge.In this situation,there exist two extra forces.The term kg(rij−dij)nijreflects the body compression force,which can neutralize the compression of the bodies.The term κg(rij−dij)Δvtjitijreflects the sliding friction force,which blocks the tangential motion.k and κ are large positive constants.
The interaction force between pedestrianiand wall W is treated analogously as
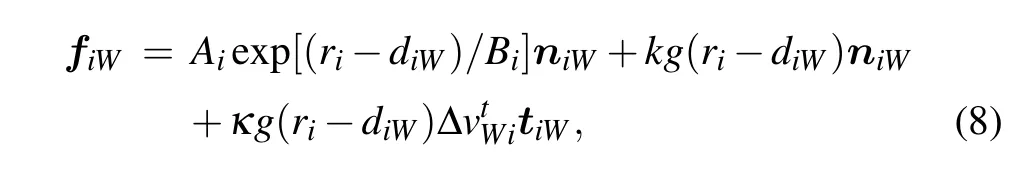
where diWdenotes the distance between pedestriani and wall W,niWdenotes the direction perpendicular to the wall pointing from the wall to pedestrian i,and tiWreflects the tangential direction.Since the speed of the wall is zero,the tangential velocity can be expressed as
3.Scenario setup
The subway stations,malls,stadia,or other public places are likely to show intersecting pedestrian flows.Intersections of pedestrian flows are one of the major problems that affect the safety and efficiency of pedestrian movement and impossible to avoid in practice,so it is meaningful to know how people behave at intersections and the effect of the cross angles.
Real-life experiment is unexpected and dangerous,so there is an urgent need to setup a reliable model to simulate the pedestrian motion.The parameters in the social force model are specified in Table 1,which is referred to in Ref.[9].
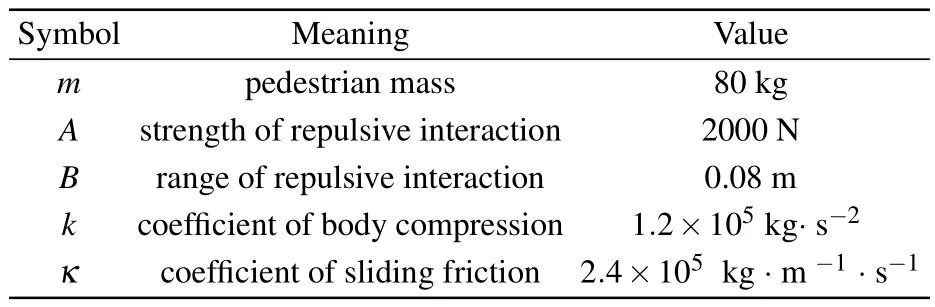
Table 1.Parameters of the social force model.
We study the intersecting flows which consist of two components of pedestrians moving into an area whose size is 50 m×50 m.The schematic diagram of the simulation scenarios is shown in Fig.1.Three simulation scenarios are built with different cross angles,which are 60°,90°,and 120°, named scenario 1,scenario 2,and scenario 3,respectively.For each scenario,the flow consists of two components of pedestrians;one component moves from west to east,and the other component moves from south to northeast or north or northwest.We use red hollow circles to represent the pedestrians going eastward and blue hollow circles to represent the pedestrians who walk in the other direction.
In each scenario,the initial speed of pedestrians on both sides is 0.On each side,the distance between pedestrians’initial positions and the entrance is 1 m,which is designed in order to allow the pedestrians to enter the area with their normal walking state.The width of pedestrians’initial position line is 4 m,that is,the initial positions are(−1 m,13–17 m), (13–17 m,−1 m)in scenario 1,(−1 m,23–27 m),(23–27 m,−1 m)in scenario 2,and(−1 m,13–17 m),(23–27 m,−1 m) in scenario 3.Also,the initial number of pedestrians and the inflow rate of the two streams are exactly the same in the three scenarios.The initial number is 50,and the inflow rate is set to 5 p/s.The positions and speeds of pedestrians are updated after each time step,and time step ΔT is set to 0.01 s.

Fig.1.(color online)Schematic diagram of the simulation scenarios. Hollow circles of different colors represent pedestrians walking in different directions,which are e1 and e2.θ represents the cross angle. The dashed square in the center of the area is the statistical area.
The parameters of the social force model in these scenarios,namely,the desired speed,reaction time,and body size, are identical.According to Ref.[20],the parameters are set as follows.Reaction time τ satisfies a uniform distribution between 0.2 s and 0.5 s with interval Δτ=0.05 s.The desired speed is subject to a normal distribution,the mean of which is 1.35 m/s and the standard deviation is 0.2.The radius uniformly distributes between 0.2 m and 0.3 m with interval Δr=0.025 m.The parameters are presented in Table 2.
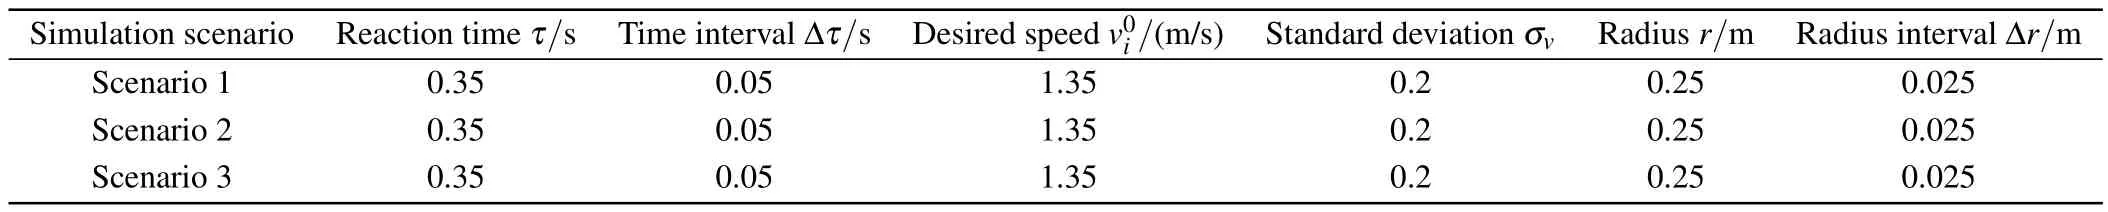
Table 2.Parameter settings in different scenarios.
The simulation time of each scenario is 150 s,and each scenario runs 10 times.
To ensure the accurate analysis of dynamic characteristics at intersections,only the data collected when the two streams of pedestrians intersect completely are used,so we define a statistical area of size 10 m×10 m,which is the central dashed square shown in Fig.1.The selection of the location of the statistical area is essential.The coordinates of the statistical area’s vertexes are selected as follows:In scenario 1,S1(23 m, 22 m),S2(33 m,22 m),S3(33 m,12 m),S4(23 m,12 m);in scenario 2,S1(20 m,30 m),S2(30 m,30 m),S3(30 m,20 m), S4(20 m,20 m);in scenario 3,S1(11 m,20 m),S2(21 m, 20 m),S3(21 m,10 m),S4(11 m,10 m).Only the data in the statistical area are considered.The dynamic characteristics of intersecting pedestrian flows can be analyzed by the mean speed and the fluctuation of speed.According to the observations,stripes are formed after 20 s,so we calculate the mean speed in the statistical area from 40 s to 150 s when the stripes are basically stable.
4.Analysis of the intersecting pedestrian flows
4.1.Direction of stripes
When two wide pedestrian flows intersect,stripe formation can be observed.This can be understood as a selforganized behavior,which means that the patterns are not planned or organized artificially,instead,the self-organization phenomena are considered as the consequence of interactions among pedestrians.What is more,the empirical investigations showed that the stripes are perpendicular to the sum of the directional vectors of the two pedestrian flows,[1]for example, the stripes are expected to have an angle of 45°in the case of a perpendicular intersection.
We try to find the collective pattern of intersecting flows in our simulations.As shown in Fig.2,in order to find the regularity noticeably,the vector diagram is given in the northwest.The red vector is the directional vector of pedestrians moving from west to east,and the blue vector is the directional vector of pedestrians moving from south to northeast. It should be noted that the magnitudes of the two vectors are the same.The black vector is the sum direction.We draw a magenta line which is perpendicular to the black vector.It can be seen clearly that the direction of the stripes is the same as the magenta line.
Figures 3 and 4 are analyzed analogously.It is apparent that the direction of the stripes is the same as the magenta line, which is perpendicular to the sum direction.
The conclusion drawn from our simulations is identical to the empirical investigations,that is,the stripes are perpendicular to the sum of the directional vectors of the two pedestrian flows.
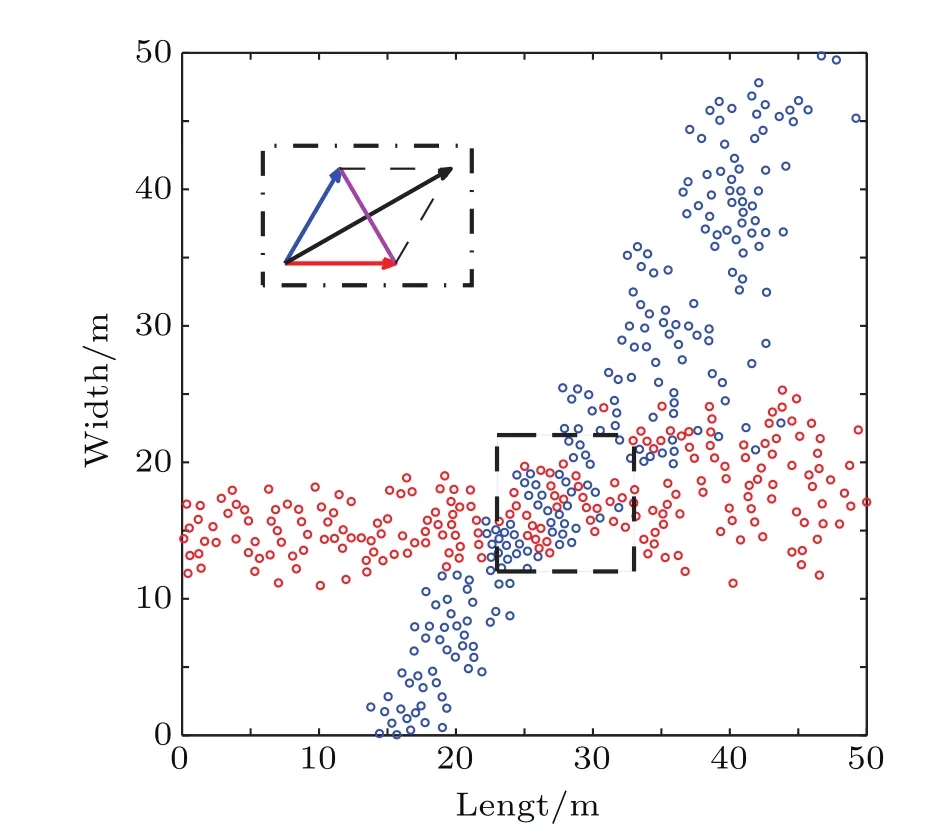
Fig.2.(color online)Stripes formation in scenario 1.The vector diagram in the northwest is a contrast from the perspective of geometry. The coordinates of the statistical area’svertexes are(23 m,22 m),(33 m, 22 m),(33 m,12 m),and(23 m,12 m).

Fig.3.(color online)Stripes formation in scenario 2.The vector diagram in the northwest is a contrast from the perspective of geometry. The coordinates of the statistical area’svertexes are(20 m,30 m),(30 m, 30 m),(30 m,20 m),and(20 m,20 m).

Fig.4.(color online)Stripes formation in scenario 3.The vector diagram in the northeast is a contrast from the perspective of geometry. The coordinates of the statistical area’s vertexes are(11 m,20 m),(21 m, 20 m),(21 m,10 m),and(11 m,10 m).
4.2.Analysis of speed with different angles
The performance of pedestrian flows is characterized by the mean speed and the fluctuation of speed.When the simulation is conducted once,we obtain a mean speed which is calculated from 40 s to 150 s.After running simulations of each scenario for 10 times,we obtain 10 mean speeds for each scenario,the results are shown in Table 3.In order to show the difference intuitively,we draw a line chart(see Fig.5)with the data from Table 3.Then we calculate the average value of 10 mean speeds and obtain the corresponding standard deviation for each scenario(see Table 4).The standard deviations are all less than 0.01,which means that the results are close to each other,thus the stability and accuracy of the results can be confirmed.

Table 3.Mean speeds(in units of m/s)of 10 simulations.

Table 4.Average value and standard deviation of 10 mean speeds.

Fig.5.(color online)Line chart of mean speeds of 10 simulations.The data are from Table 3.
As for the fluctuation of speed,we choose one from 10 simulations of each scenario as the example.The fluctuation diagrams are shown in Fig.6,which reflect the change of the speeds with the elapse of time.It is worth noting that each speed point in the diagram is the average value of all pedestrians’speeds in the statistical area at each time step.The mean speeds and standard deviations of instant speeds are shown in Table 5.
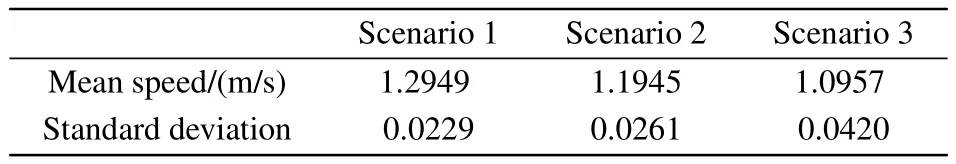
Table 5.One representation from 10 simulations.
By analyzing Tables 4 and 5 and Figs.5 and 6,we canfind that greater cross angle results in lower mean speed and higher level of fluctuation.Since three simulation areas are of the same size,higher mean speed re flects shorter time spent to pass through this area.
These results indicate that greater cross angle leads to stronger interactions among pedestrians in two directions, which means more con flicts at intersections.In order to get a precise and direct comprehension of the results,we draw a sample force diagram in which the cross angle is 120°(see Fig.7).Pedestrians who go eastward are regarded as group m and pedestrians moving in the other desired direction are regarded as group n.denotes the desired direction of pedestrian group m,is the perpendicular vector to it.fmnis the interaction force exerted on pedestrian group m by pedestrian group n.The interaction force can be decomposed in the directionsandThe component force in the directionopposes pedestrians’motion,while the component force in the directiondeviates the pedestrians’direction of motion.In scenario 1,on one hand,the interaction force exerted on pedestrian group m deflects the moving direction,on the other hand,it increases the speed of motion.In scenario 2, the interaction force deviates pedestrians’direction of motion. So the conclusion that greater cross angle leads to low mean speed and higher level of fluctuation is related to the interactions between pedestrians in two directions.When all pedestrians move in the same desired direction,that is,unidirectional pedestrian flows,pedestrians walk forward with rare interactions.In bidirectional pedestrian flows,pedestrians walking in opposite desired directions face each other with a great deal of conflicts,so the encountering pedestrians move a little aside to pass each other and the lane formation arises.Pedestrians moving in uniform lanes will have weak interactions,which is regarded as optimal self-organization.[21]Greater cross angle means bigger deviation between two directions,therefore pedestrians need to overcome more resistance to reach the desired location.
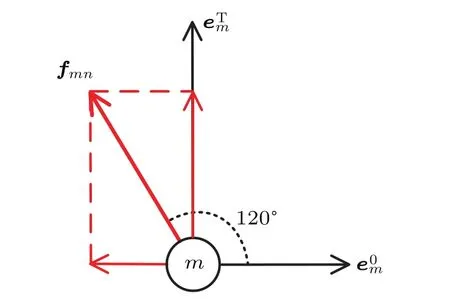
Fig.7.(color online)Sample force diagram of scenario 3.Pedestrians who go eastward are regarded as group m and pedestrians moving in the other desired direction are regarded as group n.denotes the desired direction of pedestrian group m,is the perpendicular vector to it.fmn is the interaction force exerted on pedestrian group m by pedestrian group n.The interaction force can be decomposed in the two directions.
Moreover,because of the dramatic speed changes in scenario 3,we infer preliminarily from experience that the fluctuation of speed is related to the process of congestion to some extent and a higher level of fluctuation is dangerous when the pedestrian density is large,while this inference should be verified by future work.
4.3.Analysis of individual motion details
In order to know how pedestrians move at intersections, we use different colors to mark several individual pedestrians, then we choose a time period and take snapshots for each second,the pictures are shown in Figs.8–10.
Figure 8 exhibits the snapshots of scenario 1 from 48 s to 51 s.We use magenta,red,and orange solid circles to mark three pedestrians who move from west to east and green,blue, and black solid circles to mark three pedestrians who moves from south to northeast.The blue solid circle is at a stripe precisely.In order to show clearly,we draw a magenta ellipse to highlight the stripe.It can be observed that this pedestrian moves with his or her neighboring pedestrians who have the same desired direction.Figure 8(d)shows that the black solid circle approaches to the stripe continually,because they have the same direction.
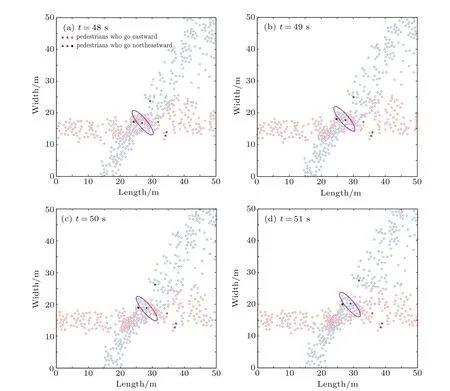
Fig.8.(color online)Snapshots of scenario 1 from 48 s to 51 s.Magenta,red,and orange solid circles represent three marked pedestrians who go eastward;green,blue,and black solid circles represent three marked pedestrians moving in the other direction. Magenta ellipse is used to show the stripe clearly.

Fig.9.(color online)Snapshots of scenario 2 from 47 s to 50 s.The marks are the same as those in Fig.8.Magenta and black ellipses are used to show the stripes clearly.
Figure 9 shows the snapshots of scenario 2 from 47 s to 50 s.Analogously,we use magenta,red,and orange solid circles to mark three pedestrians who move eastward and green, blue,and black solid circles to mark three pedestrians who move northward.At the beginning,the magenta solid circle is at a stripe,and we draw a magenta ellipse to highlight this stripe.With the elapse of time,the green solid circle approaches the intersection,and we use a black ellipse to highlight the stripe.It is obvious that they move with a group of pedestrians who have the same desired direction.What is more,the length of the stripe marked by the magenta ellipse has changed,which means that the pedestrians can extend along the stripe.
Figure 10 shows the snapshots of scenario 3 from 46 s to 49 s.The marks are made in the same way as scenario 1.In Fig.10(a),the green solid one is at a stripe,we use a magenta rectangle to highlight it.The magenta and red solid circles are at the same stripe and we draw a black rectangle to highlight the stripe.It should be noted that the width of the stripes is narrow,so we use rectangles to highlight the stripes in pictures. We can see clearly that the pedestrians move forward with the stripes.
The above observations and analysis lead us to the following conclusions.(i)Pedestrians always move forward with neighboring pedestrians who have the same desired direction, and these pedestrians form a group in the form of a stripe.(ii) As time goes by,it is possible that some other pedestrians who are in the same direction with the stripe and not far from the stripe will approach the stripe gradually(see Fig.8,the black one approaches the marked stripe gradually),and then join the pedestrian groups.(iii)The length of the stripe is not constant (see Fig.9),pedestrians can extend along the stripe.
As we all know,pedestrians moving in two different directions occupy the same space when these pedestrians meet at intersections,so they are not able to choose the direct way to go forward.By forming stripes,they are allowed to penetrate each other with less conflicts and can continue walking to their destinations without stopping.In this way,the stripe formation is an optimal way to pass the intersection.

Fig.10.(color online)Snapshots of scenario 3 from 46 s to 49 s.The marks are the same as those in Fig.8.Magenta and black rectangles are used to show the stripes clearly.
5.Conclusion
By using the social force model,we have investigated the direction of self-organized stripes,presented and analyzed the dynamic features of the intersecting flows with three typical cross angles,and found the way that pedestrians move at intersections.We have confirmed the empirical observations in simulations that pedestrians form stripes in a self-organized way when two pedestrian streams intersect and the direction of the stripes is perpendicular to the sum of the directional vectors of the two pedestrian flows.The simulation results show that greater cross angle results in more conflicts which are characterized by low mean speed and higher level of fluctuation.Greater cross angle is more likely to cause blockings and have adverse effects on the passing of pedestrians.What is more,we found that pedestrians move with stripes and can extend along the stripes.This phenomenon is regarded as an optimal way to pass the intersections quickly.
[1]Helbing D,Buzna L,Johansson A and Werner T 2005 Transportation Science 39 1
[2]Helbing D and Molnar P 1995 Phys.Rev.E 51 4282
[3]Teknomo K,Takeyama Y and Inamura H 2000 Proceedings Japan Society of Civil Engineering Conference,March,2000,Morioka,Japan, p.1
[4]Mehran R,Oyama Aand Shah M 2009 IEEE Computer Society Conference on Computer Vision and Pattern Recognition,June 20-26,2009, Miami,USA,p.935
[5]Zheng X P,Zhong T K and Liu M T 2009 Building and Environment 44 437
[6]Schadschneider A,Klüpfel H,Kretz T,Rogsch C and Seyfried A 2009 Multi-AgentSystems for Traffic and Transportation Engineering(Pennsylvania:IGI Global)pp.125–154
[7]Duives D C,Daamen W and Hoogendoorn S 2013 Transportation Research Part C 37 193
[8]Hoogendoorn S and Bovy P H L 2003 Optimal Control Applications and Methods 24 153
[9]Helbing D,Farkas I and Vicsek T 2000 Nature 407 487
[10]Zou Y,Xie J R and Wang B H 2016 Plos One 11 e0153388
[11]Yuan W F and Tan K H 2011 Physica A 390 4210
[12]Shi J Y,Ren A Z and Chen C 2009 Automation in Construction 18 338
[13]Zheng Y,Jia B,Li X G and Zhu N 2011 Physica A 390 3147
[14]Wang L,Zheng J H,Zhang X S,Zhang J L Wang Q Z and Zhang Q 2016 Chin.Phys.B 11 118901
[15]Yang X X,Dong H R,Yao X M and Sun X B 2016 Chin.Phys.B 25 048902
[16]Zhang J,Wang H and Li P 2004 Journal of Zhejiang University Science 5 835
[17]Saegusa T,Mashiko T and Nagatani T 2008 Physica A 387 4119
[18]Guo R Y,Wong S C and Huang H J 2010 Physica A 389 515
[19]Das S,Manski C F and Manuszak M D 2005 Journal of Applied Econometrics 20 529
[20]Yang X X,Winnie D,Serge P H,Dong H R and Yao X M 2016 Chin. Phys.B 25 028901
[21]Helbing D and Vicsek T 1999 New J.Phys.1 13
25 February 2017;revised manuscript
22 May 2017;published online 18 July 2017)
10.1088/1674-1056/26/9/098902
∗Project supported by the National Natural Science Foundation of China(Grant No.61233001)and the Fundamental Research Funds for the Central Universities, China(Grant No.2017JBM014).
†Corresponding author.E-mail:xmyao@bjtu.edu.cn
©2017 Chinese Physical Society and IOP Publishing Ltd http://iopscience.iop.org/cpb http://cpb.iphy.ac.cn
杂志排行

Chinese Physics B的其它文章
- Relationship measurement between ac-Stark shift of 40Ca+clock transition and laser polarization direction∗
- Air breakdown induced by the microwave with two mutually orthogonal and heterophase electric field components∗
- Collective motion of active particles in environmental noise∗
- Temperature dependence of heat conduction coefficient in nanotube/nanowire networks∗
- Heat transfer enhancement in MOSFET mounted on different FR4 substrates by thermal transient measurement∗
- Gas-sensor property of single-molecule device:F2 adsorbing effect∗