生态环境与农业气象研究进展
2017-07-19
1 农业气候资源与农业气象灾害
1.1 中国农业气象(小麦)模式(CAMM)初始版本的构建
从机理过程(作物生长过程、区域特色过程)、构造方法(插拔式建模、数据同化)和应用方式(实时运转、互联网)等方面确定了中国农业气象(小麦)模式的基本框架。明确了模式的基本功能、产品类型和内容。初步完成了模式基础网格、种植区、作物生长、发育、土壤等22种参数或变量初值的区域化。建立了小麦发育初值对温度的非线性响应和品种改良模式、冬小麦株高变化模式。形成了中国农业气象(小麦)模式(CAMM)的初始版本。(马玉平)
1.2 基于降水过程的玉米、油菜涝渍等级指标构建
创建了基于降水过程的玉米涝渍等级指标,提出了油菜涝渍过程灾变判别方法。针对现有玉米、油菜涝渍指标难以业务应用的难题,提出了基于风险逆过程分析的区域夏玉米、春玉米涝渍等级指标构建方法,解析了当前过程和前期降水量对玉米涝渍形成的影响效应,创建了基于涝渍当前过程和前期降水量的江淮夏玉米、江汉和江南西部春玉米不同生育时段涝渍等级指标,探索了玉米涝渍过程实时监测评估的天气学方法,为开展玉米涝渍监测评估业务提供了技术支撑。基于油菜涝渍临灾、受灾状态变化,采用降水量、连阴日数影响的动态累积模拟灾害发生过程,分生育期厘定临灾状态与受灾状态的临界线,构建了基于油菜涝渍过程的逐日灾变判别指标,确定了涝渍过程的灾变时间及灾害的后续影响时间,为区域油菜涝渍灾变过程的动态监测提供了方法支撑。(霍治国)
1.3 海南辣椒气象灾害综合风险评估研究
针对海南省辣椒干旱、洪涝、低温灾害风险综合评价,提出了不同灾害的危险性、敏感性、脆弱性和防灾减灾能力量化表征方法,基于层次分析法和熵权法,厘定了不同灾害影响因子的权重,建立了区域灾害风险综合评价模型,编制了海南辣椒气象灾害综合风险区划,经验证与实际发生情况相吻合。研究发现干旱和低温敏感性具有相似的空间分布,从中部向沿海减少,而洪涝敏感性相反;灾害的脆弱性主要集中在中部地区,与低防灾能力相似;海南东部遭受综合损害风险高(图1)。(霍治国)
1.4 华北平原冬小麦品种变化对发育期影响模拟研究中的不确定性
发育期模型是评价品种变化对作物发育期影响的主要研究工具。目前模拟品种变化对作物发育期影响研究中由模型机理和参数化方法导致的不确定性认识还不充分。针对此问题,收集了华北平原47个农业气象观测站1986—2012年冬小麦的发育期资料和同期的逐日平均气温数据,研究了4个常用的发育期模型和2种参数化方法下模拟结果中存在的不确定性及其来源。首先利用1986—1988年的观测资料校正模型参数,然后模拟1989—2012年的发育期,以定量研究冬小麦品种变化对发育期的影响。结果表明,经过参数校正,选用的4个模型和2个参数化方法均能较好地模拟1986—1988年的发育期,模拟误差(RMSE)都小于3 d。然而,在模拟品种变化对发育期的影响时,不同的模型和不同参数化方法间的结果差异却比较大。在营养生长阶段,影响的平均值为0.20 d/10a(95%的置信区间为-2.81~3.22 d/10a),在生殖生长阶段,平均值为1.50 d/10a(置信区间为-1.03~4.02 d/10a)。进一步的分析表明,模型机理和参数化方法均可引入不确定性,且机理的作用大于参数化方法。在营养生长阶段,模拟值的范围与发育阶段平均温度呈显著正相关关系,在生殖生长阶段则呈多项式关系,这表明不同模型得到的模拟值之间差异较大。由于无法评价哪个模拟结果更接近真实值,我们建议开展不同年代培育品种的试验研究,以进一步加深对此问题的了解。此外,为了降低不确定性,需要选择温度波动较大的年份对模型进行校正。(邬定荣)
1.5 基于MODIS和SEBAL模型的黄淮海平原冬小麦水分生产力研究
以MODIS 多时相遥感影像产品、气象数据和作物生育期为基础,借助SEBAL模型估算了黄淮海平原冬小麦实际蒸散量;通过MODIS NDVI光谱曲线特征与冬小麦单产数据的耦合,将县域尺度作物单产“降尺度”至基于像元的产量栅格图,实现冬小麦产量栅格化。在完成作物实际蒸散量模拟和产量栅格化基础上,对黄淮海平原冬小麦水分生产力进行估算。冬小麦水分生产力区域平均值为1.21 kg/m3,高值区主要位于北京、天津、山东北部和河北南部地区。在环渤海山东半岛滨海外向型二熟农渔区、海河低平原缺水水浇地二熟兼旱地一熟区和黄淮平原南阳盆地水浇地旱地二熟区,随着冬小麦产量的增加,其水分生产力增加;在燕山太行山山前平原水浇地二熟区水分生产力将随着实际蒸散量的减少和产量的增加而增大,同时产量增加对水分生产力提高的贡献大于实际蒸散量的减少;在江淮平原丘陵麦稻两熟区水分生产力的提高主要依靠实际蒸散量的减少。(杨建莹)
1.6 华北平原冬小麦作物系数降尺度估算方法——以固城农业气象实验站为例
作物系数(Kc)是计算作物实际蒸散的重要参数,也是估算作物需水量或耗水量的重要指标。目前,获取作物系数的主要方法中联合国粮农组织(FAO)推荐的“四段式”作物系数(Kc_FAO)是普遍采用的方法,但是对于冬小麦等越冬作物而言,因其在越冬前亦存在一个小的生长高峰期,故FAO推荐的“四段式”作物系数方法并不适用。本研究提出了基于冬小麦关键发育阶段的作物系数方法(Kc_stage),与FAO推荐的“四段式”作物系数方法相比,Kc_stage可以捕获冬小麦作物系数的双峰特征,能够更精细地刻画冬小麦的生长规律。同时,基于固城站涡度相关测得的实际蒸散数据,采用留一交叉验证的方法,评估了关键发育阶段作物系数和传统的FAO作物系数的优劣。结果表明,与实测ETa相比,基于Kc_stage和Kc_FAO估算的实际蒸散的均方根误差在逐日尺度上分别为0.07 mm/d和0.16 mm/d,在关键发育阶段尺度上分别为0.01 mm/d和0.27 mm/d,且用Kc_FAO方法在冬小麦生长初期会低估实际蒸散而在快速生长阶段和生长旺盛阶段则存在高估的现象。(王培娟)
1.7 黄淮海平原冬小麦最大可能蒸散的估算
作物最大可能蒸散(ETc)考虑了作物及当地地表状况,为当地地表实际覆盖情况下实际蒸散的理论上限值,能客观分析作物对水分的需求程度和农业干旱状况。基于遥感(叶面积指数和地表反照率)数据和逐日气象数据,利用Penman-Monteith公式,计算黄淮海平原小麦种植区27个气象站冬小麦生育期2000—2015年逐日蒸散,提取得到冬小麦生育期逐日最大可能蒸散数据集,并分析其时空变化特征及成因。结果表明,与联合国粮农组织(FAO)单作物系数法计算的最大可能蒸散ETc_kc对比,区域平均最大可能蒸散ETc的时间变化趋势与ETc_kc一致,空间分布上ETc符合客观实际。黄淮海平原冬小麦全生育期、越冬期和返青-拔节期ETc均呈北低南高的分布特征,日平均值分别为1.95 mm/d,0.46 mm/d和2.74 mm/d;其余3个生育期(越冬前、抽穗期、乳熟-成熟期)在空间分布上差异不大,日平均值分别为1.23 mm/d,4.71 mm/d和3.72 mm/d。冬小麦不同生育期(含全生育期)ETc的空间分布主要受叶面积指数分布特征的影响,二者呈显著正相关关系。(王培娟)
1.8 夏玉米苗期主要生长指标的土壤水分临界点确定方法
土壤水分不足是引起作物干旱的主要因素。准确确定作物生长变化响应土壤水分的临界点对客观辨识、监测作物干旱的发生发展具有重要意义。本研究基于6个初始土壤水分梯度的夏玉米持续干旱模拟试验,利用多元方差分析方法确定了对土壤水分变化敏感的玉米生长指标,提出了基于正态总体统计容忍下限确定玉米生长指标的临界土壤水分方法。结果表明,夏玉米苗期的茎含水率、叶含水率、蒸腾速率、光合速率、气孔导度和叶面积是对土壤水分变化敏感的玉米生长指标,其临界土壤水分(0~30 cm平均土壤相对湿度)分别为72%、65%、62%、60%、58%、46%,反映出随着土壤水分降低,玉米的茎含水率、叶含水率、蒸腾速率、光合速率、气孔导度和叶面积依次受到影响。研究结果可为夏玉米苗期干旱发生发展的监测和定量评估提供依据,也可为生态系统响应气候变化的阈值确定提供思路。(周广胜)
1.9 干旱对夏玉米苗期叶片权衡生长的影响
叶片是植物对干旱响应最敏感的器官之一,叶片性状变化及其权衡关系能够反映植物对资源的利用策略以及对干旱的适应对策。基于2014年6个初始土壤水分梯度的夏玉米持续干旱模拟试验研究表明,随着干旱的发展,夏玉米各叶片性状均会受到影响,但不同干旱程度的影响不一致。基于水分胁迫系数及干旱持续时间提出了干旱程度的定量表达,随着干旱的发生发展,干旱程度在0~1之间变化。当干旱程度小于0.21时,夏玉米叶片性状不会受到显著影响;0.21~0.76时,叶片性状大小受到影响,但变化趋势不会发生改变;0.76~0.91时,新叶形成补偿不了老叶脱落,有效叶片数、叶干重、绿叶面积和叶含水量等性状提前出现下降趋势;大于0.91时,叶片生长几乎停滞。夏玉米叶片性状在干旱条件下的适应性生长本质上体现了其在快速生长与维持生存之间的权衡,但不同干旱程度下,夏玉米叶片性状生长的权衡策略不同:未发生干旱时,夏玉米倾向于维持较高的代谢活性,一旦干旱程度大于0,夏玉米就会降低叶片代谢活性;当干旱程度小于0.48时,夏玉米倾向于通过迅速增加叶面积来吸收较多的能量,以获得较大的生长速率,为生殖器官的生长及产量形成储备能量;当干旱程度大于0.48时,夏玉米会减小单叶面积以减少水分散失,倾向于资源贮存以提高其生存能力。(周广胜)
1.10 中国产区苹果越冬冻害的风险评估
越冬期冻害是影响苹果种植分布和质量形成的主要气象灾害之一。利用1961—2014 年2084个气象站点资料和冻害调查数据,基于二分类Logistic 回归分别建立了越冬期初冬冻害和极端低温冻害发生的概率预测模型,并按照风险极低、低、中度、高、极高等5 个等级进行了空间划分。结果表明,建立的初冬冻害和极端低温冻害风险概率预测模型均通过了Hosmer-Losmer检验,独立样本的预测准确率分别达到了83.6%和91.4%。中国产区苹果的越冬冻害主要以初冬冻害为主,覆盖了除黄河故道和云南产区外的大部分果区,而极端低温冻害主要分布在纬度或海拔较高的环渤海湾北部产区、黄土高原西北部和北疆。两种冻害的高风险区域面积基本相当,中度以上风险面积较大的省份依次为甘肃、辽宁、河北和山西,但苹果种植面积最大的陕西和山东遭遇2种冻害特别是极端低温冻害的风险概率总体较低。(周广胜)
1.11 东北春玉米积温稳定性影响因素与积温模型的改进
以东北春玉米-四单19为例,获取其生长发育资料和同期气象观测资料,应用沈国权提出的非线性积温模型(NLM)进行拟合,分析了参数选择对积温稳定性的影响,提出使用平均温度的二次函数对线性积温模型(简称LM)进行修正(修正后模型称TRM)及效果分析,并与NLM结果进行比较。为分析东北春玉米不同品种在应用NLM时的适用性问题,结合东北地区春玉米生长发育的实际情况,以观测年份较多、观测地点较广为原则增加选取3个东北春玉米品种“东农248”“龙单13”和“丹玉13”,应用NLM进行拟合,分析并讨论参数的生物学意义及其与品种熟型的关系,对NLM进行了有效的改进及验证。结果表明:NLM拟合时参数P越小,拟合的有效积温越稳定;NLM计算的积温在年际间、地区间均存在差异,造成积温不稳定的主要原因是温度强度与其他因子相关性较差;各生育期有效积温与生育期平均温度呈二次曲线关系,将LM的温度二次方修正结果与NLM结果比较发现二次方修正的方法具有可行性;4个春玉米品种NLM均不存在无效参数,以积温变异较小为原则确定参数P=0.5;参数K与参数Q存在显著的相关性,说明参数K可能仅是一个统计参数,并没有明确的生物学意义;积温在品种间存在显著差异,全生育期模型参数Q与多年站次平均有效积温或活动积温有较好的相关性,由于不同的积温意味着不同的玉米品种熟型,说明参数Q与玉米品种的熟型有关,将模型参数Q和K用反映玉米品种熟型的参数(有效积温、活动积温)表示,建立了适用于不同品种的通用积温模型,取得较好的应用效果。研究成果对于农业气象指标的修订和服务能力的提升有指导意义。(郭建平)
1.12 不同遥感干旱指数在玉米全生育期的干旱监测能力分析
在国家自然科学基金中英国际合作重点项目 “基于高分雷达遥感和快中子水分传感技术发展近实时的高时空分辨的区域土壤湿度监测方法”的支持下,对比了当前主要的各个遥感干旱监测指数的业务监测能力,综合分析当前主要应用的光学遥感MODIS数据干旱指数。通过辽宁西北部2014年玉米全生育期10次遥感监测,并与地面15个土壤水分站的观测数据做相关分析,综合对比得出在玉米播种初期(5月)ATI指数监测效果最好,其他时期与土壤水分(0~10 cm)相关系数最高的是TVDI指数。所以综合来看,TVDI干旱指数遥感监测精度较高,适合大范围和玉米苗期以外的玉米各个生育期的干旱业务监测(图2)。(房世波)
1.13 雷达遥感在多云区水稻种植面积提取方法及精度评价
光学遥感在多云区的作物生长季很难获取遥感数据,限制了南方作物种植面积等的提取,雷达遥感可以穿透云等而获取数据,是多云区陆面信息提取的有效方法。然而如何利用作物本身的雷达回波的时间序列,分析获取准确的作物分布需要进一步研究。项目组基于早稻全生育期长时间序列的后向雷达回波的差异,获取了江西南昌县的2016年早稻分布面积,经过实地GPS调查和分类混淆矩阵分析得出,VV极化下,Kappa系数为0.79。水稻的用户制图精度为92.42%(图3)。(房世波)
2 农业对气候变化的响应与适应
2.1 多模式集合模拟气候变化对玉米产量的影响
利用1981—2009 年东北地区海伦、长岭、本溪3 地区农业气象站的历史气象资料和玉米作物数据, 分别建立作物统计模型并验证了APSIM 机理模型在研究区域的适用性。在此基础上,与CMIP5计划在RCP4.5 情景下的8个全球模式结合,基于多模式集合评估了未来2010—2039 年时段和2040—2069 年时段气候变化对玉米产量的可能影响(相对于1976—2005年基准时段)。研究结果表明,APSIM模型对玉米生长发育和产量形成有很好的模拟能力。玉米生育期的模拟误差(RMSE)为3~4 d,产量的RMSE 为0.6~0.8 t/hm2。建立的产量统计模型表明,玉米出苗阶段(5月中旬)的温度增加对产量增加有积极作用,而开花到成熟阶段(7月中旬到9月上旬)的温度和降水的增加、光照的不足均不利于产量增加。与1976—2005年基准时段相比,气候因素影响下2010—2039 年玉米减产3.8%(海伦)~7.4%(本溪),减产的概率为64%(长岭)~73%(本溪);2040—2069 年时段减产6.4%(海伦)~10.5%(本溪),减产的概率为74%(海伦)~83%(本溪)。未来2010—2039 年时段和2040—2069年时段基于机理模型模拟的产量降低分别为6.6%(海伦)~8.9%(本溪)和9.7%(海伦)~13.7%(本溪),均高于相应时段基于统计模型得到的0.9%(海伦)~6.0%(本溪)和2.0%(长岭)~7.3%(本溪)减产结果。(张祎)
2.2 未来气候变化对我国小麦生育期和产量的可能影响
利用中国农业气象(小麦)模式(CAMM)探讨了未来气候变化对中国小麦生育期和产量的可能影响。结果表明,未来气候变化对中国小麦生育期长度的影响并不明显,而品种改良才是更重要的影响因素。原因在于随着播种期的调整和返青期的变化,作物整个生育期的温度并未发生明显改变。生育期的延长并不必然导致产量升高,这可能是由于营养生长期旺长导致生殖生长期弱长的原因。由于气候预测和模型本身的不足,这一评估结果仍存在较大的不确定性(图4)。(马玉平)
2.3 我国北方春玉米生产对气候变化的响应识别研究
基于内蒙古土默特左旗农业气象试验站春玉米多年田间试验数据和逐日气象数据,分析了农业生产系统模型APSIM在内蒙古玉米产区的适应性,确定影响玉米发育期的关键环境因子,探讨发育期对环境因子的响应规律。结果表明:(1)验证后的APSIM玉米模型在内蒙古土默特左旗具有较好的适应性。(2)不同发育期,对环境影响因子的响应不同;影响开花期和成熟期日序迟早的共同主控因子首先是温度,其次为相对湿度和潜在蒸散,最后为风速;成熟期日序还与生育期内总降水量的变化成显著正相关;开花期日序对平均最低温度变化的变化最为敏感;成熟期日序对平均最高温度变化最为敏感,依次为平均温度,土壤表层平均温度和平均最低温度。(3)分别建立了反映春玉米关键发育期对环境因子响应关系的统计模型。以上结果为今后在内蒙古玉米产区开展解析春玉米生长发育进程及产量形成的限制因素等研究提供了技术支撑。(赵俊芳)
2.4 东北玉米适应气候变化措施对生产潜力的影响
为探求东北玉米未来如何更好地适应气候变化,本研究采用抗逆品种和推迟播种期2种适应措施,结合区域气候模式模拟的2010—2099年间RCP4.5、RCP8.5这2种浓度路径逐日气象资料,分析不同气候变化情景下东北玉米适应措施的生产潜力变化。结果表明,2010—2099年,东北区玉米气候生产潜力的空间分布特征基本为东南向西北减小的趋势,RCP4.5情景下东北玉米生产潜力高于RCP8.5情景,且RCP8.5情景下出现极低值年份明显多于RCP4.5情景。所有抗逆品种的玉米生产潜力均高于原有品种,RCP4.5情景下耐高温品种的玉米生产潜力更高,在RCP8.5情景下,耐旱品种表现更好,双耐(耐高温、耐旱)品种的玉米生产潜力在2种气候变化情景下均最高。RCP4.5情景下,推迟播种均出现增产情况,其中,推迟30~40 d播种的玉米增产率达到最大;RCP8.5情景下,部分地区出现减产情况。由此说明了适当推迟播种期有利于提高玉米气候生产潜力,但地区间存在差异。(郭建平)
2.5 华北平原冬小麦生育期温度条件变化趋势分析
统计分析了华北平原42个农业气象观测站1981—2010年的月平均气温、冬小麦发育日期和各主要生育阶段平均气温的变化特征。结果表明,研究期内华北平原冬小麦生长季的10月、12月和2—6月增温趋势显著,气候倾向率在0.44~1.05 ℃/10a(P<0.05),2月平均气温上升线性倾向率最大。气候变暖使冬小麦越冬阶段(50%的站点表现为显著增温,增温线性倾向率在0.45~1.18 ℃/10a)和返青—拔节阶段(64%的站点增温显著,增温速率达0.49~1.57 ℃/10a)的平均温度显著升高,从而导致冬小麦拔节—成熟日期显著提前,但冬小麦冬前生长阶段和拔节—成熟阶段的平均温度则未呈现上升趋势。冬小麦冬前生长阶段的温度环境因播种期适应性推迟而保持基本稳定,拔节—成熟阶段平均温度变化不明显则归因于发育期前移和当地气温的季节性变化特点。(谭凯炎)
2.6 甘肃农业对气候变化的适应与风险评估
系统阐述了甘肃省气候变化、农业气候资源、农业气象灾害、农业种植制度、农业气象灾损及其风险的时空演变,探讨了甘肃省农业适应气候变化的对策措施,可为推动甘肃农业健康可持续发展及气象精准扶贫脱贫提供决策依据。
(1)气候变化趋势。1961年以来,甘肃省平均气温、平均最高气温和平均最低气温均呈上升趋势,且平均最高气温上升幅度最大、平均气温上升最小。各季增温明显,其中冬季升温幅度最大,夏季升温幅度最小。平均年降水量和年日照时数均呈不显著的减少趋势。
(2)极端气候事件变化趋势。1961年以来,除祁连山西段呈下降趋势外,甘肃省其他地区极端最高气温均呈升高趋势;日最高气温≥35 ℃日数除祁连山区和甘南高原北部外均呈增加趋势,增加速率为0.3 d/10a。年极端最低气温除酒泉市西北部外均呈升高趋势,其中甘南高原增温最为明显。最长连续无降水日数在河西中东部、陇中中北部和西南部、陇东东部、甘南中部均呈增加趋势。
(3)农业气候资源演变。1961年以来,甘肃省日均气温≥0 ℃和≥10 ℃的初日均呈不同程度的提前趋势,终日呈不同程度推迟趋势。日均气温稳定通过0 ℃和10 ℃期间的降水量分布呈东南向西部递减趋势,且在河西大部呈增多趋势、河东大部呈减少趋势;积温均呈显著增加趋势;日均气温稳定通过0 ℃期间的日照时数在甘肃大部呈增加趋势,日均气温稳定通过10 ℃期间的日照时数在全省各地变化趋势不明显。
(4)农业气候资源变化对作物产量的影响。1980—2014年,冬麦区生育期平均气温升高使单产减少7.5%;气温日较差增大使单产减少6.7%;降水量减少使单产减少0.4%。春小麦平均气温升高使单产减少4.3%,气温日较差减小使单产增加0.7%,降水量增加使单产增加0.1%。玉米生育期平均气温升高使单产减少5.0%,气温日较差增大使单产减少1.2%,降水量减少使单产减少0.2%。1985—2014年,马铃薯生育期平均气温升高使单产减少1.8%,气温日较差减小使单产增加0.3%,降水量减少使单产减少0.3%。
(5)农业气象灾害演变。1961年以来,甘肃省气象干旱发生频率与强度呈明显增加趋势,春旱与伏旱发生范围呈明显扩大趋势,春末夏初旱与秋旱发生范围呈明显缩小趋势。全省大风(站)日数总体呈减少趋势,但2007年后呈增加趋势;暴雨日数呈不显著减少趋势,主要出现在河东地区;霜冻(站)日数呈先增后减趋势,20世纪80年代后减少趋势显著,其中初霜冻在2005年以来进入历史上低值时段。
(6)农业气象灾损时空演变。1961年以来,农业干旱灾害发展具有面积增大和危害程度加剧的趋势,干旱受灾、成灾和绝收率(25.2%、14.1%和2.2%)均明显高于全国平均(15.0%、8.1%和1.7%),增加速率(0.16%/10a、0.15%/10a和0.05%/10a)也高于全国平均。风雹灾害、暴雨洪涝灾害和低温冷害的综合损失率亦均呈增加趋势,增加速率分别为0.29%/10a、0.45%/10a和0.72%/10a。
(7)农业病虫害演变趋势及其影响。1981—2015年,气候变化总体有利于甘肃省农业病虫草鼠害发生面积扩大,危害程度加剧。病虫草鼠害、病害、虫害、草害和鼠害发生面积率分别以0.31/10a、0.20/10a、0.08/10a、0.06/10a、-0.03/10a的速率变化。农区病害、虫害和鼠害的发生面积率主要受温度影响,草害发生面积率主要受降水日数影响。无论是单产还是总产,病虫害危害可能损失递增率均是马铃薯>玉米>小麦,马铃薯病害>虫害,玉米虫害>病害,小麦病害>虫害。因此,未来需高度关注马铃薯和玉米的病虫害,尤其是马铃薯病害和玉米虫害的影响,同时也需注意小麦病害对单产的影响,进行重点防控治理。
(8)农业种植制度演变及其影响。与1951—1980年相比,1981—2013年一年两熟制作物可种植北界不同程度地北移,北移最大的地区有陇南、陇东和甘南高原。冬小麦种植北界不同程度西扩,西扩最大的地区为河西地区和甘南高原。冬小麦、玉米、春小麦、马铃薯等一年一熟种植模式转变为冬小麦—夏玉米一年两熟种植模式的变化可使单产大幅增加,陇南地区的冬小麦、玉米、马铃薯增产率分别达153.53%、65.13%和149.69%;陇中地区的冬小麦、玉米、春小麦、马铃薯增产率分别达84.56%、91.27%、76.42%和83.02%。
(9)农业适应气候变化的对策措施。针对气候变化背景下甘肃省农业生产面临的农业气候资源新特点与农业气象灾害的新形势,本研究(书)提出了一系列气候资源高效利用的新模式,以有效缓解气候变化对农业生产的不利影响,甚至将不利影响转变为有效的资源充分利用,提升甘肃农业生产水平,服务于甘肃绿色扶贫脱贫。主要包括:优化土地利用格局,充分利用光热资源;调整作物种植制度,主动适应气候变化;选育适宜作物品种,科学应对暖干化与病虫害影响;调整作物复种指数,提高耕地资源利用效率;调整作物品种布局,充分利用水热资源优势;针对气候变化分异,调整农区生产管理方式。(周广胜)
3 生态气象监测
3.1 典型草原植物响应干旱的指标及阈值
以CO2浓度和温度升高为标志的全球气候变化导致干旱等极端天气气候事件发生频率增加,对植物的影响已经产生且将持续到可预见的未来。开展植物响应干旱过程的研究有利于监测植物干旱发生、发展趋势,评估植物干旱状况,具有较强的实用价值。本研究基于典型草原植物外场模拟试验和降水变化与CO2浓度交互作用的开顶式生长箱模拟试验,从植物响应干旱过程的敏感指标受到胁迫的先后顺序、临界阈值、可塑性和关联度以及光合生理生态机制方面进行了定量分析及复水后各指标的变化研究;并探究了干旱指标及其阈值在高CO2浓度情景下的变化。主要研究结果如下:
(1) 羊草和克氏针茅生物学指标都是光合速率(Pn)和叶含水量最先受到干旱胁迫,土壤相对湿度阈值在49%~54%之间。羊草单叶面积先于叶数受到干旱胁迫,但克氏针茅叶数先于单叶面积受到干旱胁迫。
(2) 羊草和克氏针茅的形态指标干旱可塑性显示,两者植株叶面积在干旱过程中可塑性较大,羊草株高的可塑性大于叶数,但是克氏针茅叶数可塑性大于株高。羊草总叶面积、株高、叶数和地上生物量4个指标与干旱关联度差异不大;克氏针茅叶数与干旱关联度最大。在叶片的生理特征中,羊草蒸腾速率(Tr)与干旱关联度最大,克氏针茅饱和水汽压亏缺(VPD)与干旱关联度最大。
(3) 干旱胁迫下,首先饱和水汽压亏缺(VPD)增加,植物叶片气孔部分关闭,阻力增加,气孔导度(Gs)下降,从而使蒸腾(Tr)降低,减少失水速率,净光合速率(Pn)下降以气孔限制为主,但随着干旱的持续,叶绿素含量降低,胞间CO2浓度(Ci)增加,Ci/Ca(大气CO2浓度)值增大,非气孔限制上升为主导因素。
(4) 干旱复水后羊草和克氏针茅光合速率(Pn)和叶含水量以及羊草的叶绿素含量可以迅速恢复至充分供水水平,胁迫效应是可逆的;总叶面积和单叶面积复水后逐渐增大,但最终仍远小于充分供水水平。羊草的光合速率(Pn)、气孔导度(Gs)、饱和水汽压亏缺(VPD)和蒸腾速率(Tr)等指标的变化程度要大于克氏针茅;光合速率(Pn)和叶片含水量受到干旱胁迫的时间比克氏针茅早,土壤相对湿度阈值比克氏针茅高,复水后,羊草光合速率(Pn)和地上生物量恢复的程度也大于克氏针茅,表现出羊草对干旱和复水的敏感性要大于克氏针茅。
(5) 在当前和高CO2浓度情境下,总叶面积/叶片数、叶水势/叶片含水量和地上生物量可分别从形态、生理和生物量积累3方面反映克氏针茅水分状态。CO2浓度升高条件下干旱指标的敏感性会发生变化。CO2升高将降低上述5个干旱指标的降水阈值。(周广胜)
3.2 中国草地固碳的时空动态及其控制机制
中国草地占国土面积的40%以上,分布范围广泛,是气候敏感区和生态脆弱区,也是受人为活动影响最为严重的区域。准确评估中国草地固碳的时空动态、揭示其控制机制是草地碳收支评估的难点与热点。本研究基于2011—2013年中国草地碳收支野外调查数据以及相关文献资料,校准并验证陆地生态系统模型(TEM 5.0),模拟了1961—2013年中国草地固碳的时空格局特征,探讨了气象要素(温度、辐射和降水)的年际变化及其空间分布对中国草地固碳的影响,分析了未受干扰情况下,当前气候背景、RCP4.5和RCP8.5气候情景的中国草地的固碳潜力。主要结论如下:
(1) 1961—2013年间,面积为3.95×10⁶km2的中国草地表现为碳汇,强度为19.06 Tg C/a,53年间共固碳1.01 Pg C。其中,内蒙古草原(5.77 Tg C/a)、新疆草地(5.44 Tg C/a)和青藏高原草地(5.16 Tg C/a)是中国草地碳汇的主体,三者对碳汇的贡献达85.9%。由于草地植物净初级生产力(NPP)和土壤呼吸(RH)对年际间温度变化的敏感性不同,中国草地碳收支(NEP)表现出显著的年际变化趋势。在年代际总量上,中国草地各年代际均表现为碳汇,其中2001—2010年的碳汇强度最大(63.33 Tg C/a),占1961—2010年5个年代总碳吸收值的57.6%。研究区域内碳汇增加表现为植被碳库和土壤有机碳库的增加。
(2) 中国草地单位面积多年平均NEP为4.84 g C/(m2a),研究区域整体表现为碳汇。从空间分布来看,碳汇主要分布在青藏高原西部、内蒙古草原东北部和新疆草地北部,而碳源主要分布在青藏高原东南边界、东北边界以及西部边界,碳源区仅占研究区域总面积的13.5%。研究时段内,中国草地大部分区域NEP呈增加趋势,占研究区域总面积的82.5%,主要集中在青藏高原西北部、新疆草地北部和内蒙古草原东北部等碳汇区,NEP减少的区域主要分布在内蒙古草原西北部、青藏高原西南部和东北部以及南方草地区等碳汇能力相对较弱的地区,占研究区域总面积的17.5%。
(3) 研究时段内,中国草地区域年平均温度呈显著增加趋势,降水量年际波动较大,在空间格局上自东南向西北递减,年代际间变化呈干燥(60年代、70年代)—湿润(80年代、90年代)—干燥(21世纪初期)趋势。区域年均NEP与年均温度、年降水量呈正相关关系,与辐射相关性不显著。年际间温度和降水变化是中国草地NEP年际波动的关键原因。
(4) 1961—2013年中国草地年均固碳潜力为18.41 Pg C/a,其中土壤年均固碳潜力为18.12 Pg C/a,植被年均固碳潜力为0.29 Pg C/a。从单位面积固碳潜力的空间分布上看,各年代草地固碳潜力的空间格局大体一致,青藏高原和新疆准噶尔盆地的草地固碳潜力较大,固碳潜力一般大于10000 g C/(m2a);南方草地固碳潜力一般在1000~5000 g C/(m2a)之间;其他草地固碳潜力较小。
(5) 无人为干扰影响的RCP4.5和RCP8.5气候情景下,中国草地碳储量在研究时段内均呈显著增加趋势,平均增加速率分别为61.0 Tg C/(m2a)(RCP4.5)和234.2 Tg C/(m2a)(RCP8.5);且2种气候下碳密度变化的空间分布较一致,2011—2040年间中国草地生产系统碳密度以增加为主,增加较显著的区域主要是青藏高原草地和内蒙古草原。
(6) RCP4.5气候情景下,2011—2040年中国草地年均固碳潜力为18.01 Pg C/a,其中草地土壤固碳潜力约17.78 Pg C/a,草地植被固碳潜力约0.24 Pg C/a。RCP8.5气候情景下,2011—2040年中国草地年均固碳潜力为18.00 Pg C/a,其中草地土壤固碳潜力约17.79 Pg C/a,草地植被固碳潜力约0.20 Pg C/a。两种气候情景下,中国草地固碳潜力的分布格局相似。以2030年代为例,新疆准噶尔盆地的草地单位面积固碳潜力最大;其次是新疆中部天山和南部昆仑山、部分内蒙古草地,以及青藏高原南部、中部和东南部草地;余下草地的单位面积固碳潜力很小,一般不超过5000 g C/(m2a),有些地方近似为零。(周广胜)
4 成果应用
4.1 基于集合卡尔曼滤波的PyWOFOST模型在玉米估产中的应用
改进并评估了基于集合卡尔曼滤波(EnKF)构建的遥感信息-作物模型耦合模型(PyWOFOST)在东北玉米估产中的适用性。该成果已于2017年底在中国农业科学院农业信息研究所农作物生长机理和空间遥感同化技术的县域产量风险预测模型的服务中得到了应用。(赵艳霞)
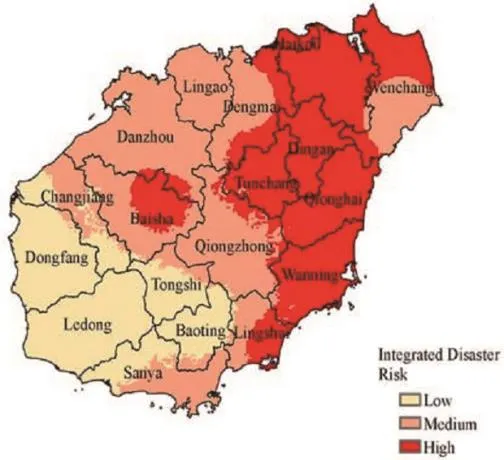
图1 海南省辣椒灾害综合风险区划Fig.1 Distribution of integrated risk for major disasters in paprika pepper in Hainan Province

图2 玉米全生育期不同遥感干旱指数与土壤水分(0~10 cm)相关系数及其与云量(%)的关系Fig.2 Comparison of the correlational relationship (r value) of each index and the average percentage of cloud coverage (%) in the whole study area from 9 May to 22 September, 2014
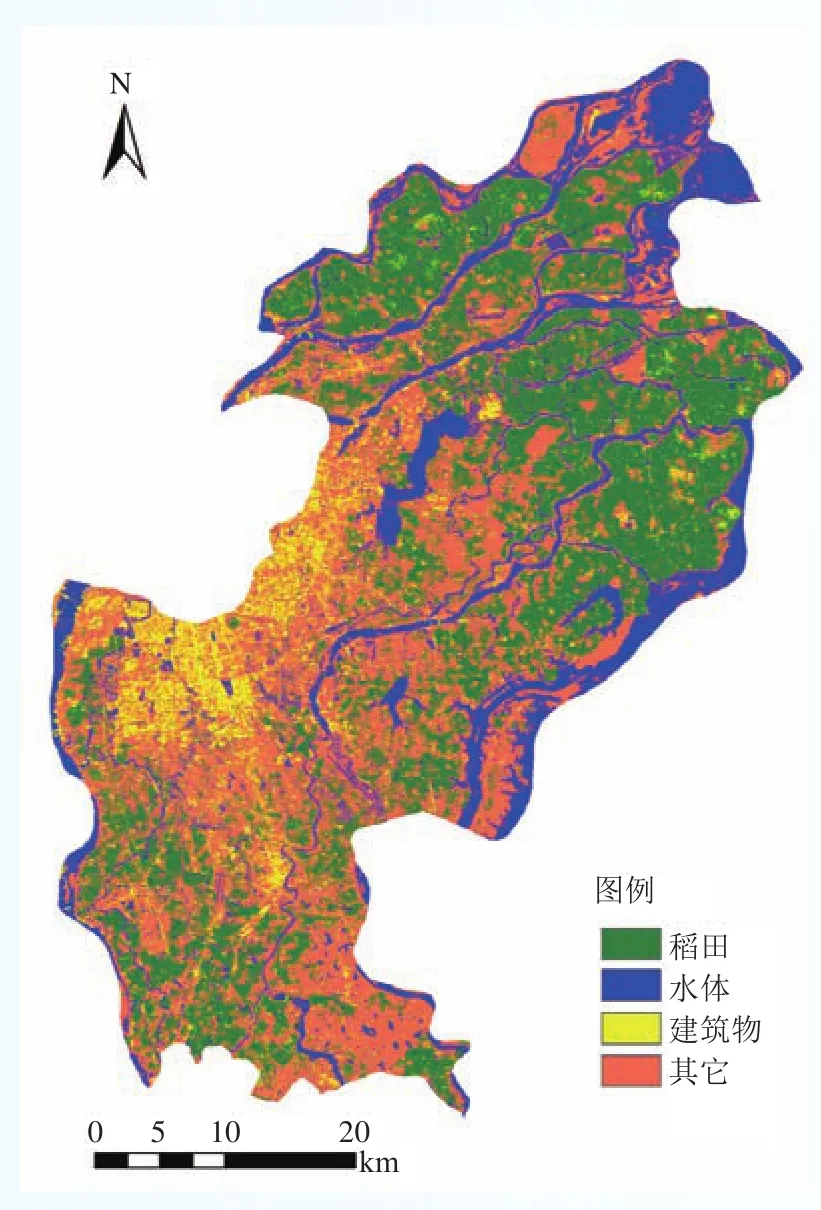
图3 2016年江西南昌县早稻分布信息Fig.3 Spatial distribution of early rice information in 2016 in Nanchang County, Jiangxi Province

图4 未来气候变化对我国小麦生育期和产量的可能影响Fig.4 The possible influence of future climate change on the growth period and yield of wheat in China
Progress in Ecology and Agrometeorological Research
1 Agroclimatic resources and agrometeorological disasters
1.1 Construction of the initial version of the Chinese AgroMeteorological (wheat) Model (CAMM)
The basic framework of Chinese Agrometeorological (wheat) Model (CAMM) was determined from the aspects of mechanism processes (crop growth process, regional characteristic process), construction method(insert and pull type modeling, data assimilation), and application mode (real-time operation and Internet).The basic function, product type, and content of the model were clarified.We had preliminarily completed the regionalization of 22 parameters or initial values of the model.Such as base grid, planting area, crop growth,development, soil parameters and so on.The models of the nonlinear response of the initial value of wheat development to the temperature, the variety improvement, the change of winter wheat height were established.The initial version of the Chinese agrometeorological (wheat) model was constructed.(Ma Yuping)
1.2 Establishment of waterlogging level indices based on the rainfall process with corn and rape
We have constructed the corn waterlogging level indices based on the rainfall process and presented a method to judge the catastrophe of rape waterlogging process.On the puzzle of existing corn and rape indices difficult to be applied to meteorological work, a method of constructing the regional summer corn and spring corn waterlogging grading indices based on risk reverse course analysis has presented, the effect of current precipitation process and antecedent precipitation on corn waterlogging formation has been parsed and the level indicators of corn waterlogging in the different growing phases based on current precipitation process and antecedent precipitation in Jianghuai summer corn, Jianghan and Jiangnan West Region spring corn has been built up.The study explored a synoptic method for real-time monitoring and assessment of corn waterlogging and provided technical support for monitoring and assessment business of corn waterlogging.Based on the changes of impending hazard state and affected state in the rape waterlogging process, dynamic accumulative effect of precipitation and continuous cloudy days has been used to simulate the development of waterlogging and the critical line between impending hazard and affected in different growing periods has been found.A day-to-day distinction index based on the rape waterlogging catastrophe process has been built then.It can be used to determine the occurrence time of disaster and duration of catastrophe and the disaster duration after the precipitation, which provided methodological support for dynamic monitoring of catastrophe of rape waterlogging.(Huo Zhiguo)
1.3 Integrated risk assessment of meteorological disasters with paprika pepper in Hainan Province
For the integrated risk assessment of meteorological disasters, including drought, flood and chilling with paprika pepper in Hainan Province, the methods to quantify the hazard, sensitivity, vulnerability and prevention capability with different disasters have been put forward.Based on the Analytic Hierarchy Process and Entropy method, the combined weight was given to each disaster factor, thus an integrated disaster risk assessment model was developed and applied at regional level, and then mapped the distribution of integrated risk for major disasters in paprika pepper in Hainan.Drought and chilling sensitivity had a similar spatial distribution, which decreased from the central to the coastal regions while flood sensitivity was the opposite.High vulnerability of the disasters mainly occurred in the central regions, similar to low prevention capability.Eastern Hainan suffered from high integrated damage risk (Fig.1).(Huo Zhiguo)
1.4 Uncertainty in simulating the impact of cultivar improvement on winter wheat phenology in the North China Plain
The phenology model is one of the major tools in evaluating the impact of cultivar improvement on crop phenology.Understanding uncertainty in simulating the impact is an important prerequisite for reliably interpreting the effect of cultivar improvement and climate change on phenology.However, uncertainty induced by different temperature response functions and parameterization methods have not been properly addressed.Based on winter wheat phenology observations during the years 1986–2012 in 47 agro-meteorology observational stations in the North China Plain (NCP), the uncertainty of the simulated impacts caused by four widely applied temperature response functions and two parameterization methods were investigated.The functions were firstly calibrated using observed phenology data during 1986–1988 from each station using two parameterization methods and were then used to quantify the impact of cultivar improvement on wheat phenology during 1986–2012.Results showed that all functions and all parameterization methods could achieve acceptable precision (RMSE<3 days for all functions and parameterization methods), however,substantial differences still exist in the simulated impacts between different functions and parameterization methods.For vegetative growth period, the simulated impact is 0.20 day 10yr–1(95% conf i dence interval –2.81 – 3.22 day 10yr–1) across the NCP, while for reproductive period, the value is 1.50 day 10yr–1(–1.03 – 4.02 day 10yr–1).Further analysis showed that uncertainty can be induced by both different functions and parameterization methods, while the former has greater influence than the latter.During vegetative period,there is a significant positive linear relationship between ranges of the simulated impact and growth period average temperature, while during reproductive period, the relationship is polynomial.This highlights the large inconsistency that exists in most impact quantifying functions and the urgent need to carry out field experiment to provide realistic impacts for all functions.Before applying a simulated effect, we suggest that the function should be calibrated over a wide temperature range.(Wu Dingrong)
1.5 Investigation on water productivity of winter wheat based on MODIS and EBAL in the Huang-Huai-Hai Plain, China
Understanding how the productivity of water can be increased is widely accepted to be a high priority where water resources are currently scarce and/or over-exploited in China.As the primary data source, MODIS remote sensing, statistics, meteorological data, crop growth period data, and ground truth-data from Jan.2011 to Dec.2012 were used in actual evapotranspiration estimation, yields rasterizing, and water productivity calculation for winter wheat in the Huang-Huai-Hai Plain (3H Plain).The statistical data were synthesized to calculate district-state-level land productivity, which is then further extrapolated to pixel-level values using a MODIS NDVI image based on a crop dominance map.Spatial variation of crop water productivity was investigated in order to reveal the key factors of crop water productivity.The regional average value of water productivity for winter wheat was detected to be 1.21 kg • m–3, with the higher value in Beijing, Tianjin,northern part of Shandong Province and southern part of Hebei Province.The pronounced relationship of spatial correlation of the yield and water productivity for winter wheat indicated that the increasing yield governed the increment of water productivity for winter wheat in the coastal land-farming-f i shing area, low plain-hydropenia irrigable land and dry land zone and basin- irrigable land and dry land.The increasing water productivity for winter wheat was recognized to be controlled by rather the increment of yield than the reduction of actual evapotranspiration for winter wheat in the piedmont plain-irrigable land.Whereas, the pronounced relationship of negative correlation of water productivity and actual evapotranspiration for winter wheat described that only the reduction of actual evapotranspiration was responsible for the increment of water productivity for winter wheat in hill-wet hot paddy-paddy field.The results provide a basis information for agricultural water management, improvement of crop water productivity and choice of adaptive mechanism under climate change in Huang-Huai-Hai plain.(Yang Jianying)
1.6 Temporal downscaling of crop coefficients for winter wheat in the North China Plain: A case study at the Gucheng Agro-Meteorological Experimental Station
The crop coefficient (Kc) is widely used for operational estimation of actual evapotranspiration (ETa)and crop water requirements.The standard method for obtainingKcis via a lookup table from FAO-56 (Food and Agriculture Organization of the United Nations Irrigation and Drainage Paper No.56), which broadly treatsKcas a function of four crop-growing stages.However, the distinctive physiological characteristics of overwintering crops, such as winter wheat (Triticum aestivumL.), which is extensively planted in the North China Plain (NCP), are not addressed in this method.In this study, we propose a stage-wise method that accounts forKcvariations for winter wheat at each critical phenological stage, thereby estimatingKcat finer temporal scales.Compared with the conventional FAO method, the proposed stage-wise method successfully captures the bimodal pattern inKctime series for winter wheat, which is shown at both tenday and phenological time scales.In addition, the accuracies of the proposed stage-wiseKcmethod and the FAO method were evaluated using micro-meteorological measurements of ETacollected at the Gucheng agrometeorological experimental station in the NCP.Using a leave-one-out strategy, the evaluation revealed that the stage-wise method significantly outperformed the FAO method at both daily and critical phenological time scales, with root-mean-square errors in ETafor the stage-wise method and the FAO method being 0.07 mm day−1and 0.16 mm day−1, respectively, at the daily time scale, and 0.01 mm day−1and 0.27 mm day−1at the critical phenological time scale.Generally, the FAO method underestimates ETaduring the initial stage and overestimates ETaduring both the development and mid-season stages.It is shown that the proposed stagewise method is important for the water-stressed NCP where precision irrigation is highly desirable, especially during the critical phenological stages.Results from this study provide insight into accurate estimation of water requirements for winter wheat at phenological time scales.(Wang Peijuan)
1.7 Estimation of crop evapotranspiration under standard conditions for winter wheat in the Huang-Huai-Hai Plain
Crop evapotranspiration under standard conditions (ETc) is defined as the evapotranspiration from disease-free, well-fertilized crops grown in large fields, under optimum soil water conditions, and achieving full production under the given climatic conditions.The calculation of ETcconsiders crop and local surface conditions.ETcis the theoretical upper limit of actual evapotranspiration for actual local surface coverage,ensuring objective analysis on crop water requirements and agricultural drought.To summarize the spatial and temporal distribution characteristics and their causes of ETc, daily ETcis calculated based on Penman-Monteith method using meteorological data and satellite remote sensing data from 2000 to 2015.The meteorological data are provided by 27 meteorological stations in the winter wheat growing area of the Huang-Huai-Hai Plain.The satellite remote sensing data area extracted from NASA MODIS products (LAI (MOD15A2) and Albedo (MCD43C3)) at the corresponding location of 27 meteorological stations.ETc_kcis calculated based on single crop coefficient approach recommended by FAO.Results show that daily dynamic changes of ETcand ETc_kcare consistent in the regional time scale.However, compared with ETc_kc, ETchas a spatial distribution corresponding to the objective reality.The growth period of winter wheat is divided into five stages: Before wintering stage, wintering stage, returning green-jointing stage, heading stage and milky maturity-maturity stage.With the spatial distribution characteristic of higher in the south and lower in the north, the average daily ETcin the whole winter wheat season, wintering stage and returning green-jointing stage are 1.95 mm,0.46 mm and 2.74 mm, respectively.The average value of ETcis 1.23 mm before wintering stage, and the whole fluctuation of ETcin the Huang-Huai-Hai Plain is small.There is no significant fluctuation in ETcin heading stage and milky maturity-maturity stage except for the central part of the Huang-Huai-Hai Plain.The average values of ETcare 4.71 mm and 3.72 mm in these two growth stages, respectively.In terms of spatial distribution, extremely significant positive correlation is shown between LAI and ETcin all growth period.In wintering stage, returning green-jointing stage, and milky maturity-maturity stage, ETcalso shows a higher significant negative correlation coefficient with albedo.During the whole growth period of winter wheat, ETchas a higher partial correlation coefficient with LAI and water vapor pressure.These results can provide basic data for drought monitoring and wet or dry climate zoning in China, and also provide a new idea for the actual evapotranspiration estimation.(Wang Peijuan)
1.8 Developing a method to determine critical soil water contents of growth indicators of summer maize in the seedling stage
Deficit in soil moisture is the main cause of crop drought.Accurate determination of the thresholds of crop growth change responding to soil water is of great importance for identification and monitoring of the occurrence and development of crop drought.Based on the data of a progressive drought simulation experiment with 6 primary soil water gradients on summer maize, one-way MANOVA method was performed to identify maize growth indicators sensitive to soil water variations, and the method of normal population statistic tolerance limits was proposed to identify the threshold of maize growth indicator responding to the change of soil water content.The results showed that the stem and leaf moisture content, transpiration rate,net photosynthetic rate, stomatal conductance, and leaf area of summer maize were maize growth indicators responding to the change of soil water content in the seedling stage, and their corresponding critical soil water contents at the top of 30 cm were 72%, 65%, 62%, 60%, 58%, and 46%, respectively, indicating the changing order of stem moisture content, leaf moisture content, transpiration rate, net photosynthetic rate, stomatal conductance, and leaf area responding to the decrease of soil water content.These results could provide reference to the monitoring and quantitative assessment of the development of drought to summer maize during the seedling stage, and also a way to determine the thresholds of ecosystems responding to climate change.(Zhou Guangsheng)
1.9 Revealing the effects of drought on the trade-off growth of leaf traits of summer maize in the seedling stage
Changes in leaf traits and their trade-offs are reflections of how plants use resources as well as their adaption strategies to environmental changes.Drought is known as one of the greatest threats to the growth and development of plants worldwide, while leaf is one of the most sensitive parts of plants to drought.At present,the influences of drought on leaf traits have been widely studied, but less involved in the trade-off growth between different leaf traits during the progress of drought, which limits the understanding of plant adaptation strategies in the arid environment.Maize was one of the leading crops in the world, while it was also the most susceptible one to drought.Understanding how the leaf trait of maize changes during the progress of drought and their trade-off growth would help promote the understanding of the adaptation strategies of maize plant to drought and contribute to make targeted drought-resisting and drought-relief measures.Therefore, based on the consecutive drought simulation experiments with 6 primary soil water levels on maize that conducted in 2014, we investigated the changes of 5 key leaf traits of maize, they were the green leaf area, the leaf dry mass,the specific leaf weight, the leaf water content, and the effective leaf number, as well as the trade-off growth between green leaf area and effective leaf number, green leaf area and specific leaf weight, leaf dry mass and leaf water content, respectively.Besides, we newly developed an indicator to quantitatively evaluate drought degree, which consisted of available soil water content, readily available soil water content, and drought duration time, comprehensively involved factors that related to intensities and progresses of water deficit, such as soil texture, meteorological environment, plant water requirement, and so on.Based on this indicator, we quantitatively characterized how these leaf traits change and their trade-off strategies under different drought degrees.The results showed that every leaf trait investigated here would be affected by drought, however,the extent to which they were affected relied on the drought degree.The leaf traits would not be affected significantly when the drought degree was below 0.21, and their quantities would be affected while their tendencies would not when the drought degree was between 0.21–0.76.When the drought degree increased to 0.76–0.91, the effective leaf number, dry mass of leaf, green leaf area, and leaf water content would decrease prematurely due to the fact that the growth of new leaves failed to compensate the losses caused by senescence of old leaves.When the drought degree exceeded 0.91, it would lead to stagnation in leaf growth, and leaf traits would barely change.The adaptive growth of leaf under drought embodied its trade-off between rapid growth and survival, which varied along with drought degree.Maize would maintain high metabolic activities of leaves until the drought degree was greater than 0.When the drought degree was below 0.48, maize tended to rapid growth by investing more resources for leaf expansion so that more energy could be absorbed.When the drought degree exceeded 0.48, maize would tend to conserve resource for survival by maintaining relatively lower metabolic activities and smaller size of leaves to minimize water loss.(Zhou Guangsheng)
1.10 Risk assessment of winter injury in the main apple-producing regions of China
Winter injury is one of the main meteorological disasters that affect apple growing distribution and quality.The existing research mainly takes into account winter injury in deep dormancy caused by extremely low temperatures, mostly the occurrence frequencies of the coldest monthly mean temperature, extreme minimum temperatures as meteorological indicators for risk assessment and division of distribution boundaries.But fruit trees cold resistances during different dormant phases have significant differences and are closely related to the process of cold-resistance exercises in fall.The probability forecasting model of early winter injury and extreme winter cold injury are established by the binary Logistic regression, on the basis of data from 2084 meteorological stations and the disaster caused by winter injury from 1981 to 2010.The spaces are divided into five risk degrees as very low, low, moderate, high and very high.Winter injury probability classification standards are referred to the IPCC report of the assessment of possibilities of classification criteria.The results showed that the probability forecasting model of early winter injury and extreme winter cold injury passed the Hosmer-Losmer test, the independent sample prediction accuracy reached 83.6% and 91.4%, respectively.Early winter injury depends mainly on the parameters as first frost and the interval between the beginning date and the date of first frost of the lowest temperature ≤–15 °C.The extreme winter cold injury was affected by the average temperature of the coldest month and the cold accumulated temperature of the lowest temperature≤–20 °C.The freezing injury caused by extreme short-term low temperature is of small occurrence probability and limited influence scope.The extreme low-temperature injury in winter is mainly caused by the continuous intimidation of strong and low temperature, which is compatible with the existing observation facts.Early winter injury is main freezing injury in the main apple-producing regions of China, including most regions in addition to ancient Yellow River and Yunnan.Wherein, most parts of Around Bohai Bay Area and Loess Plateau Area are within the low-risk area.In addition to Dalian, all parts of Liaoning are within the moderaterisk area.Meanwhile, Baoding in Hebei, Changzhi in Shanxi, Yan’an in Shaanxi, and northern area of Jingning in Gansu are within the moderate or severe risk area.Areas with the extreme winter cold injury are mainly distributed in high latitude or high altitude, including the northern Bohai Gulf, the northwest of the Loess Plateau and northern Xinjiang.Within main producing areas of big apple, areas with higher risks from extreme low-temperature freezing injury include Benxi and Fushun in Liaoning, southern part of Zhangjiakou in Hebei,Datong and southern part of Shuozhou in Shanxi as well as Yining in Xinjiang.High risk areas of early winter injury and extreme winter cold injury are almost equal.Gansu province tops the list of above moderate risk,followed by Liaoning, Hebei and Shanxi.On the other hand, there are low risks of winter injury in Shaanxi and Shandong, especially for extreme winter cold injury.(Zhou Guangsheng)
1.11 Impact factors of accumulated temperature stability and improvement of accumulated temperature model of northeast spring maize
Based on the observations on the growth and development of spring maize and meteorological observational data in Northeast China, the spring maize “Sidan19” is firstly taken as an example.The nonlinear accumulated temperature model proposed by Shen Guoquan (or simply as NLM) with good stability is adopted to fi t, and the influence of the selection of parameters on the stability of accumulated temperature is analyzed.The quadratic function of the mean temperature to the linear model (or simply as LM) is revised (which is called TRM after revision) and analyzed and compared with the nonlinear model.In order to analyze the applicability of different northeast spring maize varieties in the application of NLM, three other varieties with more observable years and stations are selected, “Dongnong 248”, “Longdan 13” and “Danyu 13”.Biological significance of parameters and the relationship between parameters and varieties or mature period are analyzed.In addition, the NLM has been improved effectively and verified.
The results show that the stability of accumulated temperature is related to the parameterP, more stable with the smallerP.Accumulated temperature calculated by the nonlinear model of Shen Guoquan shows interannual and inter-regional differences.The main reason for the instability is different temperature strength and its less correlation with other meteorological factors.For each growth period, the fi tted curves between the accumulated temperature and mean temperature are quadratic.The fitting curves of the accumulated temperature calculated by the revised linear model is better than that of Shen Guoquan nonlinear model.Therefore, the revised linear model considering the mean temperature for spring maize in Northeast China is feasible.There are no invalid parameters in the fi tting equations of the four maize varieties.The parameterPis determined as 0.5 based on the smallest variation coefficient of accumulated temperature.There is a significant correlation between parameterKand parameterQ, indicating that the parameterKmay be only a statistical parameter with no clear biological significance.There is a significant difference of accumulated temperature among varieties.The relationship between the parameterQand the mean value of effective accumulated temperature or active accumulated temperature during the whole growth period is found to be statistically significant, indicating thatQis related to the mature period types of different maize varieties because different accumulated temperature means different mature period types.Therefore, a general model applicable to different varieties is proposed whose parameterQandKare represented by effective accumulated temperature or active accumulated temperature.Our findings give good application results and have important implications for revising agro-meteorological indices and improving agriculture service capacity.(Guo Jianping)
1.12 Analysis of drought monitoring ability of different remote sensing drought indices in the whole growth period of Maize
Many indices based on MODIS data have been used to monitor the process of agricultural drought.In this study, one whole growth period of spring maize using MODIS-based drought indices were tested in Songliao Plain, China, in 2014 when a typical serious drought process happened.The main purpose is to examine the applicability of these indices.The correlation coefficients between each index (ATI, VCIndvi, VCIevi, NDWI,VSWI, TVDI) and the soil moisture data were calculated to show the ability of each index in retrieving the drought condition of spring maize in the study area.The results showed that (1) in each part of the growth,each index has its own applicability and characteristics; (2) ATI is more sensitive for the bare soil monitoring,TVDI is more robust and practicable to monitor drought in the semi-arid region (Fig.2).(Fang Shibo)
1.13 Extraction method and accuracy evaluation of rice planting area in multi cloudy area by radar remote sensing
Optical remote sensing is difficult to get remote sensing data in the crops growing season of southern China where there are much more cloudy days, which restricts the application of optical remote sensing to the extraction of crop planting area and distribution.Synthetic aperture radar (SAR) can penetrate clouds and is an effective way to extract landuse information from cloudy area.However, it is necessary to further study how to use the time series of SAR data to get crop distribution and what precision of the classification.Based on time series of SAR images from transplantation to harvest in the whole growth period, the distribution area of early rice was obtained in Nanchang County, Jiangxi in 2016.After field investigation with GPS positioning, the confusion matrix analysis was done.It was concluded that the Kappa coefficient of VV was 0.79 under the VV polarization.The accuracy of the user mapping for early rice distribution is 92.42% (Fig.3).(Fang Shibo)
2 Response and adaptation of agriculture to climate change
2.1 Multi-model ensemble for simulation of the impact of climate change on maize yield
To estimate uncertainties in the study of the impacts of climate change on crop yield, we used 8 climate projections by GCMs under RCP4.5 in the CMIP5 (which represented the uncertainties in the projected climate change) and a statistical and process-based crop model (which represented the uncertainties in the different structures or different formulations of physiological processes of crop models).Historical data of crop and meteorological data during 1981–2009 from agro-meteorological stations of China Meteorological Administration in Hailun, Changling and Benxi in Northeast China were used to establish and evaluate statistical and process-based APSIM models, respectively.Then the two crop models were linked with 8 climate projections to evaluate the impact of climate change on maize yield during 2010–2039 and 2040–2069,using 1976–2005 as the baseline period.In total, 2 crop models under 8 climate projections for a period of 30 years (a total of 480 simulations) were generated for both the baseline and two future climate periods.The results showed that the APSIM model well simulated the growth and yield of maize.The root mean square error (RMSE) for the growth progress (flowering and maturity) simulation was 3–4 days and that for the yield simulation was 0.6–0.8 t hm–2.The established statistical model suggested that temperature during emergence(mid May) had a positive effect on maize yield.However, the increase of temperature and rainfall, and lack of solar radiation during flowering and grain-filling periods (mid July to early September) had a negative impact on maize yield.Compared with 1976–2005, the resulting probability distributions indicated that due to climate change, maize yield in 2010–2039 could decrease on average by 3.8% (Hailun) –7.4% (Benxi), at a probability of 64% (Changling) –73% (Benxi).During 2040–2069, maize yield could decrease by 6.4% (Hailun) –10.5%(Benxi), at a probability of 74% (Hailun) –83% (Benxi).The simulated yield decrease by the APSIM model was 6.6% (Hailun) –8.9% (Benxi) during 2010–2039 and 9.7% (Hailun) –13.7% (Benxi) during 2040–2069.These were higher relative to those simulated by the statistical model, which were 0.9% (Hailun) –6.0% (Benxi)during 2010–2039 and then 2.0% (Changling) –7.3% (Benxi) during 2040–2069.(Zhang Yi)
2.2 The possible influence of future climate change on the growth period and yield of wheat in China
The possible effects of future climate change on the growth period and yield of wheat in China were discussed by using the Chinese agrometeorological (wheat) model (CAMM).The results showed that the influence of future climate change on the growth period of Chinese wheat is not obvious, but the variety improvement is the more important factor.The reason is that with the adjustment of the sowing date and changes of turn green date, the temperature of the whole growth period of wheat did not change obviously.The prolongation of the growth period does not necessarily lead to the increase of yield of wheat, which may be due to the weak growth in the reproductive period caused by the flourishing growth in the vegetative period.However, due to the lack of reliable climate prediction and the discrepancy of the model itself, the results of the assessment still have greater uncertainty (Fig.4).(Ma Yuping)
2.3 Response of spring maize to climate change in Inner Mongolia based on APSIM model
Based on the spring maize field trial data from Tumotezuoqi Agro-Meteorological Experiment Station in Inner Mongolia and daily meteorological data, the adaptability of agricultural production system model APSIM in maize producing areas of Inner Mongolia was analyzed.The key environmental factors impacting the development stage of spring maize were determined.Response of spring maize development stage to environmental factors was explored.The results implied three main conclusions.First, the validated APSIM model had better adaptability in Tumetezuoqi, Inner Mongolia.Second, the response of different developmental stages to the environmental impact factor was different.The first factor affecting the DOY (day of the year) of flowering and maturity at the same time was temperature, followed by relative humidity, potential evapotranspiration, and wind speed.Moreover, the DOY of maturity had significant positive correlation with total precipitation in spring maize growth period.The DOY of flowering was the most sensitive to the average minimum temperature variations.However, the DOY of maturity was the most sensitive to the average maximum temperature variations, followed by the average temperature, soil surface average temperature,and average minimum temperature.Finally, a statistical model reflecting the relationship between critical development stage of spring maize and environmental factors was established.These results can provide technical support for analyzing the limiting factors of spring maize growth and yield formation in the future maize-producing areas in Inner Mongolia.(Zhao Junfang)
2.4 Impacts of adaptive measures to climate change on maize climatic potential productivity in Northeast China
In order to adapt to future climate change, this study adopted two measures of stress resistant varieties and delayed sowing date, combined with the daily meteorological data of RCP4.5 scenario and RCP8.5 scenario from 2010 to 2099 simulated by a regional climate model, to analyze the maize climatic potential productivity changes in Northeast China under different climate change scenarios.The results showed that in 2010–2099, the spatial characteristics of maize climatic potential productivity in Northeast China decreased from southeast to northwest.The maize climatic potential productivity under RCP4.5 scenario was higher than that under RCP8.5 scenario, while years with the lowest values in RCP8.5 scenario was more than that in RCP4.5 scenario.Maize climatic potential productivity for stress resistant varieties was higher compared with the original varieties.Under RCP4.5 scenario, the variety with heat resistant had higher productivity, but under RCP8.5 scenario, the variety with drought resistant performed better.The variety with both heat and drought resistant achieved the highest productivity under both RCP4.5 scenario and RCP8.5 scenario.Under RCP4.5 scenario, yield increased with postponed sowing and 30–40 days delay achieved the highest yield.Under RCP8.5 scenario, the yield reduction occurred in some areas.The results thus imply that the appropriate delay in sowing is conducive to improving the maize productivity but varying with regions.(Guo Jianping)
2.5 Trend analysis of temperature conditions over different growth periods of winter wheat in North China Plain
The changes of monthly averaged temperature and the changing trends of the dates of critical developmental stages and averaged temperatures during the growing periods of winter wheat in North China Plain were analyzed based on the meteorological and phonological data collected from agrometeorological observational stations from 1981 to 2010 and warming experiments in the region.The results showed that there was a significant warming trend in October, December and between February and June during the growing season in the plain.Furthermore, the average temperature in February exhibited the maximum linear trend of temperature increase.Climate warming significantly increased the average temperatures over overwintering and the period from reviving to jointing stage of winter wheat.At the same time, the warming caused the jointing to maturity dates of winter wheat significantly advanced.However, the average temperatures over two periods did not show the same increasing trend as the corresponding monthly averaged temperatures.The temperature condition over the period before winter was stable because of the delayed sowing, an insignificant change in the average temperature during the period from jointing to maturity was attributed to the advance of developmental stages and local climatic characteristics of seasonal variation.(Tan Kaiyan)
2.6 Assessment on adaptation and risk of agriculture to climate change in Gansu Province
The temporal and spatial evolution of climate change, agricultural climate resources, agricultural meteorological disaster, agricultural cultivation system, crop yield loss from agricultural meteorological disasters and agrometeorological disaster risk in Gansu Province were systematically evaluated, and the countermeasures of agricultural adaptation to climate change were put forward, in order to promote the healthy and sustainable development of agriculture and to alleviate accurately the poverty.The main results were given as follows.
(1) Climate change.Since 1961, the average temperature, average maximum temperature, and average minimum temperature in Gansu Province had been rising.The highest rising was the average maximum temperature, and the lowest was the average temperature.The temperature increased obviously in all seasons.Among the seasons, the temperature rising was the highest in winter and the lowest in summer.Both average annual precipitation and average annual sunshine hours showed no significant trend.
(2) Trends in extreme climate events.Since 1961, the extreme maximum temperature showed increasing trend in Gansu Province except in the western part of Qilian.The day number of the daily maximum temperature over 35 °C showed a rising trend except in the Qilian mountains and the northern part of Gannan plateau, with the increasing rate being about 0.3 d/10a.The annual extreme minimum temperature showed an increasing trend except in the northwestern part of Jiuquan city, and the most obvious warming happened in Gannan plateau.The longest continuous days without rainfall also showed an increasing trend in the centraleastern part of Hexi, the central and northern parts and the southwestern part of Longzhong, the eastern part of Longzhong and the central part of southern Gansu.
(3) Trend of agricultural climate resources.Since 1961, the beginning dates with average daily temperatures of more than 0 °C and 10 °C showed an advance trend to some degree, and the ending dates showed different degrees of delay trend.The precipitation with average daily temperature of more than 0 °C and 10 °C showed a decreasing trend from the southeast to the west.The precipitation showed an increasing trend in most part of Hexi and a decreasing trend in most part of Hedong.The accumulated temperature showed an obvious increasing trend.The sunshine hours with average daily temperature of more than 0 °C showed an increasing trend in most part of Gansu Province, and the sunshine hours with average daily temperature of more than 10 °C did not show obvious change.
(4) Effects of changes in agricultural climate resources on crop yield.During 1980–2014, the increasing average temperature of winter wheat region resulted in the decrease of yield by 7.5%; the increasing daily range of temperature resulted in the decrease of yield by 6.7%; the decreasing average precipitation resulted in the decrease of yield by 0.4%.In the region of spring wheat, the increasing average temperature resulted in the decrease of yield by 4.3%; the decreasing daily range of temperature resulted in the increase of yield by 0.7%; the increasing average precipitation resulted in the increase of yield by 0.1%.In the region of maize,the increasing average temperature resulted in the decrease of yield by 1.2%; the increasing daily range of temperature resulted in the decrease of yield by 1.2%; the decreasing average precipitation resulted in the decrease of yield by 0.2%.During 1985–2014, the increasing average temperature in the potato region resulted in the decrease of yield by 1.8%; the decreasing daily range of temperature resulted in the increase of yield by 0.3%; the decreasing average precipitation resulted in the decrease of yield by 0.3%.
(5) Trend of agricultural meteorological disasters.Since 1961, the occurrence frequency and intensity of meteorological drought in Gansu Province showed an obvious increasing trend.The area of spring and summer drought showed an obvious increasing trend, while the area of drought occurred in late spring and early summer and autumn showed an obvious decreasing trend.The number of days (stations) with gale showed a decreasing trend but showed an increasing trend after 2007.The number of days with heavy rain showed no significant trend, mainly in the region of Hedong.The number of frost days increased first and then decreased,particularly significant after 1980s.The day number of the first frost became the minimum value since 2005.
(6) Temporal and spatial evolution of agricultural meteorological disasters.Since 1961, the area and harm of the agricultural drought disaster increased significantly.The rates of drought disaster, drought hazard and total crop failure (25.2%, 14.1% and 2.2%) were significantly higher than the national average (15.0%, 8.1%and 1.7%), their increase rates (0.16%/10a,, 0.15%/10a, and 0.05%/10a,) were also higher than the national average.The comprehensive loss rates of hail disaster, flood disaster and chilling injury also increased with the increase rate of 0.29%/10a,, 0.45%/10a, and 0.72%/10a,.
(7) Trends and impacts of agricultural pests and diseases.During 1981–2015, climate change was conducive to the expansion of agricultural pests and diseases in Gansu Province, increasing the negative effects.The occurrence areas of agricultural diseases, pests, weeds and rat damage increased at rates of 0.20/10a,0.08/10a, 0.06/10a, –0.03/10a, respectively.The occurrence area rates of agricultural diseases, pests and rat damages were mainly affected by temperature, and the occurrence area rate of weed was mainly affected by the number of days of precipitation.The loss rate of both yield per unit and total production from agricultural pests and diseases ranged as potato > maize > wheat.The diseases harmed more loss for potato and wheat than the pests, while the pests caused more loss for maize than the diseases.Therefore, more attention should be paid to the pests and diseases of potato and maize, especially the diseases of potato and the pests of maize in the future, and the diseases of wheat should also draw more attention in the future.These effects from pests and diseases should be taken as the focus of prevention and control.
(8) Trend and effects of the agricultural planting system.Compared with 1951–1980, the planting boundary of two crops one year moved northward in different degrees.The regions with obvious changes included Longnan, Longdong and Gannan plateau.The northern boundary of winter wheat expanded westward in different degrees, and the regions with obvious changes included Hexi and Gannan plateau.The change from one crop one year cultivation pattern of winter wheat, spring wheat, maize, potato to two crops one year of winter wheat-summer maize could make the yield increase.The increasing yield rate reached about 153.53%,65.13%, 149.69% for winter wheat, spring wheat and potato in Longnan and 84.56%, 91.27%, 76.42%,83.02% for winter wheat, spring wheat, maize, potato in Longzhong.
(9) Countermeasures of agricultural adaptation to climate change.In the light of the new characteristics of agricultural climate resources and new situation of agrometeorological disasters in Gansu Province under the background of climate change, this study presented a series of new patterns of climate resource efficient utilization, in order to effectively alleviate the adverse effects of climate change on agricultural production,to promote the level of agricultural production and alleviate effectively poverty in Gansu Province as soon as possible.The countermeasures mainly included: the optimization of land use pattern, making full use of solar radiation and heat resources; adjustment of crop cultivation system, taking the initiative to adapt to climate change; breeding crop cultivars with high yield, good quality and strong resistance, coping scientifically with climate warming and pests and diseases; adjusting the multiple cropping index, improving the utilization efficiency of cultivated land resources; adjustment of crop planting area and species distribution, making full use of water and heat resources; emphasizing regional differentiation of climate change, scientific adjustment in production management.(Zhou Guangsheng)
3 Ecometeorological monitoring
3.1 Developing drought index and threshold of typical steppe
In response to the global climate change, marked by elevated CO2concentration and temperature, the frequency of extreme weather events, such as drought has been increasing, and the influences on plants have appeared and will continue into the foreseeable future.The research on the process of plant response to drought is helpful in monitoring the plant drought occurrence and development and evaluating the plant drought conditions.Based on the field manipulation experiments of typical grassland plants, this study quantitatively analyzed the sensitivity indicators in the process of plant response to drought, critical threshold, plasticity and correlation, and photosynthetic eco-physiology mechanism, and investigated the change in drought indicators and their thresholds under elevated CO2conditions.The results are as follows:
(1) Photosynthetic rate (Pn) and leaf water content ofLeymus chinensisandStipa kryloviiwere firstly affected by drought stress, and the relative humidity threshold was between 51% –54%.The single leaf area ofL.chinensiswas earlier subjected to drought stress than the leaf number.S.kryloviijust showed the opposite situation.
(2) Drought plasticity of total leaf area.ForL.chinensisandS.kryloviiwas greatest in the morphological characteristics.The plasticity of plant height ofL.chinensiswas greater than that of leaf number,S.kryloviishowed an opposite result.ForL.chinensis, the correlation of total leaf area, plant height, leaf number,and biomass with drought had little difference; but leaf number had the maximum correlation with drought among those 4 indicators inS.krylovii.In the physiological characteristics of leaves, the correlation between transpiration rate (Tr) ofL.chinensisand drought was the highest; the correlation between vapor pressure deficit (VPD) ofS.kryloviiand drought was the highest.
(3) Under drought stress conditions, the vapor pressure deficit (VPD) increased, the leaf stomata closed and resistance increased, the stomatal conductance (Gs) decreased, then the transpiration (Tr) decreased,the water loss rate was reduced, the net photosynthetic rate (Pn) decreased mainly by stomatal limitation in this stage.However, as the drought continued, the chlorophyll content decreased, the intercellular CO2concentration (Ci) andCi/Ca(atmospheric CO2concentration) increased, the increase of non-stomatal limitation was the leading factor.
(4) After re-watering,Pnand leaf water content ofL.chinensisandS.krylovii, and chlorophyll content ofL.chinensiscould quickly recover to the level of sufficient water supply, the effect of drought was reversible.The total leaf area and single leaf area ofL.chinensisandS.kryloviiincreased gradually after re-watering,still significantly lower than at the sufficient water supply.The change degrees ofPn,Gs, VPD andTrofL.chinensiswere larger than those ofS.kryloviiandPn, and the change degrees of leaf water content ofL.chinensisaffected by drought were earlier than inS.krylovii.The drought threshold (soil relative moisture) ofL.chinensiswas higher than that ofS.krylovii.After re-watering, the recovery degree ofPnand above ground biomass ofL.chinensiswere greater than that ofS.krylovii, all these results indicated that the sensitivity ofL.chinensisto drought and re-watering was greater than that ofS.krylovii.
(5) Total leaf area or leaf number (morphology), leaf water potential or leaf water content (physiology),and above ground biomass better reflected the water status ofS.bungeanaunder ambient and elevated CO2than the 13 other analyzed variables.The sensitivity of drought indicators changed under the elevated CO2condition.By quantifying the relationship between precipitation and the 5 most sensitivity indicators, we found that the thresholds of precipitation decreased under elevated CO2concentration.(Zhou Guangsheng)
3.2 Revealing the spatiotemporal dynamics of carbon sequestration and its driving mechanism in China’s grasslands
China’s grasslands constitute approximately more than 40% of the national land area, they’re climatesensitive and ecologically fragile area, and severely affected by human activities.Accurately assessing the spatiotemporal dynamics of carbon sequestration and the corresponding driving mechanism in China’s grasslands is one of the hot topics in the study on global change and carbon budget.In this study, we used the field observational data from 2011 to 2013 and relevant literatures with the process-based ecosystem model(Terrestrial Ecosystem Model, TEM 5.0) to examine the spatiotemporal dynamics of carbon sequestration of China’s grasslands during 1961 to 2013.We first parameterized TEM 5.0 with observational data for China’s grasslands.Second, we validated the model and extrapolated parameterization to the whole study region.We then analyzed the temporal and spatial variations of carbon sequestration and its driving mechanism.At last, we estimated the carbon sequestration potential under the current and future climate scenarios.The main conclusions are listed as follows:
(1) During 1961 to 2013, the China’s grasslands acted as a carbon sink, with annual mean value of 19.06 Tg C a–1.The Inner Mongila grasslands (5.77 Tg a–1), Xinjiang grasslands (5.44 Tg a–1) and Tibetan Plateau grasslands (5.16 Tg a–1) contributed most (85.9%) to the sink.Significant interannual variability trend of the net ecosystem productivity (NEP) was mainly attributed to different sensitivities of net primary productivity (NPP)and heterotrophic respiration (RH) to annual temperature variability.The gross NEP of each decadal acted as a carbon sink.The early stage of 21st century contributed most to the sink at 66.33 Tg C a–1, which accounted for 57.6% of the gross NEP in five decades.The vegetation carbon and soil organic carbon of the study region showed an increasing tendency during the study period.
(2) Annual NEP of China’s grasslands was 4.84 g C m–2a–1, and acted as a carbon sink in the whole region.The major carbon sink occurred in western Tibetan Plateau, northeastern Inner Mongolia, and northern Xinjiang.The southeastern, northeastern, and western boundaries of Tibetan Plateau acted as carbon sources.The carbon source area accounted for only 13.5% of the total study area.During the study period, most of the study region showed an increasing tendency of NEP, with 82.5% of China’s grassland, and distributed mainly in the grasslands of northwestern Tibetan Plateau, northern Xinjiang, and northeastern Inner Mongolia.The decreasing tendency of NEP occurred in northwestern Inner Mongolia, southwestern and northeastern Tibetan Plateau, and southern grasslands, which accounted for 17.5% of the total study region.
(3) The mean annual temperature showed a significantly increasing trend during 1961 to 2013.Annual precipitation varied among years and decreased from southeast to northwest in the spatial pattern, with the decadal trend of dry–wet–dry.The annual net ecosystem productivity showed a positive correlation with temperature and precipitation, but it showed no significant correlation with solar radiation.Annual variations of temperature and precipitation were main driving forces of carbon sequestration in China’s grasslands.
(4) The mean annual carbon sequestration potential was 18.41 Pg C a–1during 1961 to 2013.Among them,there were 18.12 Pg C a–1in soil and 0.29 Pg C a–1in vegetation.The spatial distribution patterns of carbon sequestration potential per unit area in different ages were roughly the same, the grasslands in the Qinghai-Tibetan Plateau and the Junggar basin, Xinjiang had the larger carbon sequestration potential, with mean annual carbon sequestration values generally above than 10000 g C m–2a–1; the southern China grasslands had mean annual carbon sequestration between 1000~5000 g C m–2a–1.
(5) Under RCP4.5 and RCP8.5 climate scenarios, without the influence of human disturbance, the results indicated that the total carbon storage showed an increasing trend, with the average annual growth rate of 61.0 Tg C m–2a–1(RCP4.5) and 234.2 Tg C m–2a–1(RCP8.5).The spatial pattern of carbon density under the two climate scenarios was consistent, showing an increasing trend in carbon density during 2011 to 2040, with significant increase in the Qinghai-Tibetan Plateau and Inner Mongolia grasslands.
(6) Under RCP4.5 climate scenario, the mean annual carbon sequestration potential was 18.01 Pg C a–1during 2011 to 2040, with 17.78 Pg C a–1in soil and 0.24 Pg C a–1in vegetation.Under RCP8.5 climate scenario, the mean annual carbon sequestration potential was 18.00 Pg C a–1from 2011 to 2040, with 17.79 Pg C a–1in soil and 0.20 Pg C a–1in vegetation.The spatial distribution of carbon sequestration potential in China’s grasslands was similar in the two climate scenarios.In 2030s, the carbon sequestration potential in Junggar basin, Xinjiang was the largest, followed by the central (Tianshan Mountain) and southern (Kunlun Mountain)part in Xinjiang, the part of Inner Mongolia grasslands, as well as the southern, central and southeastern parts of Qinghai-Tibetan Plateau grasslands.The carbon sequestration potential in the remaining grasslands was small, generally less than 5000 g C m–2a–1, close to zero in some places.(Zhou Guangsheng)
4 Application of results
4.1 Applicability of PyWOFOST based on EnKF in simulating maize yields
A modified and improved crop model (PyWOFOST), which coupled remote sensing information and a crop model (WOFOST) with Ensemble Kalman Filter (EnKF), was evaluated to simulate maize yields in Northeast China.The work has been adopted by the Agricultural Information Institute of CAAS for assessing regional yield risk services at the end of 2017.(ZhaoYanxia)