Relationship between Metabolites Variation and Paulownia Witches’ Broom
2017-07-18CaoYabingZhaiXiaoqiaoDengMinjieZhaoZhenliFanGuoqiang
Cao Yabing Zhai Xiaoqiao Deng Minjie Zhao Zhenli Fan Guoqiang
(1.Institute of Paulownia, Henan Agricultural University Zhengzhou 450002; 2.Forestry Academy of Henan Zhengzhou 450008)
Relationship between Metabolites Variation and Paulownia Witches’ Broom
Cao Yabing1Zhai Xiaoqiao2Deng Minjie1Zhao Zhenli1Fan Guoqiang1
(1.InstituteofPaulownia,HenanAgriculturalUniversityZhengzhou450002; 2.ForestryAcademyofHenanZhengzhou450008)
【Objective】 Paulownia witches’ broom caused by phytoplasma can lead to severe damage to the survival and wood production of Paulownia trees, which can result in a significant economic loss. This study aims to explore the relationship between metabolites variation and Paulownia witches’ broom using metabolomic analysis.【Method】 High performance liquid chromatography-mass spectrometry (HPLC-MS) were used to analyze variation in the metabolite of healthy and phytoplasma-infectedPaulowniatomentosaseedlings, differentially expressed m/z peaks were selected using principal component analysis and partial least squares-discriiminate analysis, then the differentially expressed m/z peaks detected by MS were mapped to KEGG metabolites database to find the changes of metabolite content and species in response to phytoplasma infection. 【Result】 The result showed that 1 612 metabolites were differentially expressed, among which 765 metabolites have a decreased concentration in phytoplasma-infected seedlings compared to healthy seedlings, and 847 metabolites are on the contrary. KEGG pathway analysis showed that 460 differentially expressed metabolites were mapped to 111 KEGG pathways. The most significantly represent category among the assigned pathways was “isoquinoline alkaloid biosynthesis”, followed by “diterpenoid biosynthesis” and “flavonoid biosynthesis”. Metabolites which are involved in plant hormones signal transduction and flavonoid biosynthesis were identified to be related to plant’s response to phytoplasma infection. Among them, the concentrations of zeatin, zeatin riboside, gibberellin, dihydrozeatin riboside, pelargonidin, apigenin and cyanidin changed significantly in phytoplasma-infected seedlings compared with the healthy ones, suggesting that variations in concentrations of these metabolites might be related to PaWB. 【Conclusion】 Variation in metabolite concentrations among the healthy and phytoplasma-infected seedlings can help reveal the candidate metabolites and inherent pathways that are potentially involved in PaWB. This study will provide new insight into the role of metabolites in Paulownia and other trees in response to phytoplasma infection.
Paulowniatomentosa; metabolomics; witches’ broom; plant hormones; anthocyanin
Paulowniatomentosais a fast-growing, adaptable, country-yard, greening trees that native to China, where it has been cultivated for more than 2 000 years for its rot resistance, dimensional stability, desert control, high ignition point, and straight-grained timber, which made them widely used in house construction, papermaking, high-grade furniture, and handicrafts production (Baylissetal., 2005; Bassett, 1998). To date, Paulownia trees have been introduced into many other countries (Ipekcietal., 2003; Atesetal., 2008). Paulownia witches’ broom (PaWB), caused by phytoplasma, is a devastating disease of Paulownia trees that can result in significant economic losses in Paulownia plantation regions. Infected Paulownia trees are characterized by witches’ brooms, short internodes, yellowing or reddening of leaves, phyllody, stunting and decline, virescence, sterile flowers and necrosis, and altered volatile production(Namba, 2002). In the past 40 years, researches on PaWB were mainly focused on the ecological and biological characteristics, the route of pathogen transmission, and the prevention of insect vectors during the phytoplasma infection (Jinetal., 1981; Caoetal., 2012; Fanetal., 2007). Recently, studies at the molecular level were also carried out, including transcriptom,miRNA, degradome and DNA methylation, which revealed some key genes and miRNAs that related to PaWB (Liuetal., 2013; Mouetal., 2013; Fanetal., 2014; Caoetal., 2014a; 2014b; Niuetal., 2016). However, the molecular mechanisms associated with the tree’s response to phytoplasma infection are still largely unknown. As we know, metabolites are the end products of gene expression, to some extent, which may be more accurate than genes in response to interactions between plants and pathogens (Wardetal., 2007). Therefore, it is necessary to carried out metabonomics research to investigate changes of metabolites in Paulownia with phytoplasma.
Metabonomics is a term that used to describe qualitative and quantitative analysis of the small molecule metabolites (relative molecular weight < 1 000 dalton) in organism, cell, or tissue, The term is used widely in system biology(Allwoodetal., 2008; Wilsonetal., 2005). Metabonomic analysis can help reveal the complex interaction of metabolic compositions and play important roles in biotic and abiotic stress, which usually represented by abnormal changes in metabolites in tissues (Wardetal., 2014). Metabolites related to salt stress and phytoplasma infection inSynechocystissp. and grapevine have been reported using metabonomics analysis (Gaietal., 2014; Wangetal., 2014). In recent years, a series of secondary metabolites in different organs ofP.tomentosahave been isolated and identified(Schneiderováetal., 2015). But there have few reports on metabonomic changes inP.tomentosawith PaWB until now. Here, we aimed to detect metabolite changes with PaWB and to identify metabolites that showed differential expression between the healthy and the phytoplasma-infectedP.tomentosaseedlings. To our knowledge, this is the first report on metabolite variations inP.tomentosawith witches’ broom. This result provides a comprehensive foundation for us to understand the mechanism of PaWB.
1 Materials and methods
1.1 Plant material
Tissue-cultured seedlings ofP.tomentosawere obtained from the Forest Biotechnology Laboratory of Henan Agricultural University, Zhengzhou, Henan Province, China. After all the seedlings were cultured in 100 mL triangular flasks on 1/2 Murashige and Skoog (MS) medium which did not contain any phytohormone for 30 days, the uniformly grown terminal buds from the healthy seedlings (HS) and phytoplasma-infected seedlings (PIS) were transferred into 100 mL triangular flasks containing 1/2 MS culture medium supplemented with 25 mg·L-1sucrose and 8 mg·L-1agar (Sangon, Shanghai, China), and cultured under the same conditions with air temperature maintained at 25 ± 2 ℃ and 130 μmol·m-2s-1intensity light (with 16/8 h light/dark photoperiod). After 30 days, terminal buds about 1.5 cm in length were collected from 60 healthy seedlings (or phytoplasma-infected seedlings), then frozen in liquid nitrogen and stored at -80 ℃ for later analysis.
1.2 Detection of PaWB phytoplasma inP.tomentosa
Total DNA was extracted from the terminal buds of HS and PIS, respectively, according to the method as described by Zhangetal., (2009). The DNAs were assessed with NanoDrop 2000 (Thermo Scientific, Wilmington, DE, USA). PaWB phytoplasma was detected by nested-PCR as described by Leeetal., (1993). The PCR procedure and agarose gel electrophoresis were performed according to the method as described by Fanetal., (2007).
1.3 Metabolite extraction and analysis by high performance liquid chromatography-mass spectrometry (HPLC-MS)
The HS and PIS terminal buds (50 mg) stored at -80 ℃ were ground in a mortal using liquid nitrogen, respectively, and then extracted with 1 mL of 50% methanol (pre-cooled at -20 ℃). Subsequently, the samples were vortexed for 30 s and precipitated for 20 min. Following centrifugation (10 000 r·min-1, 10 min, 4 ℃), 250 μL of supernatant was transferred into 1.5 mL polypropylene tubes, and 10 μL of the supernatant was injected into a HPLC-MS system. A ‘quality control’ (QC) sample was also prepared by mixing tissue powder, then following the metabolite extraction step as described above.
The analytical HPLC-MS data were evaluated using shimadzu HPLC system (shimadzu, Japan) coupled to a LTQ Orbitrap Velos instrument (Thermo Fisher Scientific, MA, USA) set at 70 000 resolutions, and samples analysis were carried out in the positive ion modes. The scanning range of the mass was 50-1 500 m/z. The flow rate of nitrogen sheath gas was set at 30 L·min-1and the nitrogen auxiliary gas at 10 L·min-1. Spray volage was set to 4.5 kV. The mobile phase consisted of solvent A (5%V/Vformic acid/water), and solvent B (100% acetonitrile). The flow rate was 0.2 mL·min-1and the injection volume was 10 μL. An Agilent Zorbax ODS C-18 column (Agilent Technologies, Santa Clara, CA, 150 mm×2.1 mm, 3.5 μm) was used for all analysis. The gradient that we used was similar to that used for the serum metabolomics analysis(Luanetal., 2013) with some modifications: 5% solvent B at 0-2 min, 7% B at 2-3 min, 8% B at 3-4 min, 70% B at 4-5 min, 90% B at 5-9 min, 95% B at 9-11 min, 95%-5% B at 11-14 min and 5% B at 14-15 min. To ensure the system balance, the pooled “QC” sample was injected five times at the beginning of the run, and then each 10 samples to further monitor the stability of the analysis (Wantetal., 2010).
1.4 Data analysis
Pretreatment of the data including peak picking, peak grouping, retention time correction and second peak grouping was obtained through the XCMS software implemented with the freely available R statistical language (v2.13.1). The initially mass spectrum data cannot be directly used in the analysis; therefore, the HPLC-MS raw data files were firstly converted into XML format and then directly processed by the XCMS toolbox (http://metlin.scripps.edu/xcms). A list of the ion intensities of each peak detected was generated using retention time and the m/z data pairs as identifiers for each ion. Finally, a three-dimensional matrix was obtained, which contained arbitrarily assigned peak indices, retention times-m/z pairs, and ion intensity information (variables).
External factors can affect the reliability of the subsequent analysis, therefore, to obtain consistent variables, we implemented a series of measures such as removing peaks with more than 80% missing values (those with ion intensity=0) and those geometric isomer, which further reduced the resulting matrix.To ensure data were of comparable high quality within an analytical run, a method based on the periodic analysis of “QC” sample together with the PIS and HS samples is used as a quality assurance strategy in our present study. Here each retained peak is normalized to the QC sample using robust Loess signal correction (R-LSC). A threshold of 30% was set for the relative standard deviation value of metabolites in the “QC”samples, which is accepted as a standard in the assessment of repeatability in metabolomics datasets. Finally, the filtered matrix was exported for multivariate statistical analysis using principal component analysis (PCA) and partial least-squares discriminant analysis (PLS-DA).
Each metabolite peak reproducibly detected in whole samples was measured using the univariate method Welch’stTest to estimate the significance of each metabolite among the two samples, with the results adjusted for multiple testing using false discovery rate (FDR) correction.On the bases of a variable importance in the projection (VIP) threshold of 1 from the 7-fold cross-validated PLS-DA model, a number of metabolite ions responsible for the difference in the metabolic profile scan of HS and PIS were obtained. The metabolite ions identified by the PLS-DA model were validated at a univariate level using the FDR test from the R statistical toolbox with the criticalPvalue set to <0.05. The corresponding fold changes (fold change >1.5, or < 0.67) show how these selected differentially expressed metabolites varied between the two groups (HS and PIS). Discriminatory metabolites of interest were extracted from the combining VIP value,Pvalue and fold change.
Exact molecular mass data from redundant m/z peaks were used for metabolite searches against the KEGG database. A metabolite name was reported when a match with a mass difference between observed and theoretical mass was <20×10-6. The isotopic distribution measurement was used to further validate the metabolite molecular formula of matched metabolites.
2 Results
2.1 Detection of PaWB phytoplasma in the Paulownia seedlings
The PIS were characterizedwith witches’ broom, yellow of leaves, short internodes and proliferation of axillary buds, while the HS don’t showed none of these morphological symptoms (Fig.1). Based on the PaWB phytoplasma genome, we used a nested-PCR to amplify its 16Sr DNA fragments. The specific 1.2 kb fragments of phytoplasma genome was detected only in the PIS (Fig.2), indicating that the two samples were satisfied for the metabolomic analysis.

Fig.1 Changes of morphology in Paulownia witches’ broom seedlings A: Phytoplasma-infected seedlings; B: Healthy seedlings.
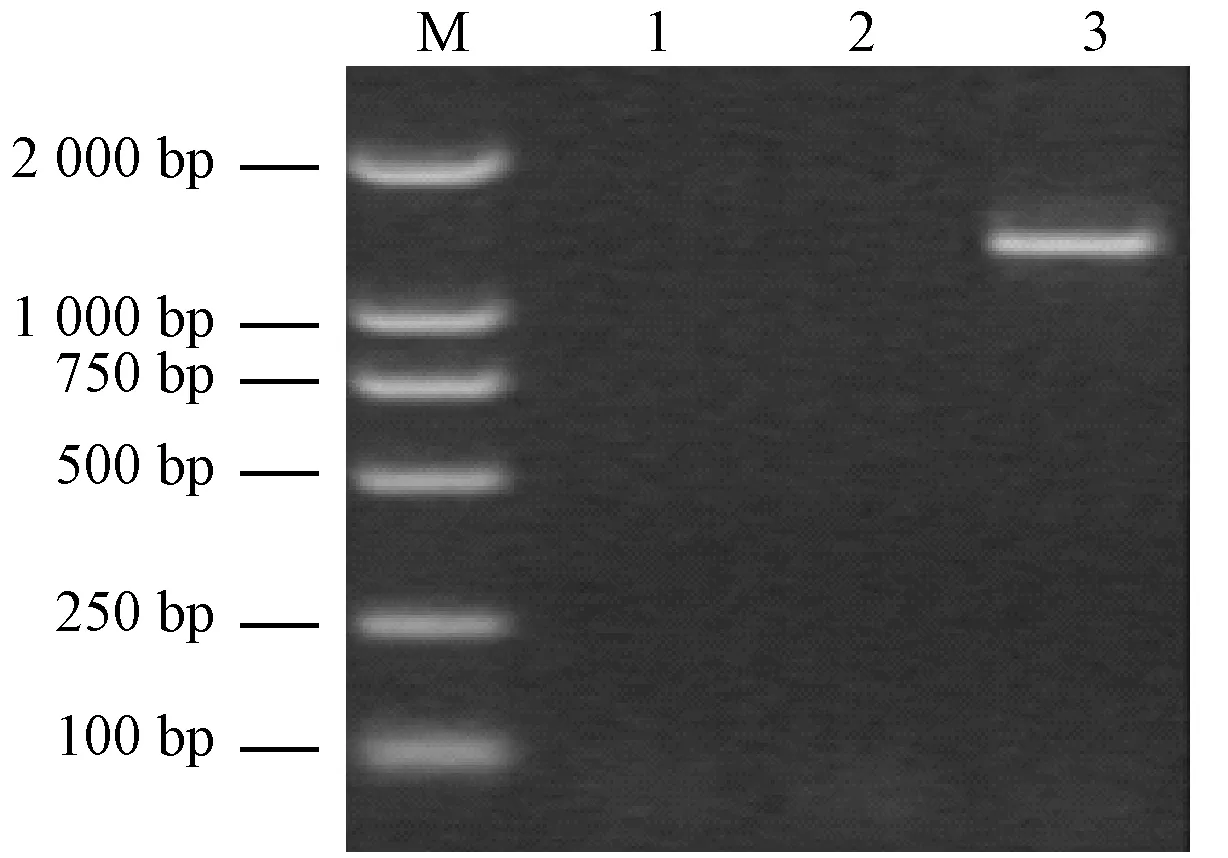
Fig.2 Detection of phytoplasma 16S rRNA in phytoplasma-infected seedlings M: Marker; 1: Healthy seedlings; 2: ddH2O; 3: Phytoplasma-infected seedlings.
2.2 Metabolic profile of the phytoplasma-infected and the healthy seedlings
After running the optimized HPLC-MS analysis protocol and subsequent data processes, 1 466 retention time-exact mass pairs remaining in each sample profile and analyzed under positive ion mode. PCA showed that no shift was observed in the space of data obtained from the ‘QC’ samples (Fig.3). This result implied that extracted and detected metabolites from the PIS and the HS with fairly consistent retention times and excellent resolution in the HPLC-MS analysis. All the variables were used in the following analysis. Significant differences in metabolic profile between the HS and PIS were also observed using a two components PCA score plot. Then, the cross-validated two-component PLS-DA demonstrated satisfactory modeling and achieved a distinct separation between metabolite profiles of the HS and PIS as shown in Fig.4. Fig.4 showed the PLS-DA score plot. From the corresponding loading plots and with the VIP≥1, 766 ions furthest away from the origin were found significantly contribute to the separation and, therefore, may be regarded as the differential m/z. At the same time, 1 271 metabolite m/z that displayed large-magnitude-changes were also detected by a volcano plot and a statistical test (P-value <0.05, fold change >1.5, or < 0.67). Of these peaks, 571 were ultimately selected as discriminating m/z through a combined analysis of their VIP values and volcano plot results. These metabolites may play important roles in phytoplasma infection.
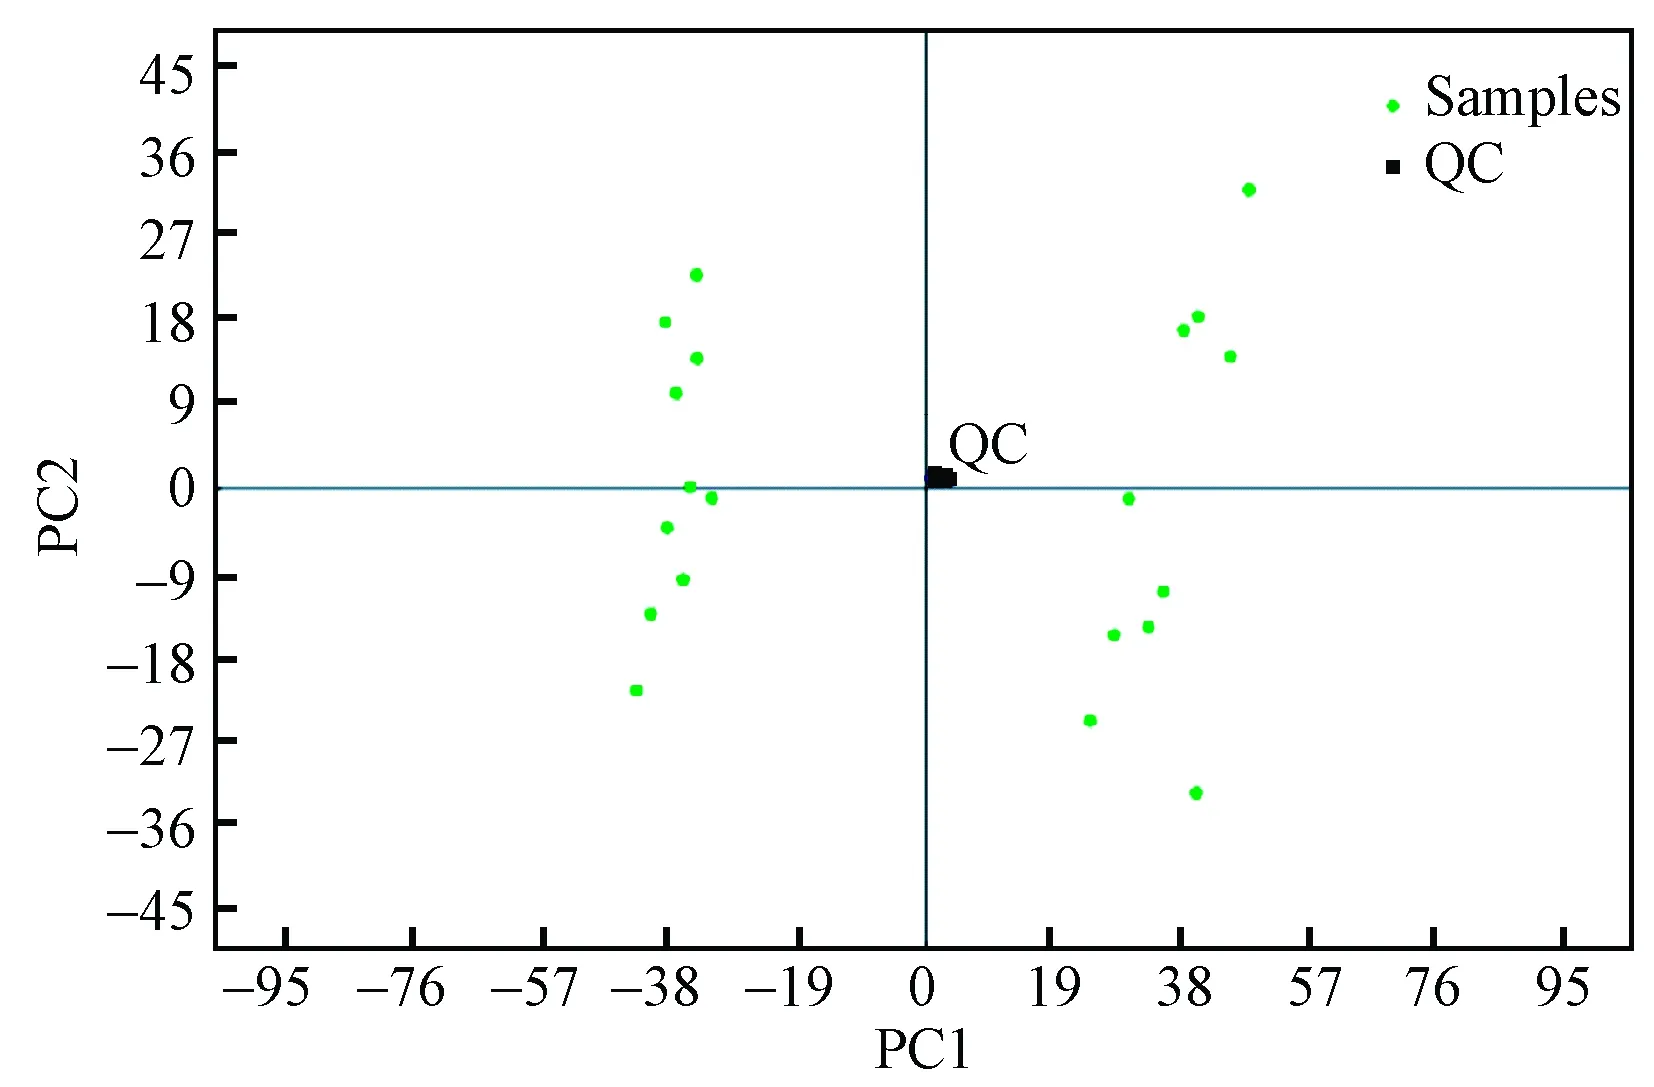
Fig.3 PCA plot for consecutively analyzed QC samples

Fig.4 Scores plot of the PLS-DA model for discriminating healthy seedlings from phytoplasma-infected seedlings Group1: Healthy seedlings; Group2: Phytoplasma-infected seedlings.
2.3 Metabolic pathway analysis of differentially expressed metabolites
To identify the possible metabolites related to phytoplasma infection,all the 571 differentially expressed peaks were first aligned to KEGG metabolites database with a mass difference between observed and theoretical mass < 20×10-6. A total of 373 peaks were
matched 1 612 known metabolites, while 198 did not match any known metabolites. To identify metabolites related to PaWB, the expression levels of the 1 612 differentially expressed metabolites in HS vs. PIS were investigated, among them, 208 only existed in HS, 98 only existed in PIS, and 1 306 existed in both of them(Fig.5). By further analysis of these 1 612 differentially expressed metabolites, 765 had decreased expression levels (fold-change <0.67) in PIS. Compared to HS, and 847 metabolites are on the contrary (fold-change >1.5). Based on the KEGG annotation, 460 differentially expressed metabolites were mapped to 111 KEGG pathways (Tab.1). The most significantly represent categories among the assigned pathways were “Isoquinoline alkaloid biosynthesis”(Ko00950, 35, 19 increased and 16 decreased), followed by “Diterpenoid biosynthesis”(Ko00904, 28, 8 increased and 20 decreased)” and “Flavonoid biosynthesis”(Ko00941, 21, 15 increased and 6 decreased).
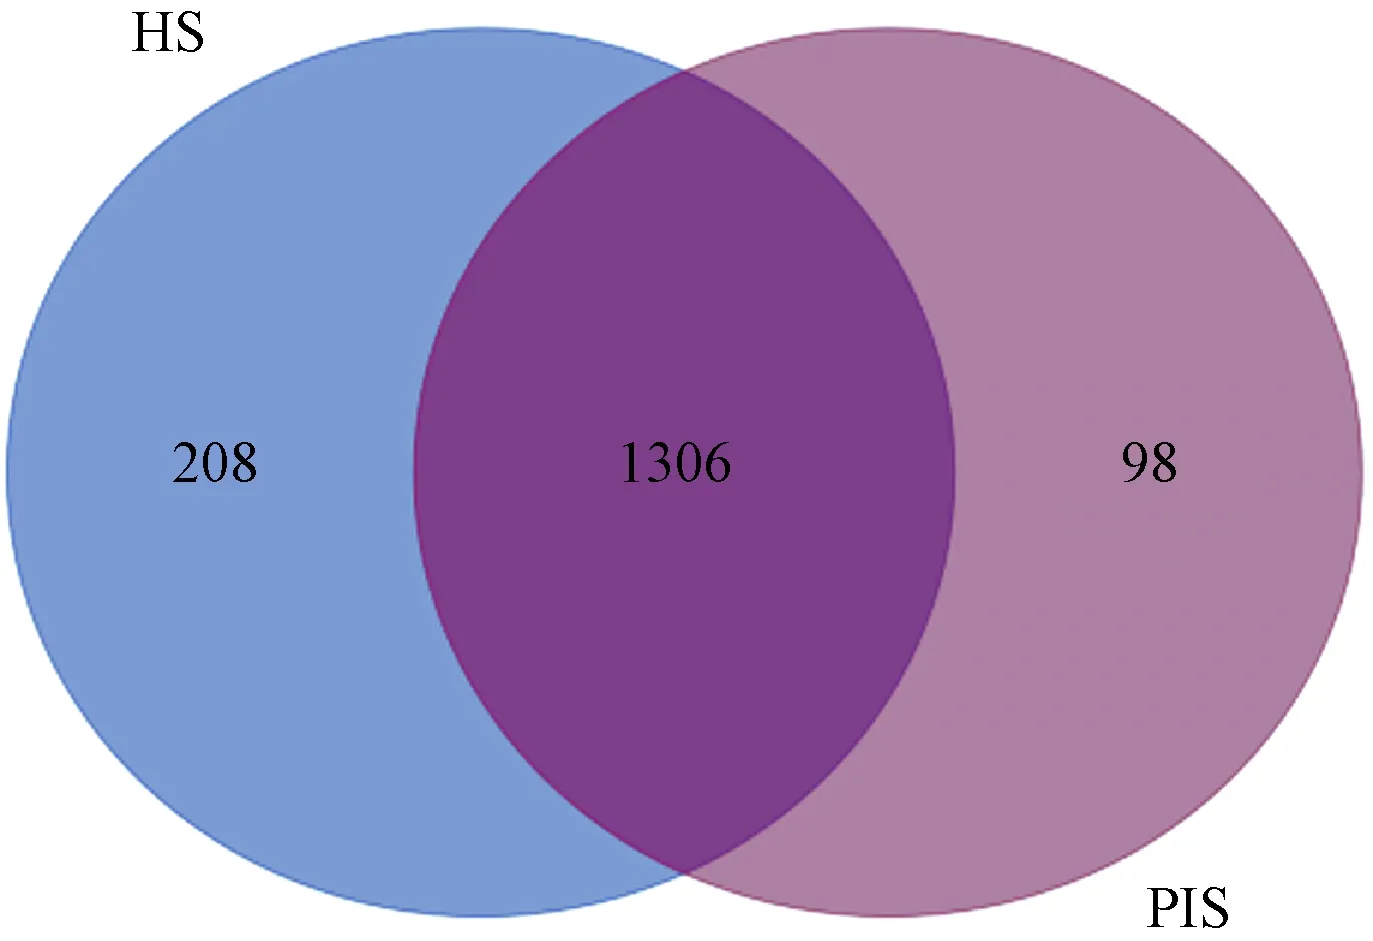
Fig.5 Venn plot for 1 612 differentially expressed metabolites HS: Healthy seedlings; PIS: Phytoplasma-infected seedlings.

PathwayCountPathwayIDIsoquinolinealkaloidbiosynthesis35ko00950Diterpenoidbiosynthesis28ko00904Flavonoidbiosynthesis21ko00941BiosynthesisoftypeIIpolyketideproducts21ko01057Polycyclicaromatichydrocarbondegradation19ko00624Carotenoidbiosynthesis19ko00906Drugmetabolism⁃cytochromeP45017ko00982Isoflavonoidbiosynthesis16ko00943Purinemetabolism14ko00230Glucosinolatebiosynthesis14ko00966
2.4 Candidate metabolites related to phytoplasma infection
When faced with phytoplasma invasion, the host plant activates a set of physiology and biochemistry response like changes inthe concentration or types of metabolites. In our study, some metabolites which cannot be detected as genes encode for them were inhibited in phytoplasma-infected seedlings, for instance, niguldipine and berbamunine; while some metabolites were on the contrary, such as cupreine and all-trans-hexaprenyl diphosphate; besides, there were others metabolite that present in both healthy and phytoplasma-infected seedlings, but showed significant difference, including phenylalanine, phyllanthin, clitidine 5′-phosphate, zeatin, anthocyanin and so on. To further validate the metabolites that closely related to PaWB, functional analysis of these metabolites were investigated, and some differentially expressed metabolites related to PaWB were found out as shown in Tab.2. Among them, the most significant one was gibberellin, followed by zeatin riboside, cyanidin, apigenin and pelargonidin. KEGG pathway analysis showed that these differentially expressed metabolites were mainly involved in zeatin biosynthesis, flavonoid biosynthesis, and plant hormone signal transduction, indicating that phytoplasma infection activated the defense reaction, including the burst of active oxygen and callose deposition, and disturbed the plant metabolic process, triggering the hormonal imbalances in Paulownia. All these effects in turn enhanced the concentration of antioxidant and phytohormones, which possibly suppress the defense systems and promote the formation of the typical symptoms in Paulownia.
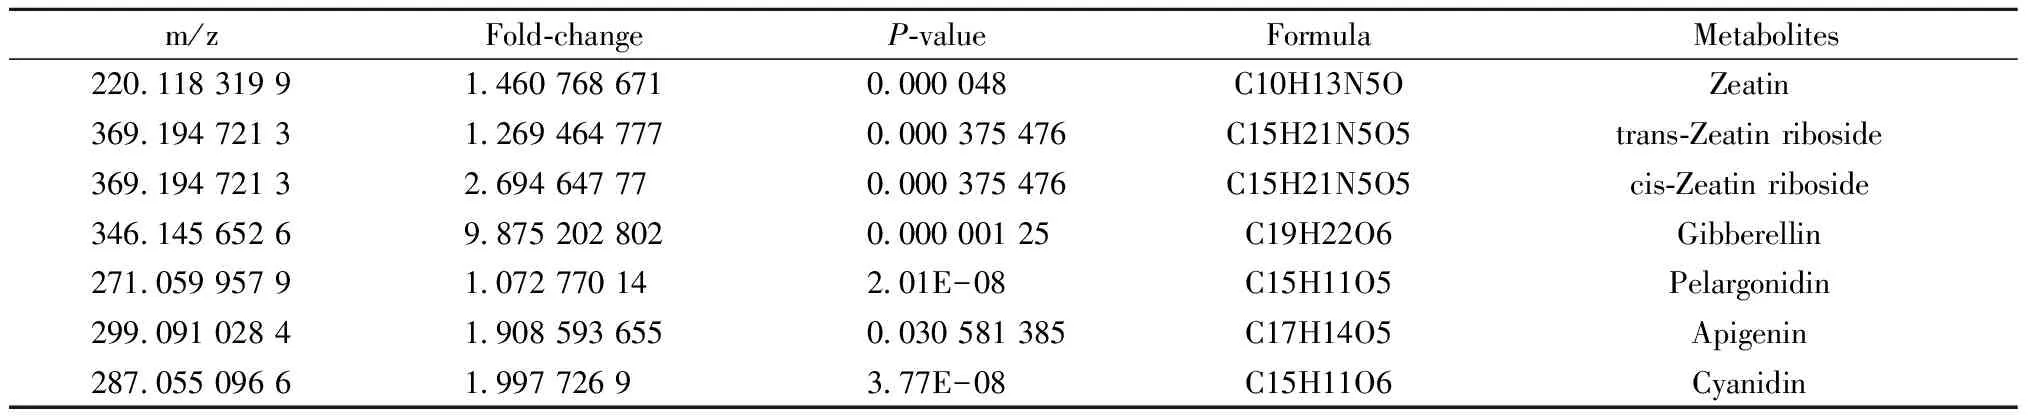
Tab.2 Differentially expressed metabolites related to P. tomentosa PaWB
3 Discussion
In this study, we analyzed changes inP.tomentosametabolites in response to PaWB phytoplasma infection. We obtained a set of 1 612 metabolites, among which changes of hormones and anthocyanin metabolism may be closely related to PaWB.3.1 Approaches used to detect metabolites in organisms, cells, and tissues
Metabonomics aims to describe thenon-targeted “global” analysis of tissues and biofluids for low molecular mass organic endogenous metabolites regardless of whether their chemical structures are known(Kralletal., 2009). Therefore, in view of the advantages to detect subtle differences in the complex mixtures, metabonomics has been used in plants to found metabolites that related to disease. Over the past decade, several methods that offer high accuracy and sensitivity for analysis of highly complex mixtures of compounds have been established, including nuclear magnetic resonance (NMR), gas chromatography-mass spectrometry (GC-MS), mass spectrometry (MS), liquid chromatography-mass spectrometry (LC-MS), high performance liquid chromatography (HPLC). Among these approaches, NMR has the advantages on high information concentration of the spectra and the relative stability of NMR-chemical shifts(Wilsonetal., 2005), but the spectras contain many overlapping peaks and have a low sensitivity(Wardetal., 2007); though GC-MS has a high reproducibility and a relatively broad coverage of compound classes, it not sufficient for analysis of some plant metabolites that are volatile or that can pass the GC separation under the conditions applied (Roessneretal., 2000). While the HPLC-MS has the potential to generate more metabolite profiles and can provide a valuable complementary information and molecule structure of metabolites compared to other methods. Today, HPLC-MS has been used to analyze the thermal instability or low concentration compounds (Wilsonetal., 2005; Kralletal., 2009). Therefore, we used HPLC-MS in this study to analyze the metabolites ofP.tomentosa.
3.2 Anthocyanin metabolism responding to phytoplasma infection inP.tomentosa
During pathogen infection, a series of complex biological and molecular mechanism may be induced to resist to the pathogens in plants, including accumulation of reactive oxygen species and expression of pathogenesis-related proteins (Zipfeletal., 2010; Torresetal., 2006). Previous study has demonstrated that antioxidant plays important role in the defense systems of Paulownia in response to phytoplasma infection like p450 (Liuetal., 2013). In our present study, we indentified similarly functional metabolites. Anthocyanins, a major class of secondary metabolites in plant, are synthesized in the flavonoid pathway and act as antioxidant in biotic and abiotic stress, which can prevent the plant cells from damage that caused by reactive oxygen species (ROS) (Gouldetal., 2002; Margariaetal., 2014; Berlietal., 2010). However, high level of anthocyanins may reduce the defense reactions triggered by the host plant and lead to an increase of phytoplasma growth. In pathogens-infected plants, callose deposition can inhibit the transport of carbohydrate through sieve tubes and cause the structure damage of chloroplast, leading to increased accumulation of ROS (Jietal., 2009; Durrantetal., 2000). ROS, a normal characteristic event of pathogen infection plants, usually acts as secondary messengers and plays a central role in the defense of plants against pathogens (Gaietal., 2014). To some extent, excess H2O2accumulation can lead to oxidative stress, which can trigger plant cell death and then inhibit the cloning and spreading of phytoplasma in plant cell. However, the accumulation of anthocyanins can dampen the protective effect of oxygen radical and reduce the quantity of H2O2that accumulated. As a consequence, the defense mechanism of plant was repressed, which may lead to an accumulation of the phytoplasma. This finding is in line with our results that the concentration of anthocyanins increased in PIS compared with HS. Similar results also were reported in phytoplasma infected grapevine,Arabidopsisthaliana, andLasiodiplodiatheobromae-infected peach (Hrenetal., 2009; Scarparietal., 2005). These results indicated that anthocyanin accumulation may suppress the plant defense systems, possibly resulting in high phytoplasma titers and then the death of the diseased host.3.3 Changes of hormones responding to phytoplasma infection
Hormonal imbalances triggered by phytoplasma infection have been found in previous studies and were considered involved in the formation of symptoms such as witches’ broom and short internodes (Mouetal., 2013; Fanetal., 2104; Gaietal., 2014; Scarparietal., 2005). Increased cytokinin (zeatin) concentration has been demonstrated to be related to the formation of these symptoms. In our metabonomics analysis, it was found that phytohormone balance was disturbed in the interaction of paulownia-phytoplasma, including zeatin and auxin. Zeatins, including cis-zeatin and trans-zeatin, are synthesized through isopentenyl pyrophosphate and play crucial roles in regulating the proliferation and differentiation of plant cells. Altering the concentration of cytokinins was responsible for lateral bud formation, shoots production, short internodes and may help the pathogen to invade the stele region and vasculature (Orchardetal., 1994; Moreauetal., 2014). In our study, the content of isopentenyl adenine, tran-zeatin, cis-zeatin and zeatin riboside increased significantly in PIS compared with healthy seedlings, which is in accord with previous report that the expression levels of several genes involved in zeatin biosynthsis were differentially expressed in phytoplasma infected seedlings at the transcriptome level, includingIPT,CYP735A(Mouetal., 2013; Fanetal., 2014). Isopentenyl transferase (IPT) is the first and key enzyme in zeatin biosynthesis. Up-regulation of IPT may elevate the concentration of cytokinins. In many IPT transgenic plants, witches’ broom and virescence were the most obvious symptoms (Xuetal., 2009; Huetal., 2013). At the same time, key genes likeCRE1 andAHPin CK metabolism were also up-regulated in our previous study at transcriptome level. These results suggested that high level of zeatin may be associated with witches’ broom. Similar findings have also been reported in mulberry, Jujube, and peanut (Gaietal., 2014; Sunetal., 2008; Liuetal., 2014). Auxins have been reported to play significant role in anti-phytoplasma activity (Weintraubetal., 2010). In our study, the concentration of auxin changed slightly, thereby, increasing the cytokinin/auxin ratio, which may lead to the formation of lateral buds. In a word, this study further demonstrated that the overall effect of the differentially expressed hormones described above would be closely related to PaWB from metabonomic level.
两个人都在气头上,父母也不好多劝,过了两天,等田朵的一股怨气、小宁的半腔怒火都消了消之后,双方父母才话里话外地劝合。小宁看这两天田朵忙前忙后的,也就不再提离婚这茬了。其实,回头想想,他们之间并不存在不可调和的矛盾,说到底,就是挤牙膏、吃醋那点破事,和漫长的、珍贵的婚姻之路相比,这些小瑕疵,根本不值一提。
4 Conclusion
In the present study, we preformed a metabolic analysis on healthy and phytoplasma-infectedPaulowniatomentosaseedlings using the non-target HPLC-MS methods. Our result showed that 1 612 metabolites were differentially expressed among the two samples, KEGG pathway analysis revealed the candidate metabolites and inherent pathways potentially involved in PaWB infection. Our study will provide a better understanding of the molecular mechanisms that regulated PaWB and shed some light on the biochemical processes behind phytoplasma pathogenicity. Thus, the results of this study will help us to better understanding the plant-phytoplasma interactions and the mechanisms of Paulownia responses to phytoplasma infection.
Allwood J W, Ellis D I, Goodacre R. 2008. Metabolomic technologies and their application to the study of plants and plant-host interactions. Physiol Plantarum, 132(2):117-135.
Ates S, Ni Y, Akgul M,etal. 2008. Characterization and evaluation ofPaulowniaelongotaas a raw material for paper production. Afr J Biotechnol, 7(22):4153-4158.
Bayliss K L, Saqib M, Dell B,etal. 2005. First record of ‘CandidatusPhytoplasma australiense’ inPaulowniatrees. Australas Plant Path, (1):123-124.
Berli F J, Moreno D, Piccoli P,etal. 2010. Abscisic acid is involved in the response of grape (VitisviniferaL.) cv. Malbec leaf tissues to ultraviolet-B radiation by enhancing ultraviolet-absorbing compounds, antioxidant enzymes and membrane sterols. Plant Cell Environ, 33(1):1-10.
Cao X B, Fan G Q, Deng M J,etal. 2014a. Identification of genes related to Paulownia witches’ broom by AFLP and MSAP. Int J Mol Sci, 15(8):14669-14683.
Cao X B, Fan G Q, Zhai X Q. 2012. Morphological changes of the witches’ broom seedlings ofPaulowniatomentosatreated with methyl methanesulphonate and SSR analysis. Acta Phytopathologica Sin, 42(2):214-218. [in Chniese]
Cao X B, Fan G Q, Zhao Z L,etal. 2014b. Morphological changes of paulownia seedlings infected phytoplasmas reveal the genes associated with witches’ broom through AFLP and MSAP. PLoS One, 9(10):e112533.
DiLeo M V, Strahan G D, den Bakker M,etal. 2011. Weighted correlation network analysis (WGCNA) applied to the tomato fruit metabolome. PLoS One, 6(10):e26683.
Durrant W E, Rowland O, Piedras P,etal. 2000. cDNA-AFLP reveals a striking overlap in race-specific resistance and wound response gene expression profiles. The Plant Cell Online, 12(6):963-977.
Fan G Q, Dong Y P, Deng M J,etal. 2014. Plant-pathogen interaction, circadian rhythm, and hormone-related gene expression provide indicators of phytoplasma infection inPaulowniafortunei. Int J Mol Sci, 15(12):23141-23162.
Fan G Q, Zhang S, Zhai X Q,etal. 2007. Effects of antibiotics on the Paulownia witches’ broom phytoplasmas and pathogenic protein related to witches’ broom symptom. Sci Silv Sin, 43(3):138-142.[in Chniese]
Gai Y P, Han X J, Li Y Q,etal. 2014. Metabolomic analysis reveals the potential metabolites and pathogenesis involved in mulberry yellow dwarf disease. Plant Cell Environ, 37(6):1474-1490.
Gould K S, McKelvie J, Markham K R. 2002. Do anthocyanins function as antioxidants in leaves? Imaging of H2O2in red and green leaves after mechanical injury. Plant Cell Environ, 25(10):1261-1269.
Hren M, Nikolic P, Rotter A,etal. 2009. ‘Bois noir’ phytoplasma induces significant reprogramming of the leaf transcriptome in the field grown grapevine. BMC Genomics, 10(1):460.
Hu J X, Tian G Z, Lin C L,etal. 2013. Cloning, expression and characterization of tRNA-isopentenyltransferase genes (tRNA-ipt) from paulownia witches′-broom phytoplasma. Acta Microbiologica Sinica, 53(8):832-841.[in Chniese]
Ipekci Z, Gozukirmizi N. 2003. Direct somatic embryogenesis and synthetic seed production fromPaulowniaelongata. Plant Cell Rep, 22(1):16-24.
Ji X, Gai Y P, Zheng C,etal. 2009. Comparative proteomic analysis provides new insights into mulberry dwarf responses in mulberry (MorusalbaL.). Proteomics, 9(23):5328-5339.
Jin K X, Liang C J, Deng D L. 1981.A study of the insect vectors of witches’ broom in Paulownia trees. Linye Keji Tongxun, (12): 23-24.
Krall L, Huege J, Catchpole G,etal. 2009. Assessment of sampling strategies for gas chromatography-mass spectrometry (GC-MS) based metabolomics of cyanobacteria. J Chromatogr B, 877(27):2952-2960.
Lee I M, Hammond R E, Davis R E,etal. 1993. Universal amplification and analysis of pathogen 16S rDNA for classification and identification of mycoplasmalike organisms. Phytopathology, 83(8):834-42.
Liu L Y, Tseng H I, Lin C P,etal. 2014. High-throughput transcriptome analysis of the leafy flower transition ofCatharanthusroseusinduced by peanut witches’-broom phytoplasma infection. Plant Cell Physiol, 55(5):942-957.
Liu R N, Dong Y P, Fan G Q,etal. 2013. Discovery of genes related to witches broom disease inPaulowniatomentosa×Paulowniafortuneiby a De Novo assembled transcriptome. PLoS One, 8(11):e80238.
Luan H, Chen X M, Zhong S L,etal. 2013. Serum metabolomics reveals lipid metabolism variation between coronary artery disease and congestive heart failure: a pilot study. Biomarkers, 18(4):314-321.
Margaria P, Ferrandino A, Caciagli P,etal. 2014. Metabolic and transcript analysis of the flavonoid pathway in diseased and recovered Nebbiolo and Barbera grapevines (VitisviniferaL.) following infection by Flavescence doree phytoplasma. Plant Cell Environ, 37(9):2183-2200.
Moreau S, Fromentin J, Vailleau F,etal. 2014. The symbiotic transcription factor MtEFD and cytokinins are positively acting in theMedicagotruncatulaandRalstoniasolanacearumpathogenic interaction. New Phytol, 201(4):1343-1357.
Mou H Q, Lu J, Zhu S F,etal. 2013. Transcriptomic analysis of Paulownia infected by Paulownia witches’-broom phytoplasma. PLoS One, 8(10):e77217.
Namba S. 2002. Molecular biological studies on phytoplasmas.J Gen Plant Pathol, 68(3):257-259.
Niu S Y, Fan G Q, Deng M J,etal. 2016. Discovery of microRNAs and transcript targets related to witches’ broom disease in Paulownia fortunei by high-throughput sequencing and degradome approach. Mol Genet Genomics, 291(1):181-191.
Orchard J, Collin H, Hardwick K,etal. 1994. Changes in morphology and measurement of cytokinin levels during the development of witches’ brooms on cocoa. Plant Pathol, 43(1):65-72.
Roessner U, Wagner C, Kopka J,etal. 2000. Simultaneous analysis of metabolites in potato tuber by gas chromatography-mass spectrometry. Plant J, 23(1):131-142.
Rural Industry Business Services. 1998.Paulownia: a commercial overview. Queensland:Department of Primary Industries.
Scarpari L M, Meinhardt L W, Mazzafera P,etal. 2005. Biochemical changes during the development of witches’ broom: the most important disease of cocoa in Brazil caused byCrinipellisperniciosa. J exp bot, 56(413):865-877.
Sun Q, Zhou G, Sun H,etal. 2008. Effect of auxins on in vitro propagation of sour jujube infected by witches’ broom phytoplasma. International Jujube Symposium, 840:303-308.
Torres M A, Jones J D E, Dangl J F. 2006. Reactive oxygen species signalling in response to pathogens. Plant Physiol, 141(2):373-378.
Ward J L, Baker J M, Beale M H. 2007. Recent applications of NMR spectroscopy in plant metabolomics. FEBS J, 274 (5):1126-1131.
Wang J, Zhang X, Shi M,etal. 2014. Metabolomic analysis of the salt-sensitive mutants reveals changes in amino acid and fatty acid composition important to long-term salt stress inSynechocystissp. PCC 6803. Funct Integr Genomic, 14(2):431-440.
Want E J, Wilson I D, Gika H,etal. 2010. Global metabolic profiling procedures for urine using UPLC-MS. Nature Protocols, 5(6):1005-1018.
Weintraub P G, Jones P. 2010. Phytoplasmas: genomes, plant hosts and vectors. Wallingford:CABI.
Wilson I D, Plumb R, Granger J. 2005.HPLC-MS-based methods for the study of metabonomics. J Chromatogr B, 817(1):67-76.
Xu S, Sun Y M, Jia Z C,etal. 2009. Effect of overexpression of IPT and KN1 on development and growth of transgenic tobacco plants. Plant Physiol Commun, 45(6):537-543.
Zhang Y Z, Cao X B, Zhai X Q,etal. 2009. Study on DNA extraction of AFLP reaction system for Paulownia plants. J Henan Agric Univ, 43(6):610-614.[in Chinese]
Zipfel C, Robatzek S. 2010.Pathogen-associated molecular pattern-triggered immunity: veni, vidi...? Plant Physiol, 154(2):551-554.
(责任编辑 王艳娜 郭广荣)
泡桐丛枝病发生与代谢组变化的关系*
曹亚兵1翟晓巧2邓敏捷1赵振利1范国强1
(1.河南农业大学泡桐研究所 郑州 450002; 2.河南省林业科学研究院 郑州 450008)
【目的】 通过对泡桐健康苗和丛枝病苗进行代谢组分析,探讨代谢物变化与泡桐丛枝病发生的关系。【方法】 利用非靶标的高效液相色谱-质谱联用技术(HPLC-MS)对长度为1.5 cm的健康和植原体感染的毛泡桐组培苗顶芽进行代谢组分析,将上机检测得到的质谱数据用主成分分析和偏最小二乘判别分析法进行分析得到最终差异的荷质比,并将其比对到KEGG代谢物数据库中,通过分析找到植原体感染的毛泡桐组培苗与健康组培苗之间代谢物含量和种类的差异。【结果】 毛泡桐病苗和健康苗中有1 612种代谢物发生变化。与健康苗相比,在病苗中有765种代谢物含量下降,847种代谢物含量增多。KEGG代谢通路分析表明,这些代谢物中有460种代谢物参与111个代谢途径,其中变化显著的3个代谢途径为“异喹啉生物碱合成”、“双萜类生物合成”和“黄酮生物合成”。另外,病苗中参与植物激素信号转导的代谢物也发生明显变化。其中在植原体感染的毛泡桐病苗中玉米素、玉米素核苷、赤霉素、二氢玉米素核苷、花葵素、黄芩素和花青色素等含量发生明显变化,表明这些代谢物含量的变化可能与丛枝病发生有一定关系。【结论】 通过比较健康苗和病苗中代谢物含量和种类的变化,找出可能与丛枝病发生密切相关的代谢物及其相应的代谢通路,该结果有助于进一步阐明泡桐和其他植物丛枝病发生分子机制,并为泡桐丛枝病有效防治奠定基础。
毛泡桐; 代谢组; 丛枝病; 植物激素; 花青素
S763.11
A
1001-7488(2017)06-0085-09
10.11707/j.1001-7488.20170610
Received date: 2016-02-22; Revised date: 2017-03-11.
Funding Project: National Natural Science Foundation of China (U1204309); Outstanding Talents Project of Henan Province (122101110700); Natural Science Foundation of Henan Province of China (162300410158); Outstanding Talents Project of Henan Province (174200510001).
*Fan Guoqiang is corresponding author.