热带太平洋海平面低频变化
2017-07-07陆青左军成吴灵君
陆青,左军成,吴灵君
(1. 国家海洋局第二海洋研究所 卫星海洋环境动力学国家重点实验室,浙江 杭州 310012;2. 浙江海洋大学 海洋科学与技术学院,浙江 舟山 316000;3.河海大学 文天学院,安徽 马鞍山 243031)
热带太平洋海平面低频变化
陆青1,左军成2,吴灵君3
(1. 国家海洋局第二海洋研究所 卫星海洋环境动力学国家重点实验室,浙江 杭州 310012;2. 浙江海洋大学 海洋科学与技术学院,浙江 舟山 316000;3.河海大学 文天学院,安徽 马鞍山 243031)
本文选取ECMWF ORAS4再分析数据对1959-2015年热带太平洋海平面的低频变化进行了分析。热带太平洋海平面年际变化第一模态反映了ENSO爆发阶段的海平面变化,热带东、西太平洋变化反相,其时间序列与Nio3.4指数高度相关。海平面第二模态则体现了El Nio爆发前后热带太平洋暖水的输运过程。El Nio爆发前热带西太平洋暖水聚集的位置,以及爆发后暖水向赤道外输运的位置在两类El Nio事件中均有所不同。此外,ENSO的周期在近半个世纪发生了显著的年代际变化,这一变化与热带太平洋的年代际变化有关。热带太平洋的年代际变化对海平面趋势变化也有着显著的影响。卫星高度计观测到的近20年海平面的快速上升(下降)正是由20世纪90年代后热带太平洋频繁的位相转换引起的。
热带太平洋;海平面;年际变化;年代际变化;趋势变化
1 引言
近年来,海平面的低频变化是物理海洋学研究的热点问题之一。这不仅因为海平面的上升给人口密集且经济发达的沿海城市群带来了巨大的威胁,还因为海平面变化是海洋内部动力与热力过程变化的一个体现,它可作为研究大洋环流和气候变化的一个指标。由于不同海域受大气环流和海洋环流等因素的影响不同,全球海平面变化在空间上呈现出显著的区域差异性。热带太平洋是全球海平面变化最典型的海域之一,它不仅具有明显的季节变化,而且年际与年代际变化也十分显著。
随着观测数据的丰富和数值模式的发展,对海平面变化的研究也逐渐深入。研究发现,热带太平洋海平面从季节尺度到年代际尺度,甚至是长期趋势变化上均存在着显著的变化。季节尺度上,海平面变化最强烈的海域在热带太平洋东北部,其季节信号占海平面变化总信号的60%以上[1]。年际尺度上,ENSO(El Nio-Southern Oscillation)是热带太平洋最显著的年际信号[2]。海平面的变化与温跃层厚度变化关系密切,因此许多学者通过分析热带太平洋的海平面变化来研究ENSO的海洋动力过程[3-4]。关于热带太平洋年代际和多年代际变化的机制,目前尚未有定论,有学者认为热带太平洋的年代际变化可由其自身的海气相互作用产生[5-7],也有人认为热带太平洋年代际变化主要受副热带太平洋年代际变化影响[8-10]。
此外,热带太平洋海平面的趋势变化也一直是研究的热点。前人利用验潮站资料、海平面重构资料、再分析数据和卫星高度计数据发现,热带太平洋海平面近20年的变化速率远大于过去半个世纪的变化速率,并且热带东、西太平洋呈现显著的空间差异[11-15]。研究表明,海平面的趋势变化与所分析数据的时间序列长度有很大关系[16]。对于卫星高度计数据而言,它的时间跨度仅20年左右,其海平面趋势变化受ENSO、PDO(Pacific Decadal Oscillation)等气候现象的影响显著[17]。所以,本文选取时间序列相对较长的SODA 2.2.4和ECMWF ORAS4再分析海平面数据,通过与卫星观测海平面的对比,选择相对接近卫星观测数据的一组资料来分析热带太平洋海平面近半个世纪的低频变化特征及其原因。
2 数据介绍
本文热带太平洋的地理范围定义为20°S~20°N,120°E~80°W。海平面低频变化是本文关注的重点,所以季节变化以及周期小于1 a的变化均已通过低通滤波从月均海平面的时间序列中移除。
本文所用的卫星高度计数据来源于AVISO[18-19](Archivings Validation and Interpretation of Satellite Oceanographic Data)网站,数据的空间分辨率为0.25°×0.25°,时间范围为1993年1月至2015年12月,时间间隔为1个月。对于更长时间跨度的海平面数据,本文选用的是SODA 2.2.4[20]和ECMWF ORAS4[21]的再分析资料。其中,SODA资料由美国马里兰大学大气与海洋科学系联合美国德克萨斯州农工大学海洋学系共同研发,其空间分辨率为0.5°×0.5°,时间范围为1958年1月到2010年12月;而ECMWF ORAS4资料由欧洲中期天气预报中心制作,空间分辨率是1°×1°,时间从1958年1月至2015年12月,两组再分析资料均为月均资料。此外,本文选择选择Nio3指数(5°S~5°N,150°~90°W)来表示东部型El Nio, Nio4指数(5°S~5°N,160°E~150°W)表示中部型El Nio,Nio3.4指数(5°S~5°N,170°~120°W)来表示两种类型皆有的El Nio。
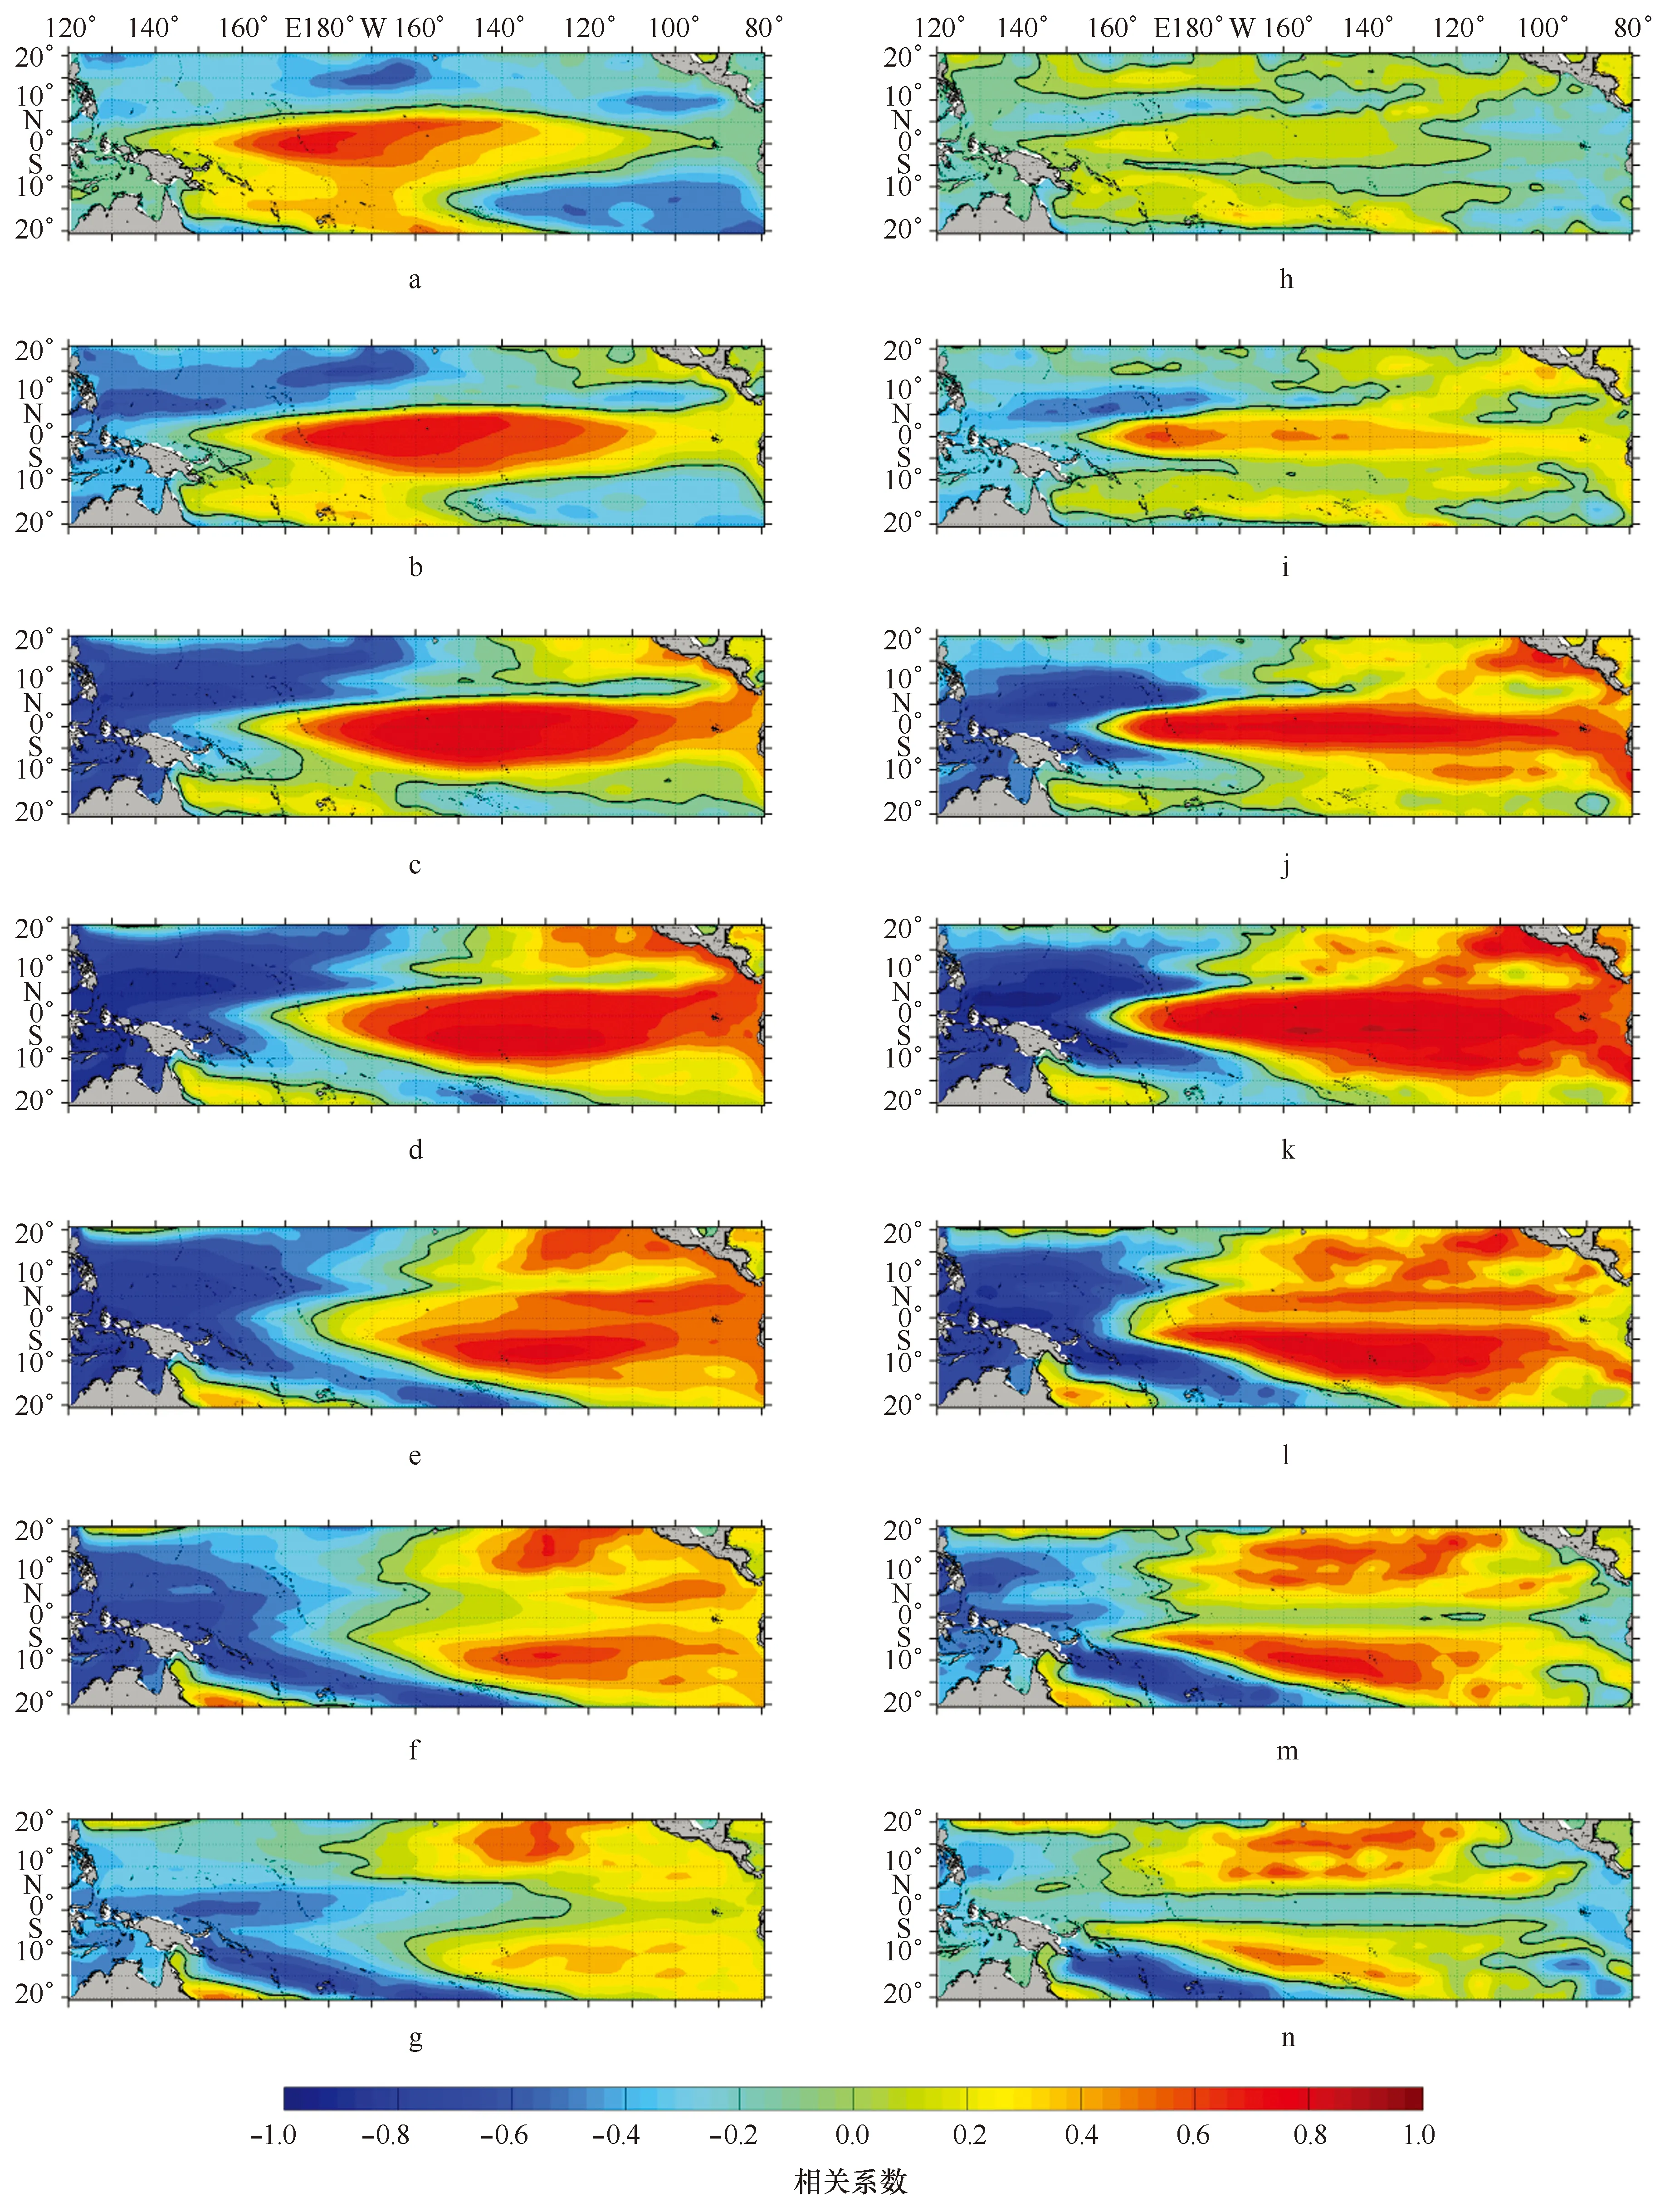
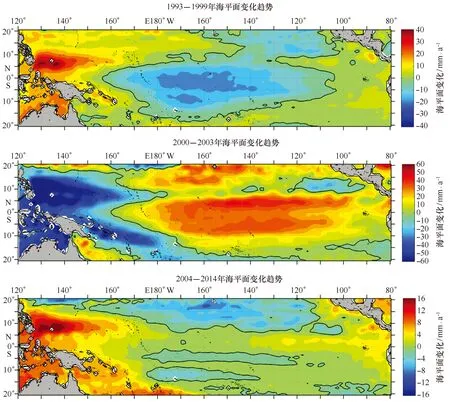
上述3个海平面资料的重合时段为1993年1月至2010年12月,因此,本文使用回报技巧评分将该时段内的再分析海平面与卫星高度计数据进行了对比(图1)。其中,回报技巧评分的定义为S=1-〈(h0-hp)2〉/〈(h0)2〉,h0和hp分别为观测和回报的海平面高度异常,中括号表示时间平均。S的取值范围为-∞ 为研究热带太平洋海平面的年际变化,我们对海平面进行了EOF分解。EOF前两个模态的方差贡献率分别为45%和16%,两者之和超过总方差贡献的一半,因此,下文主要对EOF的前两个模态进行深入分析。 热带太平洋海平面EOF第一模态反映的是ENSO变化。该模态在空间上表现为热带东、西太平洋海平面变化反相(图2),且其时间序列与Nio3.4指数有着很好的相关关系,两者即时相关高达r=0.93(P<0.001)。对第一模态的时间序列进行小波分析可以看出,ENSO的周期在近半个世纪发生了显著的变化(图3b)。1978年之前ENSO的周期主要是2~4 a;而1978-2000年,ENSO的周期变为2~6 a,其中4~6 a周期的能谱信号异常强烈。Wang和An[22]认为ENSO周期在20世纪70年代中期表现出的年代际变化与热带太平洋平均背景风场的改变有关。2000年后,4 a左右周期的能谱信号减弱,ENSO的周期变为2~3 a和5~6 a。 热带太平洋海平面EOF第二模态反映的年际变化与ENSO的发展过程有关。第二模态的时间序列提前Nio3.4指数7个月时,两者呈最大正相关(r=0.41,P<0.001);而第二模态的时间序列滞后Nio3.4指数8个月时,两者呈最大负相关(r=-0.55,P<0.001)。第二模态时间序列的小波分析显示,1978年前及2000年后,第二模态的周期是2~4 a,而1978-2000年,周期为2~6 a,其中4~6 a周期的能谱信号异常强烈(图3d)。 图1 SODA 2.2.4(a)和ECMWF ORAS4(b)对热带太平洋卫星观测海平面的回报技巧评分(图中等值线间隔为0.1,黑色等值线表示S=0)Fig.1 Skills of reanalysis data from SODA 2.2.4 (a) and ECMWF ORAS4 (b) in explaining the variance of altimetry-derived sea surface height anomalies in the tropical Pacific (contours indicate a skill of 0.1, black contours denote S=0) 图2 热带太平洋海平面年际变化第一模态与第二模态的空间分布Fig.2 The spatial patterns of the first two EOF modes of interannual sea level variation in the tropical Pacific 图3 热带太平洋海平面年际变化第一模态和第二模态的标准化时间序列(黑线,彩色直方图表示Nio3.4指数)及其小波能谱图Fig.3 The first two principal components (black lines, color histogram indicates the Nio3.4 index) of interannual sea level variation and theirs wavelet power spectrum diagrams 图4 1979-1999年和2000-2015年热带太平洋SSH分别与Nio3(左列)和Nio4(右列)指数的滞后相关系数空间分布(图中a~g分别表示海平面高度滞后Nio3指数-9,-6,-3,0,3,6,9个月时的相关系数,h~n分别表示海平面高度滞后Nio4指数-9,-6,-3,0,3,6,9个月时的相关系数,负号表示提前)Fig.4 Lagged-regression coefficients between the 1979-1999 sea surface height and the Nio3 index (left panels, figs. a-g mean sea surface height lag the Nio3 index-9,-6,-3, 0, 3, 6, 9 months), and between the 2000-2015 sea surface height and the Nio4 index (right panels, figs. h-n mean sea surface height lag the Nio4 index-9,-6,-3, 0, 3, 6, 9 months) 关于热带太平洋年代际变化的机制,到底是由热带太平洋本身的海气系统相互作用产生的[5-7],还是由副热带年代际变化通过海洋通道或者大气桥影响热带太平洋的[8-10],目前还没有定论。 图5 热带太平洋海平面年代际变化第一模态的空间分布以及标准化时间序列(黑线,彩色直方图表示PDO指数) Fig.5 The spatial pattern and principal components (black line, color histogram indicates the PDO index) of the first EOF mode of decadal sea level variation in the tropical Pacific 热带太平洋海平面趋势变化因资料长度的不同,影响其变化的因素也有所不同。当海平面的时间序列长度在10 a左右时,其趋势变化受年际变化(如ENSO循环)影响显著;而当数据长度为几十年时,海平面趋势变化除受年际变化影响外,还受年代际变化和全球气候变化的影响。 在1958-2015年整个时间段上,热带太平洋海平面趋势变化存在显著的空间差异,如图6中所示,趋势变化最显著的区域在热带西北太平洋(区域A,5°~15°N,125°~160°E),最大上升趋势为2.7 mm/a;赤道中太平洋(区域B,5°S~5°N,180°~140°W)呈微弱的下降趋势(-0.8 mm/a);而赤道东太平洋(区域C,5°S~5°N,110°~80°W)无明显的上升或下降趋势。下文将选取上述3个区域,分别讨论它们在不同时段的海平面趋势变化。 前人的研究表明,全球平均表面气温在PDO的冷位相时无明显的趋势变化,在PDO的暖位相时加速上升,而2000年后这一趋势变化又趋于停滞[32]。热带太平洋在其年代际变化的冷位相时(1958-1978年),热带西北太平洋海平面上升趋势明显(3.8 mm/a,图7),赤道中、东太平洋海平面虽然均呈下降趋势,但赤道中太平洋的下降趋势更为显著(-3.5 mm/a);而在热带太平洋的暖位相时(1979-1998年),赤道中太平洋变化停滞,热带西北太平洋海平面下降(-2.9 mm/a),赤道东太平洋海平面上升(1.5 mm/a);2000年后,3个区域的海平面均呈上升趋势。换言之,在全球平均表面气温加速上升时,热带太平洋的海平面并未表现出显著的上升趋势,甚至热带西太平洋海平面出现下降趋势;而在全球平均表面气温趋势变化停滞的近十多年,热带太平洋海平面呈显著的上升趋势。 图6 1958-2015年热带太平洋海平面趋势变化空间分布Fig.6 Linear trend in sea surface height in the tropical Pacific over the period 1958-2015 图7 热带西北太平洋(a),赤道中太平洋(b)以及赤道东太平洋(c)海平面低频变化时间序列(黑线,红线表示卫星高度计的时间序列,两者均通过4 a低通滤波)及其趋势(蓝线)Fig.7 Low-frequency sea level time series (black lines, red lines indicated the AVISO sea surface height, both two have pass the 4 a low-pass filter) and their trends(blue lines) in the northwestern tropical Pacific (a), central equatorial-Pacific (b) and eastern equatorial-Pacific (c) 此外,如图7所示,热带太平洋海平面(ECMWF ORAS4和卫星高度计数据)在1993-1999年表现出3~4 cm/a的上升或下降速率,这与热带太平洋的年代际变化有关。热带太平洋在1993-1999年期间由暖位相转变为冷位相,2000-2003年期间迅速地由冷位相变为暖位相,而后,2004-2014年又由暖位相转变为冷位相。所以,热带西太平洋海平面在1993-1999年迅速上升,而在2000-2003年快速下降,而赤道中太平洋海平面的变化与之相反(图8)。热带太平洋信风的变化是造成热带太平洋海平面趋势年代际变化的直接原因[33-36]。 图8 1993-1999年(a),2000-2003年(b)以及2004-2014年(c)热带太平洋海平面趋势变化空间分布Fig.8 Linear trends in sea surface height in the tropical Pacific over the period 1993-1999(a), 2000-2003(b), and 2004-2014(c) 通过与1993-2010年AVISO卫星高度计数据的比较,发现在热带太平洋大部分区域,SODA 2.2.4与ECMWF ORAS4均能较好地再现实际海平面变化,然而在热带东南太平洋,SODA 2.2.4与卫星高度计数据差异较大,所以本文的结论基于对1959-2015年ECMWF ORAS4海平面数据的分析。 热带太平洋年际变化第一模态反映的是ENSO爆发阶段的海平面变化,空间上呈东西反相变化,时间序列与Nio3.4指数高度相关。ENSO的周期在近半个世纪发生了显著的变化,1978年之前ENSO的周期主要是2~4 a;而1978-2000年,ENSO的周期变为2~6 a,其中4~6 a的周期信号异常强烈;2000年后,4 a左右的周期信号减弱,ENSO的周期变为2~3 a和5~6 a。年际变化的第二模态体现了ENSO的发展过程。为区别两类El Nio事件的发展过程,本文分别将1979-1999年和2000-2015年的SSH分别与Nio3指数和Nio4指数进行了相关分析。El Nio爆发前热带西太平洋暖水聚集的位置,以及爆发后暖水向赤道外输运的位置在两类El Nio事件中均有所不同。 年代际尺度上,热带太平洋有着与PDO变化类似的位相变化。热带太平洋在1978年前处于冷位相,1979-1998年为暖位相,1999-2015年经历了由冷位相转为暖位相然后又转变为冷位相的过程。 热带太平洋海平面趋势变化因资料长度不同,影响因素不同而有所不同。在1958-2015年整个时间段上,热带太平洋海域的海平面上升(或下降)趋势不超过3 mm/a,但存在显著的空间差异。在1958-1978年的冷位相时期,热带太平洋的海平面趋势变化相对缓慢。然而20世纪90年代后,热带太平洋频繁的位相转换,使得1993-1999年海平面最大上升(或下降)速率能够达到3~4 cm/a。这也使得卫星高度计观测到的近20年的海平面变化速率远大于过去近半个世纪的海平面变化速率。 [1] Vinogradov S V, Ponte R M, Heimbach P, et al. The mean seasonal cycle in sea level estimated from a data-constrained general circulation model[J]. Journal of Geophysical Research: Oceans (1978—2012), 2008, 113(C3):203-212. [2] Wyrtki K. El Nio-the dynamic response of the equatorial Pacific Ocean to atmospheric forcing[J]. Journal of Physical Oceanography, 1975, 5(4): 572-584. [3] Rebert J P, Donguy J R, Eldin G, et al. Relations between sea level, thermocline depth, heat content, and dynamic height in the tropical Pacific Ocean[J]. Journal of Geophysical Research Oceans, 1985, 90(C6):11719-11725. [4] Palanisamy H, Cazenave A, Delcroix T, et al. Spatial trend patterns in the Pacific Ocean sea level during the altimetry era: the contribution of thermocline depth change and internal climate variability[J]. Ocean Dynamics, 2015, 65(3):341-356. [5] Liu Z,Yang H. How long is the memory of tropical ocean dynamics?[J]. Journal of Climate, 2002, 15(23): 3518-3522. [6] Rodgers K B, Friederichs P, Latif M. Tropical Pacific decadal variability and its relation to decadal modulations of ENSO[J]. Journal of Climate, 2004, 17(19): 3761-3774. [7] Yeh S W, Kirtman B P. Tropical Pacific decadal variability and ENSO amplitude modulation in a CGCM[J]. Journal of Geophysical Research: Oceans (1978—2012), 2004, 109(C11):140-143. [8] Gu D, Philander S G H. Interdecadal climate fluctuations that depend on exchanges between the tropics and extratropics[J]. Science, 1997, 275(5301): 805-807. [9] Wang Q, Huang R X. Decadal variability of pycnocline flows from the subtropical to the equatorial Pacific[J]. Journal of Physical Oceanography, 2005, 35(10): 1861-1875. [10] Yang Haijun, Liu Zhengyu, Wang Hui. Influence of extratropical thermal and wind forcings on equatorial thermocline in an ocean GCM[J]. Journal of Physical Oceanography, 2004, 34(1): 174-187. [11] Carton J A, Giese B S, Grodsky S A. Sea level rise and the warming of the oceans in the Simple Ocean Data Assimilation (SODA) ocean reanalysis[J]. Journal of Geophysical Research: Oceans (1978—2012), 2005, 110(C9):291-295. [12] Lombard A, Garric G, Penduff T. Regional patterns of observed sea level change: insights from a 1/4 global ocean/sea-ice hindcast[J]. Ocean Dynamics, 2009, 59(3): 433-449. [13] Timmermann A, McGregor S, Jin F F. Wind effects on past and future regional Sea level trends in the Southern Indo-Pacific[J]. Journal of Climate, 2010, 23(16): 4429-4437. [14] Qiu Bo, Chen Shuiming. Multidecadal sea level and gyre circulation variability in the northwestern tropical Pacific Ocean[J]. Journal of Physical Oceanography, 2012, 42(1): 193-206. [15] Köhl A, Stammer D, Cornuelle B. Interannual to decadal changes in the ECCO global synthesis[J]. Journal of Physical Oceanography, 2007, 37(2): 313-337. [16] 顾小丽, 李培良. 太平洋海平面变化特征及影响因素分析[J]. 海洋学报, 2009, 31(1): 28-36. Gu Xiaoli, Li Peiliang. Pacific sea level variations and its factors[J]. Haiyang Xuebao, 2009, 31(1): 28-36. [17] Bindoff N L, Willebrand J, Artale V, et al. Observations: Oceanic Climate Change and Sea Level[M]. Cambridge:Cambridge University Press,2007:385-432. [18] Tapley B D, Chambers D P, Shum C K, et al. Accuracy assessment of the large-scale dynamic ocean topography from TOPEX/POSEIDON altimetry[J]. Journal of Geophysical Research Atmospheres, 1995, 99(C12):24605-24617. [19] Ducet N, Traon P Y L, Reverdin G. Global high-resolution mapping of ocean circulation from TOPEX/Poseidon and ERS-1 and -2[J]. Journal of Geophysical Research Oceans, 2000, 105(C8):19477-19498. [20] Carton J A, Giese B S, Grodsky S A. Sea level rise and the warming of the oceans in the Simple Ocean Data Assimilation (SODA) ocean reanalysis[J]. Journal of Geophysical Research Oceans, 2005, 110(C9):291-295. [21] Balmaseda M A, Mogensen K, Weaver A T. Evaluation of the ECMWF ocean reanalysis system ORAS4[J]. Quarterly Journal of the Royal Meteorological Society, 2013, 139(674):1132-1161. [22] Wang B, An S. A mechanism for decadal changes of ENSO behavior: roles of background wind changes[J]. Climate Dynamics, 2002, 18(6):475-486. [23] Kao H Y, Yu J Y. Contrasting eastern-Pacific and central-Pacific types of ENSO[J]. Journal of Climate, 2009, 22(3):615-632. [24] Ashok K, Behera S K, Rao S A, et al. El Nio Modoki and its possible teleconnection[J]. Journal of Geophysical Research, 2007, 112(C11):C11007. [25] Singh A, Delcroix T. Eastern and Central Pacific ENSO and their relationships to the recharge/discharge oscillator paradigm[J]. Deep-Sea Research Part I:Oceanographic Research Papers, 2013, 82(4):32-43. [26] Jin F F. An Equatorial ocean recharge paradigm for ENSO. Part I: Conceptual model[J]. Journal of the Atmospheric Sciences, 1997, 54(7):811-829. [27] Jin F F. An Equatorial ocean recharge paradigm for ENSO. Part Ⅱ: A stripped-down coupled model[J]. Journal of the Atmospheric Sciences, 1997, 54(7):830-847. [28] Ren H L, Jin F F. Recharge Oscillator mechanisms in two types of ENSO[J]. Journal of Climate, 2013, 26(17):6506-6523. [29] Lu Qing, Ruan Zhenxin, Wang Dongping, et al. Zonal transport from the western boundary and its role in warm water volume changes during ENSO[J]. Journal of Physical Oceanography, 2017,47(1):211-225. [30] 冯琳. 热带太平洋年代际变化及其形成机制探讨[D]. 青岛:中国海洋大学, 2008. Feng Lin.Study on the long-term variability of the tropical Pacific Ocean and its mechanism[D]. Qingdao: Ocean Uinversity of China, 2008. [31] Trenberth K E, Fasullo J T. An apparent hiatus in global warming?[J]. Earths Future, 2013, 1(1):19-32. [32] Farneti R, Molteni F, Kucharski F. Pacific interdecadal variability driven by tropical-extratropical interactions[J]. Climate Dynamics, 2014, 42(11/12):3337-3355. [33] Vivier F, Kelly K A, Thompson L A. Contributions of wind forcing, waves, and surface heating to sea surface height observations in the Pacific Ocean[J]. Journal of Geophysical Research Atmospheres, 1999, 104(C9):20767-20788. [34] Köhl A, Stammer D. Decadal sea level changes in the 50-year GECCO ocean synthesis[J]. Journal of Physical Oceanography, 2008, 21(9):1876-1890. [35] Timmermann A, Mcgregor S, Jin F F. Wind effects on past and future regional sea level trends in the Southern Indo-Pacific[J]. Journal of Climate, 2010, 23(16):4429-4437. [36] Merrifield M A, Maltrud M E. Regional sea level trends due to a Pacific trade wind intensification[J]. Geophysical Research Letters, 2011, 38(21):759-775. Low-frequency variation in sea level in the tropical Pacific Lu Qing1, Zuo Juncheng2, Wu Lingjun3 (1.StateKeyLaboratoryofSatelliteOceanEnvironmentDynamics,SecondInstituteofOceanography,StateOceanicAdministration,Hangzhou310012,China; 2.MarineScienceandTechnologyCollege,ZhejiangOceanUniversity,Zhoushan316000,China; 3.WentianCollege,HohaiUniversity,Maanshan243031,China) The ECMWF ORAS4 reanalysis is used to study the low-frequency variation in sea level in the tropical Pacific in this paper. The first mode of interannual sea level variation in the tropical Pacific reflects the burst of El Nio. The sea level change in the tropical eastern Pacific is opposite to that in the tropical western Pacific, and the principal component of the first mode is highly correlated with the Nio3.4 index. The second mode shows the warm water transport process during the El Nio. The locations where the warm water gathered in before El Nio, and the positions where the warm water started to transport to high latitude are different in the two types of El Nio events. Besides, there is a remarkable decadal change in the cycles of ENSO, and this is linked with the decadal variation in the tropical Pacific. The sea level trends are also affected by the decadal variation. The high rise (descend) rate after 1993 that observed by altimeter is caused by the phase-switching. tropical Pacific; sea level; interannual variation; decadal change; trend 2016-11-27; 2017-03-16。 国家自然科学基金项目(41690120,41690121,41621064);国家海洋局第二海洋研究所中央级公益性科研院所基本科研业务费专项资金项目(JG1510)。 陆青(1986—),女,江苏省镇江市人,博士,助理研究员,从事气候与海平面变化研究。E-mail:luqinghhu@hotmail.com 10.3969/j.issn.0253-4193.2017.07.005 P731.23 A 0253-4193(2017)07-0043-10 陆青,左军成,吴灵君. 热带太平洋海平面低频变化[J]. 海洋学报, 2017, 39(7): 43-52, Lu Qing, Zuo Juncheng, Wu Lingjun. Low-frequency variation in sea level in the tropical Pacific[J]. Haiyang Xuebao, 2017, 39(7): 43-52, doi:10.3969/j.issn.0253-4193.2017.07.0053 热带太平洋海平面年际变化时空特征


4 热带太平洋海平面年代际变化


5 热带太平洋海平面趋势变化


6 小结