近57年厄尔尼诺-南方涛动事件对哈尔滨地区气候的影响
2017-05-10刘丹,赵景波
近57年厄尔尼诺-南方涛动事件对哈尔滨地区气候的影响
刘 丹,赵景波
陕西师范大学 旅游与环境学院,西安 710119
选取哈尔滨地区空间位置构成三角区域的哈尔滨站、尚志站、通河站三个台站日气象数据:利用统计分析方法研究了厄尔尼诺-南方涛动(ENSO)事件对1955 — 2011年的平均气温、降水量的影响。结果表明:近57年来哈尔滨地区气温以0.32℃·(10a)-1的速率升高,超过全国平均升温值0.26℃·(10a)-1;降水量以-14.21 mm · (10a)-1的速率减少,比全国平均水平减少的更快。小波分析表明:哈尔滨气温变化在30 a的时间尺度上存在4 a和7 a的周期;降水量变化存在24 a的主周期。ENSO暖事件年哈尔滨气温略有升高,降水量略有减少;ENSO冷事件年的气温、降水变化与华北、西北地区不同,气温明显升高,降水明显减少,ENSO冷事件对哈尔滨地区气候影响较大。哈尔滨地区在ENSO冷事件年发生旱灾的可能性更大。本文研究可为哈尔滨地区减少旱涝灾害损失提供指导。
哈尔滨地区;厄尔尼诺-南方涛动;周期规律;气温;降水量;旱涝灾害
虽然强劲的“厄尔尼诺”刚刚过去,但人们对它的关注和恐惧有增无减,因为它的“妹妹”——“拉尼娜”随时会来临(郑飞等,2016)。“厄尔尼诺”和“拉尼娜”统称厄尔尼诺-南方涛动(ENSO)事件,前者发生时从南美沿岸水域到赤道中太平洋海域都会出现暖水现象,且持续的时间从数月到数年不等,为暖事件;后者发生时中东太平洋海表温度长时间、大范围内偏低,与“厄尔尼诺”现象恰好相反,为冷事件(郭建设,2007)。冷事件所造成的影响与暖事件相比要小很多,但一旦发生也会给自然和人类带来巨大的麻烦和困扰。从发现ENSO事件起,科学工作者对它的起因、发生、发展及对全球生态和气候所造成的影响就开始了研究(巢纪平等,2002)。近年来,对ENSO形成的大气物理学运动机制的研究越来越多,在赤道太平洋地区,西部海表温度高于东部,因此西太平洋上空的气压比东太平洋的气压弱,这就会使气流处在非平衡状态,太平洋东部上空的气流下沉,西部气流上旋(Mo et al,2006),东部赤道太平洋的海表附近气流由东向西流,形成了沃克(Walker)环流,通常用作数值模拟来表征ENSO冷暖事件,暖事件对应着沃克环流的减弱,而冷事件对应沃克环流的增强(马双梅和周天军,2014) 。Calvo et al(2010)研究了热带上升流增加的动力学机制,发现热带上升流在ENSO暖事件期间增强,在ENSO冷事件期间减弱。Taschett et al(2014) 运用34个耦合模型预测未来的ENSO事件,发现ENSO的峰值通常出现在12月份前后。张桂香(2012)提出了结合太阳黑子11年周期的峰值与厄尔尼诺的对应关系分析、预报天气、气候的变化趋势。张秀伟和赵景波(2014)研究了近57年来El Niño/La Niña事件对鄂尔多斯高原东缘气候的影响,得出该区ENSO暖事件年易发生旱灾。徐洁等(2015)通过研究厄尔尼诺-拉尼娜现象对新疆气候的影响,发现强厄尔尼诺年极端降水事件增多,且各地区对厄尔尼诺和拉尼娜的响应不同。ENSO对东北地区气候影响研究的文章数量不多,哈尔滨作为典型的温带大陆性季风气候的城市,气候条件容易受海洋和气流影响,但对该地区ENSO研究的文章少有发表,又因哈尔滨是东北的主要粮食生产基地,研究ENSO事件对哈尔滨地区的气温和降水的影响就显得尤为重要,所以本文研究近57年ENSO事件对哈尔滨气温和降水影响不仅有理论意义, 而且对该地区应对气候变化和预防旱涝灾害具有实际意义。
1 研究区概况和资料来源
哈尔滨是黑龙江省会城市,属中温带大陆性季风气候,以平原地形为主,河流支流纵横交错,适合种植粮食作物和经济作物,是东北地区粮食的主要生产地(徐建东,2011)。年平均温度3.3℃,年平均降水量594 mm。冬季寒冷漫长,夏季短暂凉爽,春秋季节气温月际变化明显(刘玉莲等,2003)。本文所使用的数据来自“中国气象数据共享服务网”的哈尔滨站(50953)、尚志站(50968)、通河站(50963)1955 — 2011年的气象资料,包括各年的平均气温、年降水量、气温距平,取三站的平均值代表哈尔滨地区的气候值。ENSO冷暖事件经过统计和当期沃克环流的变化特点得出。冷暖事件的划分采用Trenberth and Hoar(1997)的定义和国家气候中心采用的海温距平指数作为判定依据,旱涝情况则是通过计算降水量距平百分率R值来衡量。
2 结果与分析
2.1 1955年以来ENSO事件发生的时间和强度特征
ENSO是在地球上两种主要动力源(气流和洋流)间的协同和拮抗作用下产生的,即使发生在局部地区,都会影响到全球气候系统(陈奕德等,2005;袁媛等,2016)。国际上对ENSO的监测通常用分区法,有Niño1+2、Niño3、Niño4、NiñoC、NiñoZ五个主要的海温监测区(李晓燕等,2005),由于五个海域面积大小和地理位置不同,使用哪个区域的监测结果作为标准一直是学术界讨论的话题。我国主要以NiñoZ(Niño1+2+3+4)区海表温度距平指数(SSTA)来规定ENSO事件。SSTA≥0.5℃且持续时间长度不少于6个月,中断时间不大于1个月为一次ENSO暖事件,暖事件强度分为5个等级,极弱(1)、弱(1)、中等(2)、强(3)、极强(3);若SSTA≤0.5℃,时长6个月以上,间断不超过1个月则为一次ENSO冷事件,共有5个强度等级,极弱(-1)、弱(-1)、中等(-2)、强(-3)、极强(-3)(孟万忠等,2013)。
查阅文献统计1955 — 2011年间发生的ENSO事件(许武成等,2009)得到表1。观察表中数据,发现ENSO的发生时间不固定,原则上冷暖事件交替发生,但有例外,如1973 — 1976年连续发生2次冷事件,2002 — 2007年连续发生3次暖事件。1955 — 2011年共57年的时间内,ENSO暖事件发生15次,18年为暖事件年,暖事件年发生概率为32%;ENSO冷事件发生了12次,冷事件年共15年,发生概率26%,剩下的24年为正常年(强度等级0),概率为42%。由表1可知,ENSO最强烈的月份多在12月,11月和10月也是ENSO事件的高峰期,这与Taschetto et al(2014)的试验结果高度吻合。全球ENSO事件发生时间间隔最短为1 a,最长达8 a,每次事件持续时间长度不一,近57年来ENSO暖事件跨两个自然年度发生的有11次,占ENSO暖事件总数的73%;跨一个自然年度的仅有1963年、1993年,占总数的13%;跨三个自然年度的情况出现在1968 — 1970年和1986 — 1988年,发生概率13%。同样,ENSO冷事件跨两个年的次数较多,有9次,占75%,跨三年长度的有1970 — 1972年、1974 — 1976年、1998 — 2000年3次,占25%,无跨一个自然年度的情况。综上所述,ENSO冷暖事件发生的时间跨度多为两年。

表1 1955 — 2011年发生的ENSO事件Tab.1 ENSO events during 1955 — 2011
根据表1中ENSO发生的强度等级,绘制图1,x轴下方的点代表ENSO冷事件,y = 0的点为正常年,x轴上方的点代表ENSO暖事件。ENSO事件强度的变化趋势波动较大,主要分为三大阶段,第一段是1976年前,ENSO事件强度较弱,第二段是1976 — 1981年为平静的正常年,之后ENSO事件发生强度较强,与人类活动有着密切的关系。在这57年间,ENSO事件的重现周期最短为2 a,最长为6 a。
2.2 ENSO事件发生的季节特征
根据ENSO事件开始和结束的月份,确定了ENSO事件发生的季节性(表2)。从表2可看出,暖事件多开始于春季,发生概率53%,夏季发生的概率是20%,秋季27%,无在冬季开始的记录,但是暖事件一般在冬季结束,概率达67%。ENSO冷事件易发生在秋季,结束在春季,发生在秋季的可能性为42%,在春季结束的可能性同样为42%。由此可以得出,ENSO冷暖事件主要发生在春秋季节,夏季次之;主要结束在春冬季,夏季次之,该结论与张红英等(2015)对长治市的研究相似。

图1 1955 — 2011年ENSO事件强度Fig.1 Intensity of ENSO events during 1955 — 2011
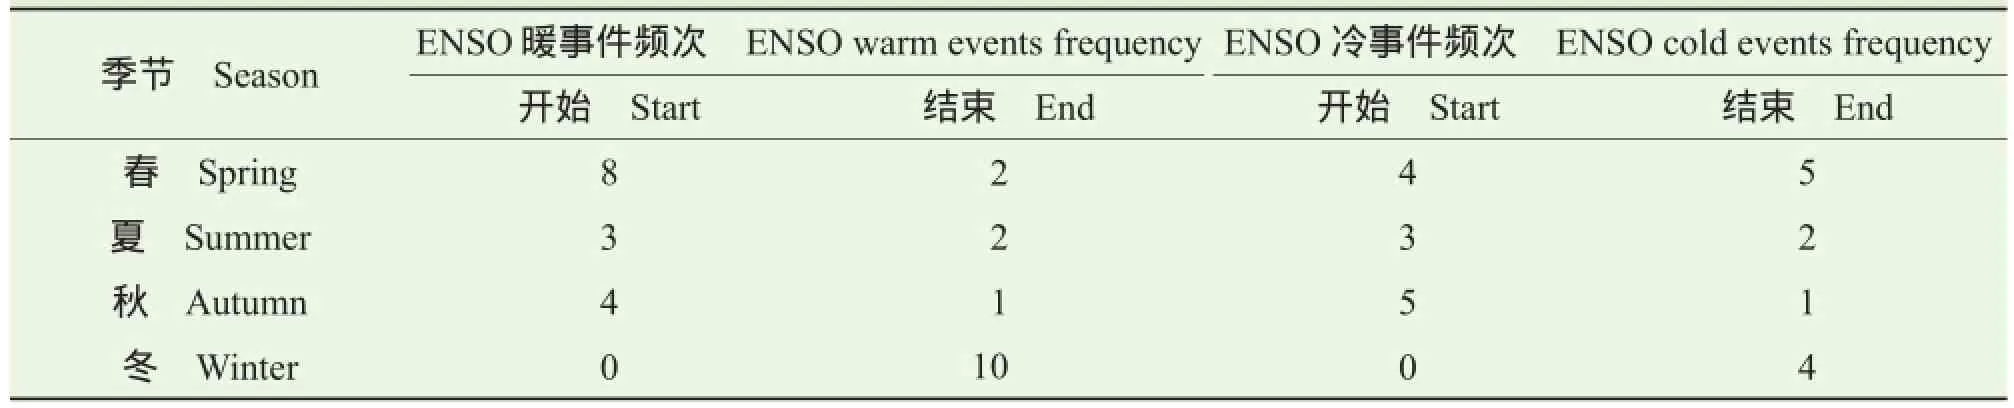
表2 1955 — 2011年ENSO事件开始和结束的季节性频次Tab.2 Seasonal frequency of start and end of ENSO events during 1955 — 2011
2.3 哈尔滨地区气温和降水的变化趋势与周期
ENSO事件发生通常会导致气温和降水异常(何珊珊等,2015;顾薇,2016)。根据1955 — 2011年的年平均气温数据和年均降水量绘制线性趋势图2。图2a为近57年来哈尔滨地区年平均气温变化的趋势,线性拟合得到倾向率为0.32℃·(10a)-1,升温幅度高于全国平均升温值0.26℃·(10a)-1。该区近57年气温波动较大,最低值是1.3℃(1969年),最高值5.4℃(2007年),最大差值达4.1℃。分析图2b可知,年平均降水量波动幅度较小,总体呈下降趋势,并以-14.21 mm · (10a)-1的速率减少。全国近40年来的雨水减少率为-12.69 mm · (10a)-1,该区比全国平均水平减少的更快。2007年出现最低值388.8 mm,1994年有最大值905.3 mm。对比图2a与图2b得知,通常气温出现波峰期时,降水量多出现波谷,明显的有1959年、1967年、1982年、1990年、2007年。而1995年、1998年既高温又多雨,1980年、2000年是低温少雨时年。

图2 1955 — 2011年哈尔滨地区年平均气温和年平均降水量变化Fig.2 Change of annual average temperature and precipitation in Harbin during 1955 — 2011
图3是哈尔滨地区气温距平的Morlet复数小波图和小波方差图。由图3可知,气温周期有明显变化,等值线在10 a左右较短时间尺度上密集,结合小波方差图,小波方差在4 a和7 a的时间尺度下存在极大值,由此可以确定,研究区的气温变化存在4 a和7 a两个主周期。

图3 哈尔滨地区气温变化小波分析Fig.3 Wavelet analysis of temperature change in Harbin
图4 是哈尔滨地区近57年降水量变化小波图。图4显示,在30 a的时间尺度上,降水量有增多 — 减少的变化,可以看出有3 — 4 a、7 — 8 a、24 — 25 a的准周期,从相应的小波方差图看出,有4个波峰,分别是3.3 a、7.5 a、24 a、26 a,因此,可判断哈尔滨地区降水量变化存在24 a的第Ⅰ主周期,3.3 a和7.5 a的第Ⅱ主周期。

图4 哈尔滨地区降水量变化小波分析Fig.4 Wavelet analysis of precipitation change in Harbin
3 讨论
3.1 ENSO事件与哈尔滨地区气温的关系
太平洋地区的海气间作用,对整个大气圈和海洋圈产生了深刻影响,同时远程影响东亚的气候变化(Wang et al,2000)。 为了清楚地呈现ENSO事件对该地区气温变化的影响,绘制了1955 — 2011年ENSO冷、暖事件与历年气温距平值的关系图(图5)。从图5分析得知,57年中包括ENSO暖事件年、正常年、ENSO冷事件年。排列组合出6个时间区域,A为暖事件年,B为暖事件年+正常年,C为暖事件年+正常年+冷事件年,D为正常年,E为正常年+冷事件年,F为冷事件年。对于A区域,18年间气温正距平11次,负距平7次;B区域,气温正距平23次,负距平19次;C区域,气温正距平30次,负距平27次;D区域,气温正距平12次,负距12次;E区域,气温正距平19次,负距平20次;F区域,正距平7次,负距平8次。1955年以来,哈尔滨地区的平均温度3.26℃,正常年的平均温度为3.25℃,低于57年平均温度0.01℃。暖事件年的平均温度3.29℃,高出正常年0.04℃。冷事件年的平均温度为3.34℃,高出正常年0.09℃。表明ENSO冷暖事件均会使哈尔滨地区气温有所升高,冷事件对升温的贡献更加显著。该结论与山西省南部地区冷事件年易发生涝灾不同,说明ENSO事件对气候的影响有地域性差别。

图5 1955 — 2011年间平均气温距平与ENSO事件的关系Fig.5 Relationship between average temperature anomaly and ENSO events during 1955 — 2011
3.2 ENSO事件与哈尔滨地区降水量的关系
ENSO事件对不同地区的降水存在不同程度的影响(Nerem et al,1999;袁媛等,2012),为了研究ENSO事件对哈尔滨地区降水量的影响,绘制图6。图6表明该区降水量负距平多于正距平,表明近57年来降水量减少。在18 年暖事件年间,降水量正距平有10次,发生率56%,负距平发生率44%。在24年正常年份(无ENSO年)间,降水量正距平有11次,负距平13次,负距平发生率较高,为54%;在15年冷事件年间,降水量正距平出现5次,负距平10次(发生率67%)。57年来平均降水量为590.2 mm,正常年年均降水594.3 mm,高出平均值4.1 mm。暖事件年时年均降水量588.0 mm,低于平均水平2.2 mm。冷事件年发生年间降水均量为576.9 mm,低于平均水平13.3 mm。结果表明ENSO冷暖事件均使哈尔滨地区降水量减少,冷事件年减少更大。
3.3 ENSO事件与哈尔滨地区旱涝灾害关系
ENSO事件的发生与气候灾害中的旱涝灾害关系密切(姚辉和李栋梁,1992),找到二者之间的规律,对旱涝灾害的预测有所帮助。对于旱涝等级的划分,本文选择了降水距平百分率法(王殿武等,2011),由于该法具有资料易得,计算简单,结果符合实际的优点,被定为国家气候中心和《中国旱涝气候公报》衡量旱涝的主要指标(表3)。该指标反映了某时段降水量相对于同期平均状态的偏离程度,计算公式如下:


图6 1955 — 2011年间平均降水量距平与ENSO事件的关系Fig.6 Relationship between average precipitation anomaly and ENSO events during 1955 — 2011

表3 降水距平百分率的旱涝等级(王殿武等,2011)Tab.3 Precipitation anomaly percentage of drought and fl ood level (Wang et al, 2011)
以1955 — 2011降水量的平均值590.2 mm为基准,根据公式计算各年的降水距平百分比,并绘出曲线图(图7)。1994年降水正距平百分率53.4%,为57年来的降水正距平百分率最高值,2007年负距平百分率达到34.1%,是异常少雨年。两条虚线分别是y = 25%和y = -25%,按照旱涝等级分类标准,两线间的点为正常年份,其余年份均为不同程度的旱涝灾害,与ENSO冷暖事件的关系列于表4。

图7 哈尔滨地区1955 — 2011年降水量距平百分率Fig.7 Precipitation anomaly percentage in Harbin during 1955 — 2011
从表4分析得知,哈尔滨地区近57年来发生4次偏涝,1次大涝,发生涝灾的概率为8.8%。旱灾共发生7次且均是偏旱,发生概率12.3%,哈尔滨倾向于发生旱灾,这与哈尔滨气温增暖和降水减少有关。涝灾年份出现ENSO暖事件的概率为40%,出现ENSO冷事件的概率为20%;出现的7次旱灾中,有3年出现在ENSO冷事件年,1年出现在ENSO暖事件年。旱灾年份出现在ENSO冷事件年的概率为42.9%,出现在暖事件年的概率为14.3%。由此可见,ENSO暖事件年出现涝灾的可能性大,ENSO冷事件年出现旱灾的可能性大。这一认识对哈尔滨地区预防和减少旱涝灾害损失具有重要的指导意义。

表4 1955 — 2011年ENSO事件与哈尔滨地区旱涝灾害的对应关系Tab.4 Corresponding relation between ENSO events and drought and fl ood disasters in Harbin during 1955 — 2011
4 结论
综上所述,可以得出如下结论:
(1)1955 — 2011年,哈尔滨地区气温以0.32℃ · (10a)-1的速率升高,超过全国平均升温值0.26℃ · (10a)-1。该地区降水量以-14.21 mm · (10a)-1的速率减少,比全国近40年的平均水平-12.69 mm · (10a)-1减少的更快。
(2)小波分析显示,在30 a的时间尺度上,哈尔滨地区近57年的气温变化存在4 a和7 a的周期,降水量存在24 a的第Ⅰ主周期,3.3 a和7.5 a的第Ⅱ主周期。
(3)1955年以来,哈尔滨地区的平均温度3.26℃,无ENSO年的平均温度为3.25℃,低于57年平均温度0.01℃。暖事件年的平均温度3.29℃,高出无ENSO年0.04℃。冷事件年的平均温度为3.34℃,高出正常年0.09℃。表明冷事件年时哈尔滨地区增温显著,趋于暖化。
(4)57年来平均降水量为590.2 mm,正常年时年均降水594.3 mm,高出平均值4.1 mm。暖事件年时年均降水量588.0 mm,低于平均水平2.2 mm。冷事件年发生年间降水均量为576.9 mm,低于平均水平13.3 mm。表明冷事件年时哈尔滨地区降水减少,趋于干化。
老庄思想主张“不谴是非”、“知足逍遥”、“独与天地精神相往来”,反复强调虚静之心。而山水林泉作为大自然的一部分,极其符合清静自然的理念。因此,当时的社会风潮乃崇尚老庄,而归于山林。当时的名士“登山临水,竟日忘归”,这样的记载数不胜数。这种离尘出世,隐匿山林的无为思想正是传统山水画中避世主义的直接来源。
(5)ENSO冷事件对哈尔滨气候影响显著,使该地区气候向暖干化趋势发展。冷事件会使哈尔滨地区出现旱灾的可能性增大。该结论与对山西省南部地区气候影响中冷事件年易发生涝灾相反,说明ENSO事件对不同地区的影响存在很大差异。
巢纪平, 袁绍宇, 巢清尘, 等. 2002. 厄尔尼诺和拉尼娜事件循环演变过程的资料分析研究[J]. 大气科学进展, 19(5): 837 – 844. [Chao J P, Yuan S Y, Chao Q C, et al. 2002. A data analysis study on the evolution of the El Niño/La Niña cycle [J]. Advances in Atmospheric Sciences, 19(5): 837 – 844.]
陈奕德, 张 韧, 蒋国荣. 2005. 近年来国内ENSO研究概述[J]. 热带气象学报, 21(6): 634 – 641. [Chen Y D, Zhang R, Jiang G R. 2005. Summary of Chinese research on ENSO in recent years [J]. Journal of Tropical Meteorology, 21(6): 634 – 641.]
顾 薇. 2016. 夏季热带西太平洋海温对厄尔尼诺发展阶段我国东部汛期降水的影响分析[J]. 气象, 42(5): 548 – 556. [Gu W. 2016. Possible impact of the western tropical Pacifi c SSTA on precipitation during the El Niño developing summers in the eastern part of China [J]. Meteorology Monthly, 42(5): 548 – 556.]
郭建设. 2007. 解析厄尔尼诺和拉尼娜现象[J]. 地球, (5): 16. [Guo J S. 2007. Analyze the phenomenon of El Niño and La Niña [J]. Earth, (5): 16.]
何珊珊, 张文君, 祁 莉, 等. 2015. 两类厄尔尼诺事件发展年秋季印度洋海温异常特征对比[J]. 气象学报, (3): 515 – 528. [He S S, Zhang W J, Qi L, et al. 2015. Contrasting SST anomalies over the Indian Ocean between the two types of El Niño events during boreal autumn [J]. Journal of Meteorological Research, (3): 515 – 528.]
李晓燕, 翟盘茂, 任福民. 2005. 气候标准值改变对ENSO事件划分的影响[J]. 热带气象学报, 21(1): 72 – 78. [Li X Y, Zhai P M, Ren F M. 2005. Redefi ng ENSO episodes based on changed climate references [J]. Journal of Tropical Meteorology, 21(1): 72 – 78.]
刘玉莲, 周海龙, 苍蕴琦. 2003. 四季分明是哈尔滨气候的显著特征[J]. 黑龙江气象, (4): 21. [Liu Y L, Zhou H L, Cang Y Q. 2003. Clearly four seasons is the marked climate characteristics of Harbin [J]. Heilongjiang Meteorology, (4): 21.]
马双梅, 周天军. 2014. 热带太平洋沃克环流变化的数值模拟[J]. 中国科学:地球科学, 44(11): 2576 – 2592. [Ma S M, Zhou T J. 2014. Changes of the tropical Pacifi c Walker circulation simulated by two versions of FGOALS model [J]. Science China: Earth Sciences, 44(11): 2576 – 2592.]
孟万忠, 王尚义, 赵景波. 2013. ENSO事件与山西气候的关系[J]. 中国沙漠, 33(1): 258 – 264. [Meng W Z, Wang S Y, Zhao J B. 2013. Relationship between ENSO events and the climate during 1955—2008 in Shanxi, China [J]. Journal of Desert Research, 33(1): 258 – 264.]
王殿武, 迟道才, 梁凤国, 等. 2011. 区域旱涝特征分析及灾害预测技术研究[M]. 北京:中国水利水电出版社. [Wang D W, Chi D C, Liang F G, et al. 2011. Regional drought and flood characteristics analysis and hazard prediction technology research [M]. Beijing: China Water & Power Press.]
徐建东. 2011. “全国粮食生产先进县”近五分之一来自哈尔滨[J]. 中国老区建设, (3): 45 – 45. [Xu J D. 2011. Nearly one fi fth of “The national grain production counties” is from Harbin [J]. China’s Construction of Old Revolutionary Basic Area, (3): 45 – 45. ]
徐 洁, 张新军, 王 舒, 等. 2015. 厄尔尼诺-拉尼娜事件对新疆环境气候的影响研究[J]. 环境科学与管理, 40(10): 22 – 26. [Xu J, Zhang X J, Wang S.et al. 2015. Infl uence of El Niño/La Niña events on climate of Xinjiang [J]. Environmental Science and Management, 40(10): 22 – 26.]
许武成, 王 文, 马劲松, 等. 2009. 1951—2007年的ENSO事件及其特征值[J]. 自然灾害学报, 18(4): 18 – 24. [Xu W C, Wang W, Ma J S, et al. 2009. ENSO events during 1951—2007 and their characteristic indices [J]. Journal of Natural Disasters, 18(4): 18 – 24.]
姚 辉, 李栋梁. 1992. 厄尔尼诺事件与中国降水及历史旱涝[J]. 应用气象学报, (2): 228 – 234. [Yao H, Li D L. 1992. The relationship between El Niño events and the rainfall, historical drought and waterlogging in China [J]. Quarterly Journal of Applied Meteorology, (2): 228 – 234.]
袁 媛, 高 辉, 贾小龙, 等. 2016. 2014—2016年超强厄尔尼诺事件的气候影响[J]. 气象, 42(5): 532 – 539. [Yuan Y, Gao H, Jia X L, et al. 2016. Infl uences of the 2014—2016 super El Niño event on climate [J]. Meteorological Monthly, 42(5): 532 – 539.]
袁 媛, 杨 辉, 李崇银. 2012. 不同分布型厄尔尼诺事件及对中国次年夏季降水的可能影响[J]. 气象学报, 70(3): 467 – 478. [Yuan Y, Yang H, Li C Y. 2012. Study of El Niño events of different types and their potential impact on the following summer precipitation in China [J]. Journal of Meteorological Research, 70(3): 467 – 478.]
张桂香. 2012. 厄尔尼诺现象年与近年河北省气候变化的关系[J]. 现代农业科技, (1): 18. [Zhang G X. 2012. The relation between El Niño years and recent climate change in Hebei province [J]. Modern Agricultural Science and Technology, (1): 18.]
张红英, 吴素芬, 李菊芬, 等. 2015. 厄尔尼诺/拉尼娜事件变化特征及与长治气候的关系[J]. 中国农学通报, 31(15): 247 – 253. [Zhang H Y, Wu S F, Li J F, et al. 2015.Variation characteristics of El Niño/La Niña events and their relationship with climate in Changzhi [J]. Chinese Agricultural Science Bulletin, 31(15): 247 – 253.]
张秀伟, 赵景波. 2014. 近57年来El Niño/La Niña事件对鄂尔多斯高原东缘气候的影响[J]. 山西师范大学学报(自然科学版), 28(1): 95 – 102. [Zhang X W, Zhao J B. 2014. Effects of El Niño/La Niña events on climate of eastern edge of the Erdos Plateau in recent 57 years [J]. Journal of Shanxi Normal University (Natural Science Edition), 28(1): 95 – 102.]
郑 飞, 朱 江, 张荣华, 等. 2016. 2015年超级厄尔尼诺事件的成功预报[J]. 中国科学院院刊, 31(2): 251 – 257. [Zheng F, Zhu J, Zhang R H, et al. 2016. Successful prediction for the super El Niño event in 2015 [J]. Bulletin of Chinese Academy of Sciences, 31(2): 251 – 257.]
Calvo N, Garcia R R, Randel W J, et al. 2010. Dynamical mechanism for the increase in tropical upwelling in the lowermost tropical stratosphere during warm ENSO events [J]. Journal of the Atmospheric Sciences, 67(7): 2331 – 2340.
Mo J Q, Lin W T, Zhu J. 2006. A variational iteration method for studying the ENSO mechanism [J]. Progress in Natural Science, 14(12): 1126 – 1128.
Nerem R S, Chambers D P, Leuliette E W, et al. 1999. Variations in global mean sea level associated with the 1997—1998 ENSO event: Implications for measuring long term sea level change [J]. Geophysical Research Letters, 26(19): 3005 – 3008.
Taschetto A S, Gupta A S, Jourdain N C, et al. 2014. Cold tongue and warm pool ENSO events in CMIP5: Mean state and future projections [J]. Journal of Climate, 27(8): 2861 – 2885.
Trenberth K E, Hoar T J. 1997. El Niño and climate change [J]. Geophysical Research Letters, 24(23): 3057–3060.
Wang B, Wu R, Fu X. 2000. Pacifi c-East Asian teleconnection: How does ENSO affect East Asian climate? [J]. Journal of Climate, 13(9): 1517 – 1536.
Infl uence of El Niño-Southern Oscillation events on climate in Harbin region during 1955 — 2011
LIU Dan, ZHAO Jingbo
College of Tourism and Environment, Shaanxi Normal University, Xi’an 710119, China
Background, aim, and scope Facing the high frequency of El Niño-Southern Oscillation (ENSO) events appear in recent years, global climates change strongly, especially in northern hemisphere. Temperature and precipitation levels in ENSO warm (cold) year are more different from the normal year, causing serious fl ood and drought problems, great loss in people’s daily life, industrial and agricultural production. For avoiding and solving such problems, people should fi gure out the happening mechanism of ENSO events, also the characteristics, trend and cycle, also the physical mechanism between ocean and air, so that people can predict it exactly someday. Harbin is the capital of Heilongjiang province, belongs to temperate continental monsoon climate, plain topography, abundant water resources. So Harbin becomes the mainly food production area in the northeast of China, certainly worth to be researched. Materials and methods Select the daily meteorological data from 1955 — 2011 of Harbin station, Shangzhi station, Tonghe stationforming a triangle in Harbin region. Including the average temperature, the annual precipitation, the temperature anomaly of each year. Average values of the three stations represent the climate values of Harbin region. Time table of ENSO events is statistics of the references, take the defi nition of Kevin E Trenberth and sea surface temperature anomalies of the National Climate Center as the division basis of the cold and warm events. Calculating the precipitation anomaly percentage (R) to measure the drought and fl ood level. Using the linear trend method, anomaly and comparative method, Morlet wavelet analysis to analyze. Results During 1955 — 2011, among the 57 a, 2 a is the minimum of ENSO events reappear cycle, 6 a is the maximum. ENSO cold and warm events mainly happened in spring and autumn season, ended in spring and winter season. In recent 57 a, annual precipitation fluctuates little, while overall in the decline. Precipitation has a 24 a main cycle variation, 3.3 a and 7.5 a second cycle variation. Annual temperature change is in the opposite trend of precipitation, but has 4 a and 7 a main cycle variation. Discussion From the relationship between average temperature anomaly and ENSO events during 1955 — 2011, ENSO cold and warm events both can increase the temperature in Harbin region, cold events have obvious infl uence. From the relationship between average precipitation anomaly and ENSO events during 1955 — 2011, ENSO cold and warm events both can decrease the precipitation in Harbin region, similarly cold events have greater influence. From the corresponding relation between ENSO events and drought and fl ood disasters in Harbin during 1955 — 2011, we know that, when in ENSO warm event year, Harbin is in the high rate of fl ood; when in the cold event year, the region has a great possibility of drought. Conclusions The temperature in Harbin region has risen in a rate of 0.32℃·(10a)-1in recent 57 years, more than the national average in a rate of 0.26℃·(10a)-1; precipitation has a reduction in a rate of -14.21 mm ·(10a)-1, faster than the national reduction. The wavelet analysis shows that the temperature change of Harbin has 4 a and 7 a cycle in 30a’ time-scale; precipitation change has a 24 a main cycle, and 3.3 a, 7.5 a second main cycle. Since 1955, the average temperature of Harbin region is 3.26℃, 3.25℃ without ENSO events happened, the average temperature of warm event years is 3.29℃, the average temperature of cold event years is 3.34℃, shows that Harbin region in cold event years, temperature increases obviously. In the 57 a, the average precipitation is 590.2 mm, average precipitation of normal years (without ENSO) is 594.3 mm, average 588.0 mm in warm event years, average 576.9 mm in cold event years, all shows that precipitation reduces in cold event years. All in all, warm ENSO events year, temperature has a slight rise, while precipitation has a slight reduction in Harbin. In cold ENSO events year, it’s different from North China and Northwest region, temperature has an obvious rise, precipitation has an obvious reduction, cold ENSO events have a great infl uence on the climate in Harbin. Drought easily happens in cold ENSO events year in Harbin region. Recommendations and perspectives This paper can provide guidance for reducing the loss of drought and fl ood in Harbin. The research results can contribute to the Harbin climate managements. In the future, climate problems should be set in a higher position, everyone should attach great importance to this issue.
Harbin region; El Niño-Southern Oscillation; cycle regulation; temperature; precipitation; drought and fl ood disasters
ZHAO Jingbo, E-mail: zhaojb@snnu.edu.cn
2016-09-30;录用日期:2016-11-28
Received Date: 2016-09-30; Accepted Date: 2016-11-28
国家自然科学基金项目(40672108);黄土与第四纪地质国家重点实验室开放基金项目(SKLLQG1428)
Foundation Item: National Natural Science Foundation of China (40672108); Project of State Key Laboratory of Loess and Quaternary Geology, Institute of Earth Environment, Chinese Academy of Sciences (SKLLQG1428)
赵景波,E-mail: zhaojb@snnu.edu.cn
刘 丹, 赵景波. 2017. 近57年厄尔尼诺-南方涛动事件对哈尔滨地区气候的影响 [J]. 地球环境学报, 8(2): 137 – 147.
: Liu D, Zhao J B. 2017. Infl uence of El Niño-Southern Oscillation events on climate in Harbin region during 1955 — 2011 [J]. Journal of Earth Environment, 8(2): 137 – 147.
