Comparison of blood rheological models in patient specific cardiovascular system simulations*
2017-04-26AnastasiosSkiadopoulosPanagiotisNeofytouChristosHousiadas
Anastasios Skiadopoulos, Panagiotis Neofytou, Christos Housiadas
Thermal Hydraulics and Multiphase Flows Laboratory, I.N.RA.S.T.E.S, N.C.S.R. “Demokritos”, Agia Paraskevi, Greece, E-mail:tskiado@ipta.demokritos.gr
Comparison of blood rheological models in patient specific cardiovascular system simulations*
Anastasios Skiadopoulos, Panagiotis Neofytou, Christos Housiadas
Thermal Hydraulics and Multiphase Flows Laboratory, I.N.RA.S.T.E.S, N.C.S.R. “Demokritos”, Agia Paraskevi, Greece, E-mail:tskiado@ipta.demokritos.gr
Newtonian, Quemada and Casson blood viscosity models are implemented in order to simulate the rheological behavior of blood under pulsating flow conditions in a patient specific iliac bifurcation. The influence of the applied blood constitutive equations is monitored via the wall shear stress (WSS) distribution, magnitude and oscillations, non-Newtonian importance factors, and viscosity values according to the shear rate. The distribution of WSS on the vascular wall follows a pattern which is independent of the rheological model chosen. On the other hand, the WSS magnitude and oscillations are directly related to the blood constitutive equations applied and the shear rate. It is concluded that the Newtonian approximation is satisfactory only in high shear and flow rates. Moreover, the Newtonian model seems to overestimate the possibility for the formation of atherosclerotic lesions or aneurysms at sites of the vascular wall where the WSS are oscillating.
Blood flow simulation, patient specific geometries, geometry reconstruction, non-Newtonian models, wall shear stress, pulsating flow
Introduction
Blood flow in the cardiovascular system induces forces and stresses on the walls of the vessels which are closely related to the onset and localization of various diseases. Regions where low and oscillatory wall shear stresses developed are susceptible to the formation of atherosclerotic lesions[1,2]. This behavior is attributed to the non-uniformity of the vascular wall permeability. It has been experimentally validated that the vascular wall permeability is directly related to the amplitude of the oscillatory shear stresses. Other experiments have proved that if the wall shear stresses are raised to high values for a short time, the endothelial surface can be damaged irreversibly. Furthermore, there is evidence that oscillating shear stresses on the arterial wall are related to the development and rupture risk of aortic aneurysms.
Computational fluid dynamics (CFD) is widely applied for the simulation of blood flow in the cardiovascular system due to its non-intrusive nature. Commonly, blood is considered as a Newtonian fluid and vessels are idealized representations of the actual geometries. The geometry of vessels plays a decisive role in the development of the flow field and the stresses on the wall[3-5]. It is documented in the literature that atherosclerotic lesions tend to localize in areas where the geometry is complicated, such as branches and bifurcations[6-8], since blood flow is disturbed and not fully developed. This flow pattern results in non-uniform distribution of low magnitude wall shear stress at the vascular wall[6].
The Newtonian fluid approximation has been traditionally used in blood flow simulations in the cardiovascular system. However, it is documented in the literature that blood behaves differently at low flow rates. During the cardiac cycle, recirculation zones are formed in medium sized arteries of the cardiovascular system because of the flow deceleration. The existence of recirculation zone leads to oscillations of the WSS. The vascular walls where oscillations of the WSS occur are more prone to the formation of atherosclerotic lesions[7]and the formation and rupture risk of aneurysms[9,10]. The intensity of the recirculation zones and the magnitude of the WSS are closely related to the rheological behavior of blood. The value of WSSinfluences the endothelial permeability[11], whereas the exposure of the endothelial cells to low and oscillating values of WSS leads to the formation of atherosclerotic lesions[12].
In the present study the influence of the geometry complexities and the blood constitutive equations on the magnitude and oscillation of WSS in patient specific blood flow simulations, and the viscous behavior of blood are investigated. For this purpose, an iliac bifurcation was reconstructed from medical images. The specific geometry was selected, because the infrarenal abdominal aorta experiences reversed flow, and consequently oscillations of the WSS. It is well known that as the shear rate in large straight arteries is usually bigger than 200 s−1, Newtonian fluid flow can be an approximation to the non-Newtonian pulsatile blood flow. However, this would not be true in an arterial bifurcation where the mean value of oscillatory shear stress could be around 0 Pa. The blood viscosity models applied are the Newtonian, Quemada[13]and Casson[14]. A flow pulse is imposed at the inlet of the parent vessel of a patient specific iliac bifurcation for a time period of 0.8s, which corresponds to normal breathing conditions. The results obtained from the different rheological models are compared based on global and local non-Newtonian importance factors and values and oscillations of WSS and the validity of the Newtonian fluid approximation is assessed according to the shear rate.
The goal of this study is to identify areas of the vascular wall where oscillations of the WSS occur and to quantify the differences in WSS values at sites of maximum oscillations. The proposed methodology is a non-invasive computational tool which can be used by clinicians in order to identify patient specific needs and apply patient specific therapy. The computational experiments reveal that there are significant differences in the WSS values between the three models, albeit a consistent WSS distribution pattern is present regardless of the model applied. The differences are more important at low flow rates indicating that the Newtonian model should be applied cautiously in patient specific blood flow simulations. The Newtonian model predicts a wider area of WSS oscillations on the vascular wall and calculates the lowest WSS values at sites of maximum oscillations.
1. Patient specific geometry reconstruction
The first step in the methodology presented in this study is the reconstruction of the original 3-D patient specific geometry from medical examinations via an in-house code[15]. The algorithm reconstructs the original geometry and generates a multi-block structured grid that conforms to it. The medical data are acquired in digital imaging and communications in medicine (DICOM) format. The geometry reconstruction process consists of the following steps:
(1) Acquisition of the medical imaging data, image segmentation, extraction of the volume of interest (VOI) and creation of a 3-D triangulated surface in STereoLithography (STL) format which represents the actual geometry.
(2) Partition of the triangulated surface in geometry domains where the grid generation methodology works efficiently.
(3) Generation of a multi-block surface structured grid over the triangulated surface.
(4) Generation of the volume grid. Grid enhancement by an in house grid enhancement code.
Geometrical reconstruction from DICOM data sets is considered to be a routine task today and is utilized by open source or proprietary software. In this study, the highly efficient and reliable open source software 3DSlicer®[16]was used to reconstruct a patient specific iliac bifurcation from computed tomography (CT) data. The reconstructed geometry is depicted in Fig.1.
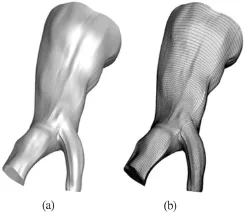
Fig.1 View of the reconstructed surface (a) and the structured mesh (b)
2. Model equations
The model equations are the governing equations of the flow field supplemented by the constitutive equations of the blood.
2.1Governing equations
The physical problem is governed by the Navier-Stokes equations

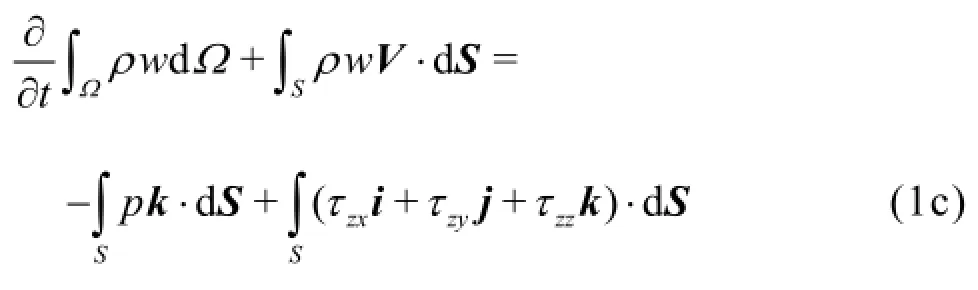
and the mass continuity equation

2.2Blood models

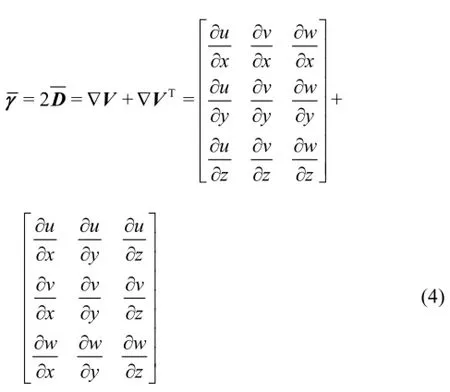
Thus, Eq.(3) can also be written in the tensorial form


In the present study three blood models are used, namely the Newtonian, Quemada[13]and Casson[14]. In the Newtonian model, the molecular viscosity coefficient is constant and Eq.(3) can be applied in a straightforward manner. On the other hand, for non-Newtonian fluids any constitutive equation should first be written in the form of

and then it can be expressed in the tensorial form

In the Quemada model, the effective viscosity is calculated by the formula

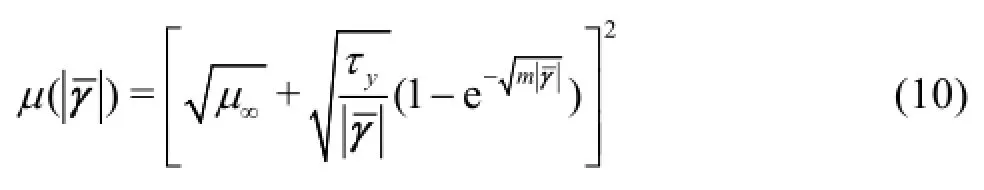
whereas for the Casson model the effective viscosity is calculated by
3. Numerical modelling
The mass continuity and Navier-Stokes equations are solved numerically using a parallel in-house CFD code[17,18]. The algorithm applies the geometric full multigrid (FMG) method. The code employs the semiimplicit method for pressure linked equations (SIMPLE) algorithm in conjunction with a finite-volu-me method (FVM) on multi-block, collocated, bodyfitted 3-D grids, where grid non-orthogonality is taken into account. The Navier-Stokes equations are discretized using a first-order forward Euler scheme for the time dependent term, a third-order QUICK scheme for the convective term and a central difference scheme (CDS) of second-order for the diffusion (viscous) term, whereas the pressure term is treated as source[19].
The flow solver is parallelized via a domain decomposition technique which is based on the additive Schwarz method. Communication between processes is accomplished through the message passing interface (MPI) message passing system, due to its high communication performance and portability. The FMG technique is applied in order to enhance the efficiency of the SIMPLE algorithm through the acceleration of the outer relaxation iterations.
TheWSS acting on the arterial wall is calculated by
In order to quantify the variation of the WSS on the arterial wall, the area averaged WSS (AAWSS) variable is used. It is calculated by the formula

The area averaged shear rate (AASR) is used as a measure of the average shear rate on the arterial wall interface. It is calculated by the equation

The divergence of the applied non-Newtonian model from the Newtonian, in terms of blood viscosity, is quantified by the global non-Newtonian importance factorThis factor is a measure of the average divergence of the effective viscosity calculated by the non-Newtonian blood model from the constant viscosity of the Newtonian. It is calculated by

The local non-Newtonian importance factoris a means of indicating areas of the flow field where the fluid behaves as non-Newtonian and it is calculated by the formula

The total WSS exerted on a node of the arterial wall over the entire cardiac cycle is evaluated by the time averaged WSS (TAWSS)

The oscillating shear index (OSI) is used as a means of determining the amplitude of the oscillations of the WSS on the arterial wall. It is calculated by
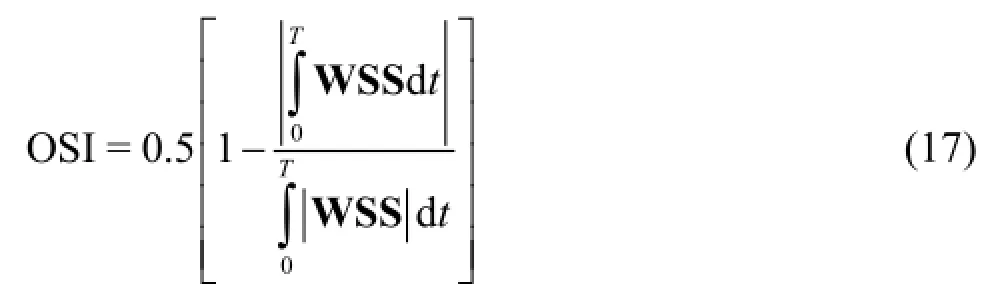

Fig.2 Velocity waveform at the inlet
4. Numerical experiments
4.1Boundary conditions
A time varying parabolic velocity profile is applied at the inlet of the parent vessel of the iliac bifur-cation for a typical cardiac cycle of 0.8 s, which corresponds to normal breathing conditions. Due to lack of clinical data, typical flowrates corresponding to the specific segment of the cardiovascular system were applied at the inlet. In Fig.2 the velocity at the inlet of the iliac artery is plotted versus time.
The vessel walls are considered rigid tubes and the no-slip boundary condition at the walls is applied when solving the Navier-Stokes equations. At the bifurcation branches outlets, a predefined flow rate boundary condition is applied. At each time instance, the outflow rate of each branch is calculated as a fraction of the inflow based on the outlet area.
4.2 Hemodynamic parameters
For all the models applied, the density of blood is assumed to beThe value of the asymptotic effective viscosity of blood in the performed numerical simulations is
For the Quemada model, the value of the plasma viscosityPa·s and the haematocrit isThe values of the model parameters arecorresponding to the selected value of the haematocrit[13].
For the Casson model, the value ofis taken to be 100, whereas the yield stressis 10.82 mPa[14].
4.3 Similarity numbers
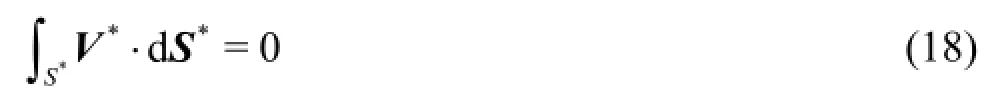
The governing Eqs.(1) and (2) are numerically solved in dimensionless form. Velocities are normalized by the peak systolic velocityand spatial coordinates are normalized by the diameterof the parent vessel. Time is normalized by the periodof the cardiac cycle and pressure is normalized by the dynamic pressureHereafter, the dimensionless quantities are marked with an asterisk
Based on the quantities utilized for the normalization, the non-dimensional expression of the continuity equation is
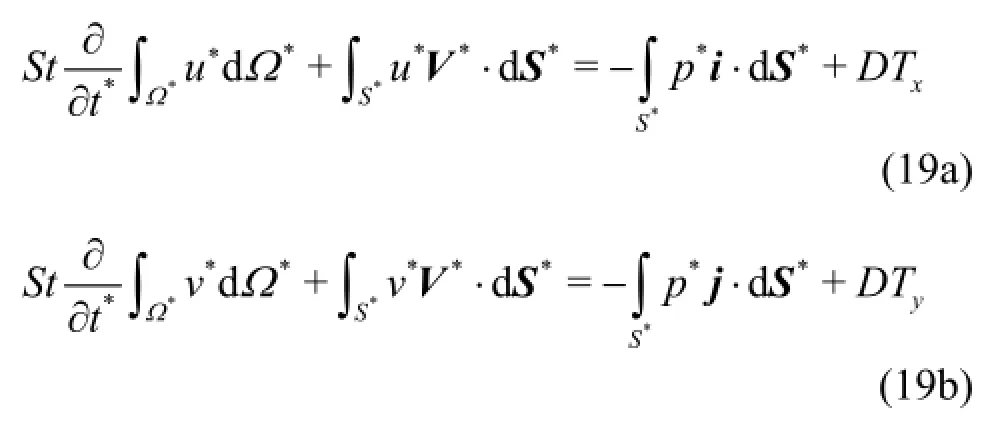
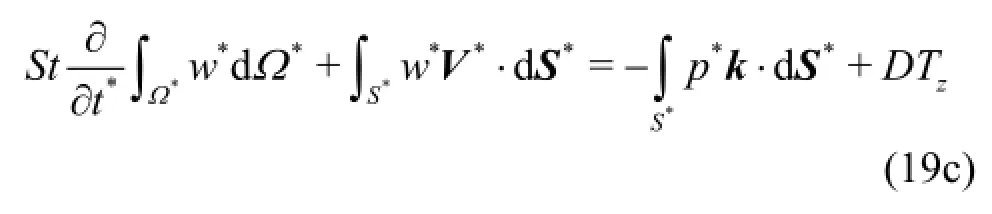
The normalized expression of the Navier-Stokes equations is

and it takes the value of 1.097×10⁻¹.
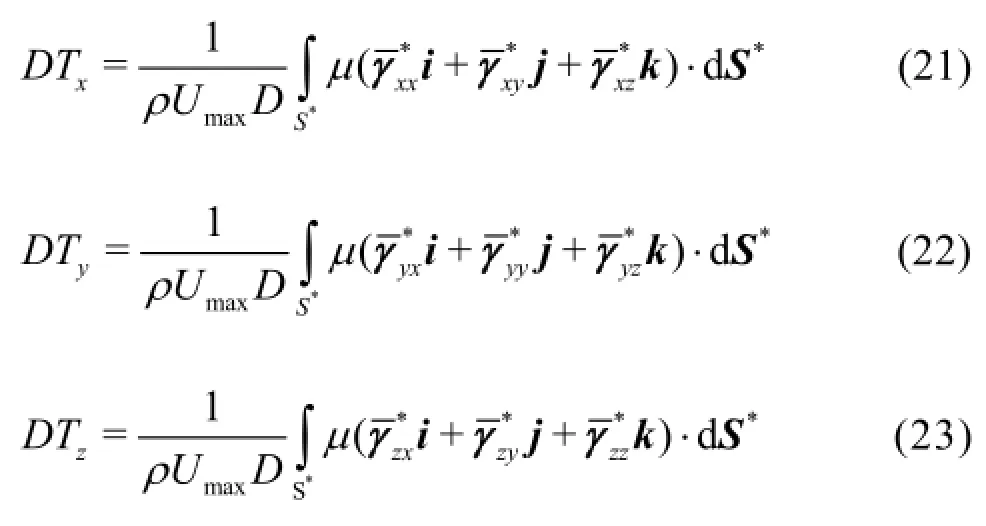

In general, the effective viscosity can be decomposed into a product of a constant, say, and a function ofso that

After substituting Eq.(25) into Eqs.(21)-(23), a nondimensional numbersimilar to a Reynolds number, appears in front of the non-dimensional diffusion terms[21]. This similarity number is calculated by
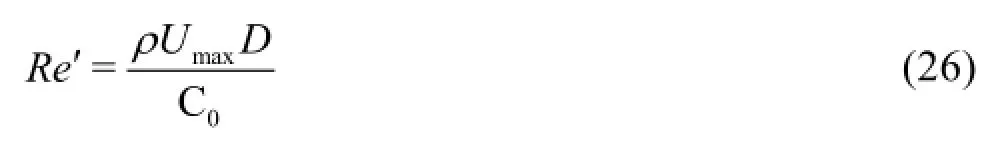
For the Newtonian fluid, the molecular viscosity isconstant and, consequently,In this case,is equal to the Reynolds number. The value of Reynolds number for the specific case is 270.
In the case of the Quemada model, the dimensionless expression of Eq.(9) is
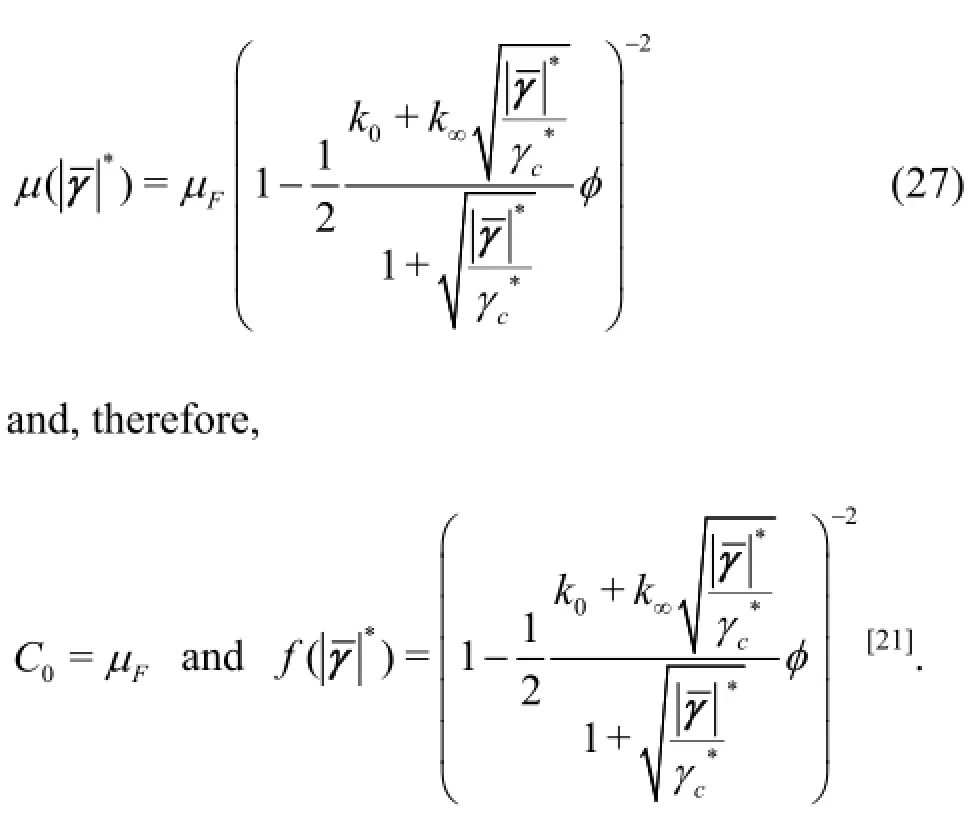
Thus, for the Quemada model the similarity numberreferred to asis calculated by
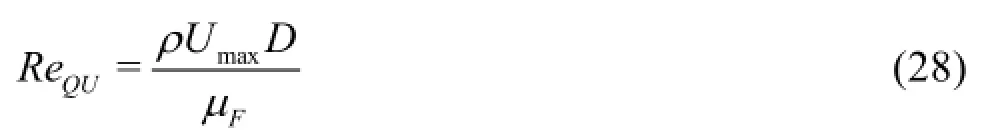
Based on the selected hemodynamic parameters, the value offor the performed numerical experiments is 900.
For the Casson model, the dimensionless form of Eq.(10) is


Fig.3 WSS distribution on the arterial wall at peak systolic velocity for the Newtonian model. Front and rear view
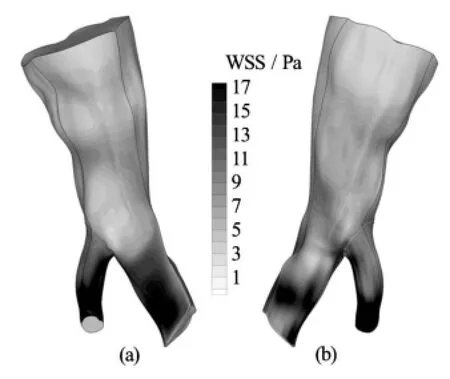
Fig.4 WSS distribution on the arterial wall at peak systolic velocity for the Quemada model. Front and rear view

Fig.5 WSS distribution on the arterial wall at peak systolic velocity for the Casson model. Front and rear view
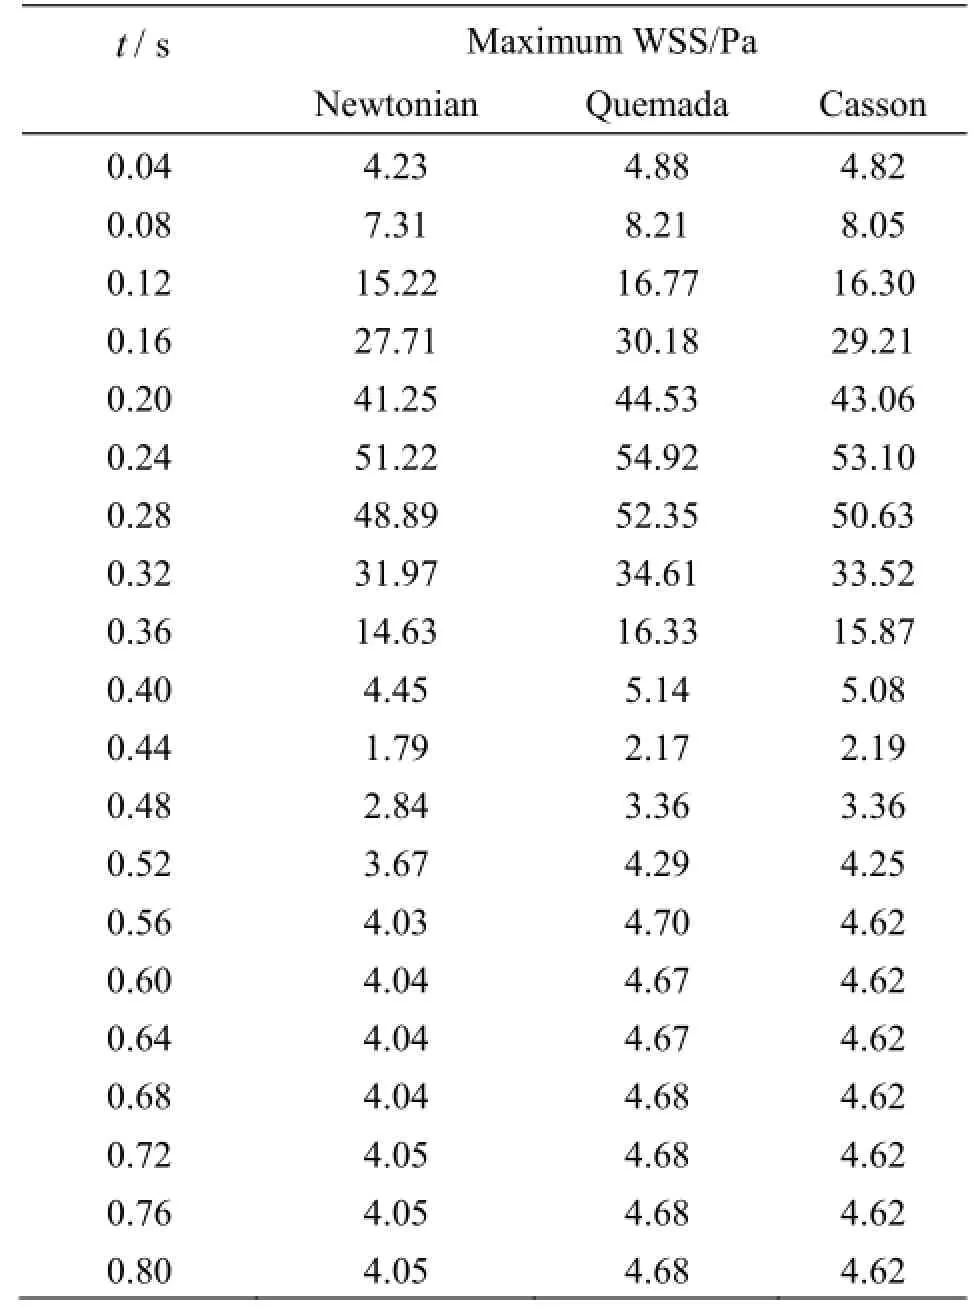
Table 1 Maximum WSS values

Table 2 AAWSS Values
Consequently, for the Casson model


which is equal to the Reynolds number of the Newtonian flow.
The comparison between different rheological models at a given Reynolds number is based on the fact that the values ofandDare common. In other words, the comparison will be carried out for the same inflow rate at the specific geometry. Therefore, the differences in the development of the flow field depend solely on the applied constitutive equations.
4.4Results and discussion
In all the numerical experiments to be presented hereafter, the selected time step was 0.02 s. Periodic independence of the solution was achieved after 4 cardiac cycles. In Figs.3-5 contour plots of the WSS on the arterial wall at peak systolic velocity for all blood models are presented. This characteristic time instance of the cardiac cycle is selected for demonstration purposes, since the velocity magnitude, and consequently the velocity gradients on the wall, obtain their maximum values.
It can be deduced from the contour plots that, regardless of the applied model, there is a consistent pattern of WSS distribution on the wall. Stresses aregreater in value at areas where the flow accelerates significantly, such as the outlet of the small branch of the bifurcation, or where the vessel geometry presents acute curvature and creases. Albeit the WSS distribution is similar among the applied models, the stress values differ significantly.
In Table 1 the maximum values of the WSS acting on the vascular wall at characteristic time instances distributed over the entire cardiac cycle are recorded. The Quemada and Casson models predict a greater value for the maximum applied WSS on the vascular wall than the Newtonian one. The Quemada model presents the maximum WSS value on the arterial wall throughout the cardiac cycle.
The AAWSS values, calculated by Eq.(12), provide an estimation of the WSS exerted on the entire wall surface at a time instance. In Table 2 the values of AAWSS for the same instances are recorded. In addition to the AAWSS values, the difference in the calculated values between the non-Newtonian model and the Newtonian one, weighted on the AAWSS of the non-Newtonian model, is recorded in Table 2. Specifically, the weighted differenceis calculated by

It can be directly inferred that as the flow accelerates the difference in the values of AAWSS is reduced, reaching its minimum at peak systole. On the other hand, as the flow decelerates the difference in AAWSS values is magnified. This behavior is attributed to the fact that at very low flow rates blood viscosity increases notably. Moreover, it must be noted that at low flow rates the highest value of the AAWSS is predicted by the Casson model, whereas at high flow rates the Quemada model gives the highest values.

Fig.6 TAWSS distribution on the arterial wall for the Newtonian model. Front and rear view
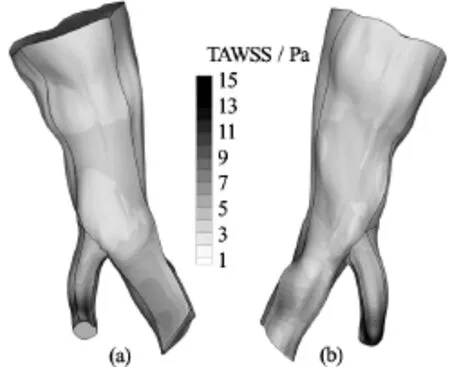
Fig.7 TAWSS distribution on the arterial wall for the Quemada model. Front and rear view

Fig.8 TAWSS distribution on the arterial wall for the Casson model. Front and rear view
The total shear load acting on the arterial wall over the entire cardiac cycle is quantified by means of the TAWSS variable, which is computed by Eq.(16). In Figs.6-8 contour plots of the TAWSS on the arterial wall for all blood models are presented.
As previously observed for the WSS field, the distribution of TAWSS on the arterial wall is similar for all the blood rheological models applied. This distribution pattern is attributed to the geometry of the vessel and the way it influences the flow field. On the other hand, the WSS magnitude is attributed to the flow rate applied at the inlet, and consequently the magnitude of velocity gradients on the wall, and the constitutive equations of blood. The maximum values of TAWSS for all blood models are recorded in Table 3.

Table 3 Maximum values of TAWSS
Next, the viscous behavior of blood throughout the cardiac cycle is investigated. In Table 4 the ave-rage shear rate values AASR, as calculated by Eq.(13), for all the blood models applied at the previously selected time instances are recorded.
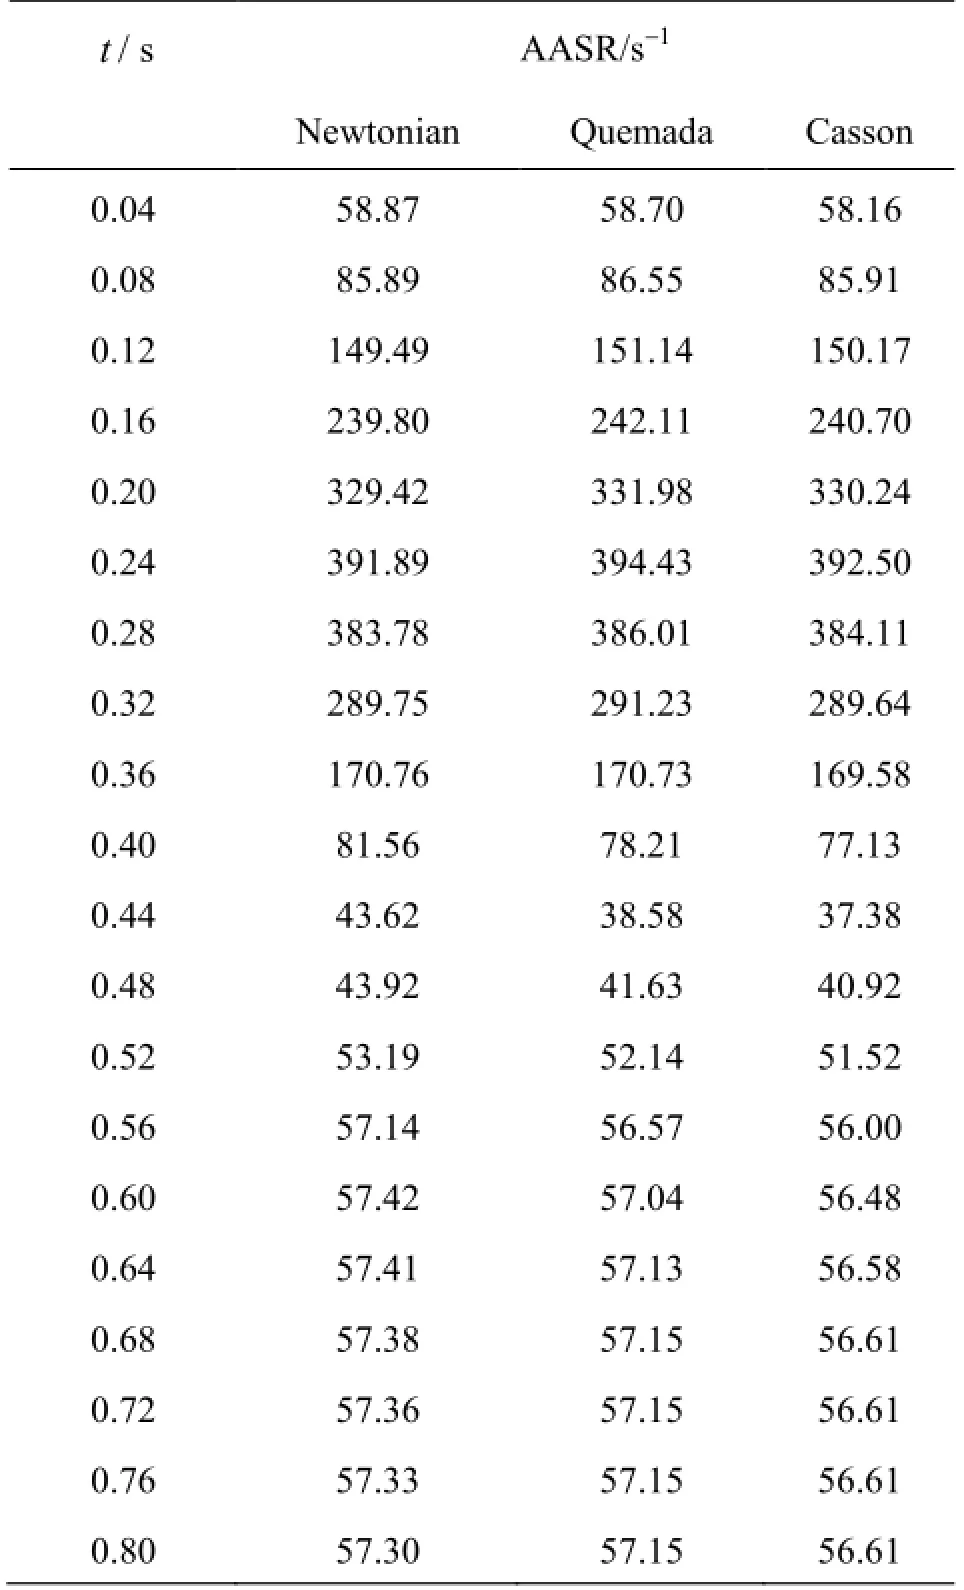
Table 4 AASR values
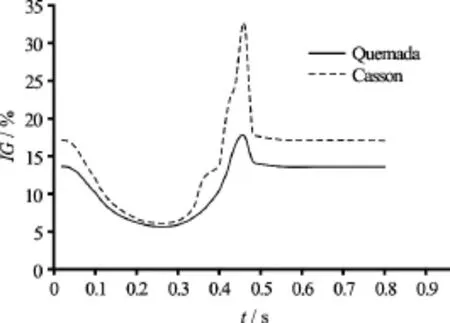
Fig.9 Global non-Newtonian importance factorfor the Quemada and Casson blood model versus time
It is anticipated that at shear rates below 100 s−1blood behaves as a non-Newtonian fluid. This is validated by the values of the global non-Newtonian importance factorValues ofgreater than 15% indicate a high non-Newtonian behavior of blood, whereas whenis less than 15% blood behaves as near Newtonian fluid[20]. In Fig.9 values ofare plotted versus time for the selected time instances for both the non-Newtonian models applied.
From the graphs it is directly deduced that at the systolic phase, during which the flow accelerates and the shear rate values are high, blood behaves like a Newtonian fluid. On the contrary, at the diastolic phase, where shear rates are lower than the threshold of 100 s-1blood behaves clearly like a non-Newtonian fluid. Moreover, the Casson model is clearly predicting the highest average viscosity values throughout the cardiac cycle. The difference in values is increasing as the flow accelerates. At peak systole, the values offor the Casson and Quemada models are 6% and 5.5% respectively. At the lowest flow rate, the values offor the Casson and Quemada models are 33% and 18% respectively.
Table 5 Maximum values of

Table 5 Maximum values of
Another important issue is the local non-Newtonian behavior of blood, which is quantified by means ofThis factor provides detailed information on the variation of blood viscosity in the domain. Thus, areas of non-Newtonian blood behavior are located, even if blood behaves like Newtonian macroscopically. In Table 5 the maximum values offor the selected time instances are recorded for both the non-Newtonian models. It is worth noting that even at low flow rates, where blood behaves like a non-Newtonian fluid, there are areas in the domain where blood presents high viscosity values. Consequently, even if thevalues are low and blood behaves like a Newtonian fluid there may be areas where the Newtonian approximation produces misleading results.
Finally, the oscillations of WSS on the arterial wall are investigated. As mentioned earlier, the OSI, as calculated by Eq.(17), is a means of locating areas on the vascular wall where the WSS values oscillate over a certain period of time. The OSI value varies from 0 to 0.5. Higher values of the index indicate areas where the WSS oscillate intensely over the selected period of time. These values correspond to time averaged separation and reattachment points on the arterial wall.
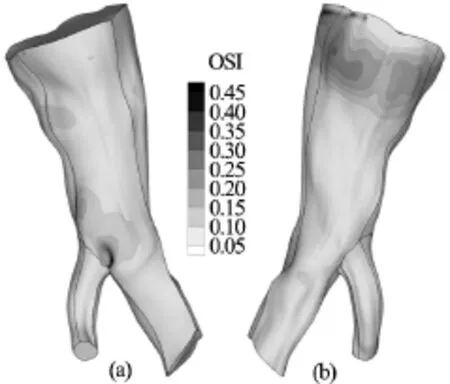
Fig.10 OSI distribution on the arterial wall for the Newtonian model. Front and rear view

Fig.11 OSI distribution on the arterial wall for the Quemada model. Front and rear view

Fig.12 OSI distribution on the arterial wall for the Casson model. Front and rear view
The maximum value of the OSI index is 0.49, 0.48 and 0.47 for the Newtonian, Quemada and Casson blood model respectively. In Figs.10-12 contour plots of the OSI index are drawn on the arterial wall for the Newtonian, Quemada and Casson model.
Examining the contour plots of the index together with the contour plots of the TAWSS, it can be inferred that the oscillations of the WSS are maximum at locations where their magnitude is minor, as anticipated. The regions of the arterial wall where the WSS are low and oscillatory have been documented to be more susceptible to the formation of atherosclerotic lesions[1,2]and more prone to the development of aneurysms[9,22,23]. From the contour plots it can be directly deduced that the OSI distribution pattern is identical for the Casson and Quemada models. On the other hand, the Newtonian model seems to predict a slightly wider area on the vascular wall where the WSS values oscillate over time. The maximum value of the OSI index is calculated for all models at the bifurcation. Consequently, this is the site on the arterial wall which is more susceptible to the formation of atherosclerotic lesions or aneurysms. In Fig.13, the values of the WSS at the site of maximum oscillations are plotted versus time for all models.
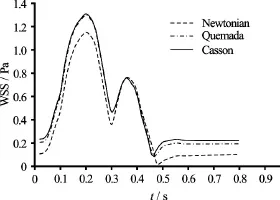
Fig.13 WSS values at site of the arterial wall with maximum OSI
It is clear that the Casson and Quemada models are in very good agreement with each other, whereas the Newtonian model predicts lower values of the WSS throughout the cardiac cycle. The most critical instance during the oscillations is when the WSS reach their lowest value. At this point, the intercellular permeability increases and the endothelium is more vulnerable.
The minimum values of WSS at the site of the arterial wall where they oscillate most intensely are recorded in Table 6.
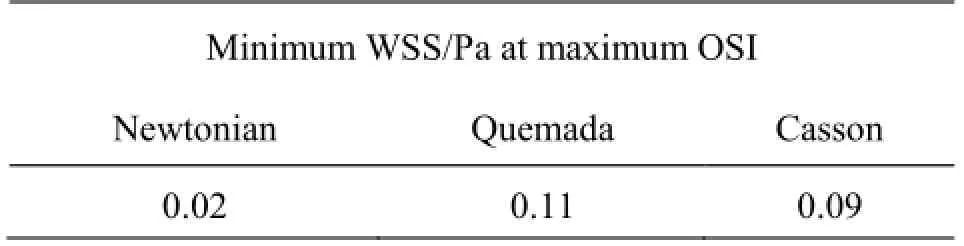
Table 6 Minimum WSS at site of the arterial wall with maximum OSI
The Newtonian model predicts a very low value of the WSS at the site of maximum oscillations compared with the values predicted using the Casson and Quemada models. Consequently, it can be deduced that the Newtonian model predicts a higher risk for the formation of atherosclerotic lesions or aneurysms.
5. Conclusions
The purpose of this work was to investigate the viscous behavior of blood in patient specific cardiovascular system simulations. The viscosity models applied were the Newtonian, Casson and Quemada. The effect of the different viscosity models was quantified by comparison of the average and local viscosity values and the WSS magnitude, distribution and oscillations on the arterial wall.
The numerical experiments indicate that the stress magnitudes are distributed on the arterial wall in a similar way regardless of the blood constitutive equations applied. However, both their area averaged values and the values at respective locations differ. The difference is significant at low flow rates and diminishes at high flow rates, with the non-Newtonian models presenting always higher stress values than the Newtonian. Among the non-Newtonian models, the Casson model yields the maximum values of local and average WSS at low flow rates, whereas the opposite occurs at high flow rates. Specifically, at peak systole the average stress values of the Quemada and Casson model are respectively 9.81% and 7.98% higher than the values predicted using the Newtonian model. On the other hand, at the lowest flow rate the difference in average stress values from the Newtonian values is 26.78% and 34.05% for the Quemada and Casson model respectively.
The macroscopic non-Newtonian behavior of blood is monitored by the values of the global non-Newtonian importance factor, which is a measure of the difference of the average viscosity of the fluid from the constant viscosity of the Newtonian fluid. The difference in average viscosity is high at low shear rates and vanishes as the shear rate increases, as anticipated. The Casson model predicts the higher average viscosity values among the non-Newtonian models applied throughout the cardiac cycle. At the peak of the systolic phase, when the shear rate reaches its maximum, the average viscosity is 6% and 5.5% higher than the constant viscosity of the Newtonian model for the Casson and Quemada model respectively. On the other hand, at the lowest shear rate the respective differences are 33% and 18%.
Furthermore, the numerical experiments indicated that even at high shear rates, where the fluid may be considered Newtonian, there are areas in the domain where the fluid viscosity is notably high. For instance, at the highest shear rate the maximum viscosity in the flow field is equal to 14.69 and 7.34 times the constant viscosity of the Newtonian model for the Casson and Quemada model respectively. It should be noted that the Casson model yields the highest local viscosity values throughout the cardiac cycle.
Oscillations of the WSS are maximized at locations where their magnitudes are low for both models. The Newtonian model forecasts a slightly wider area of the arterial wall on which the shear stresses oscillate. Moreover, the computational experiments reveal that the Newtonian model predicts very low WSS values at sites on the arterial wall where the WSS oscillations are intense. Thus, it overestimates the possibility of the formation of atherosclerotic lesions or aneurysms.
Overall, it is concluded that the Newtonian fluid approximation may be considered sufficient only at high flow rates and, consequently, shear rates. At shear rates below the threshold of 100 the non-Newtonian behavior of blood cannot be ignored.
Acknowledgement
This work was supported by the National Strategic Reference Framework (NSRF) 2007-2013 project DEKA: “Integrated prognostic system for risk assessment in stent implantations for Abdominal Aortic Aneurysm repair” (Grant No. 09SYN-12-1153).
[1] Cecchi E., Giglioli C., Valente S. et al. Role of hemodynamic shear stress in cardiovascular disease [J].Atherosclerosis, 2011, 214(2): 249-256.
[2] Cheng C., Tempel D., Van Haperen R. et al. Atherosclerotic lesion size and vulnerability are determined by patterns of fluid shear stress [J].Circulation, 2006, 113(23): 2744-2753.
[3] Lee S. W., Antiga L., Spence J. D. et al. Geometry of the carotid bifurcation predicts its exposure to disturbed flow [J].Stroke, 2008, 39(8): 2341-2347.
[4] Bressloff N. W. Parametric geometry exploration of the human carotid artery bifurcation [J].Journal of Biomechanics, 2007, 40(11): 2483-2491.
[5] Younis H. F., Kaazempur-mofrad M. R., Chan R. C. et al. Hemodynamics and wall mechanics in human carotid bifurcation and its consequences for atherogenesis: Investigation of inter-individual variation [J].Biomechanics and Modeling in Mechanobiology, 2004, 3(1): 17-32.
[6] Chiu J. J., Chien S. Effects of disturbed flow on vascular endothelium: Pathophysiological basis and clinical perspectives [J].Physiological Reviews, 2011, 91(1): 327-387.
[7] Soulis J., Giannoglou G., Dimitrakopoulou M. et al. Influence of oscillating flow on LDL transport and wall shear stress in the normal aortic arch [J].Open Cardiovascular Medicine Journal, 2009, 3(1): 128-142.
[8] Wahle A., Lopez J. J., Olszewski M. E. et al. Plaque development, vessel curvature, and wall shear stress in coronary arteries assessed by X-ray angiography and intravascular ultrasound [J].Medical Image Analysis, 2006, 10(4): 615-631.
[9] Humphrey J. D., Holzapfel G. A. Mechanics, mechanobiology, and modeling of human abdominal aorta and aneurysms [J].Journal of Biomechanics, 2012, 45(5): 805-814.
[10] Amirbekian S., Long R. J., Consolini M. A. et al. In vivo assessment of blood flow patterns in abdominal aorta of mice with MRI: Implications for AAA localization [J].American Journal of Physiology-Heart and Circulatory Physiology, 2009, 297(4): H1290-H1295.
[11] Ogunrinade O., Kameya G. T., Truskey G. A. Effect of fluid shear stress on the permeability of the arterial endothelium [J].Annals of Biomedical Engineering, 2002, 30(4): 430-446.
[12] Chatzizisis Y. S., Coskun A. U., JONAS M. et al. Role of Endothelial shear stress in the natural history of coronary atherosclerosis and vascular remodeling: Molecular, cellular, and vascular behavior [J].Journal of the American College of Cardiology, 2007, 49(25): 2379-2393.
[13] Quemada D. Rheology of concentrated disperse systems III. General features of the proposed non-newtonian model. Comparison with experimental data [J].Rheologica Acta, 1978, 17(6): 643-653.
[14] Casson N. A flow equation for pigment-oil suspensions of the printing ink type (Mill C. C. Rheology of disperse systems) [M]. Oxford, UK: Pergamon, 1959, 84-102.
[15] Makris E., Neofytou P., Tsangaris S. et al. A novel method for the generation of multi-block computational structured grids from medical imaging of arterial bifurcations [J].Medical Engineering and Physics, 2012, 34(8): 1157-1166.
[16] Pieper S., Lorensen B., Schroeder W. et al. The NA-MIC Kit: ITK, VTK, pipelines, grids and 3D slicer as an open platform for the medical image computing community [C].2006 3rd IEEE International Symposium on Biomedical Imaging: From Nano to Macro. Arlington, USA, 2006, 698-701.
[17] Neofytou P., Tsangaris S., Kyriakidis M. Vascular wall flow-induced forces in a progressively enlarged aneurysm model [J].Computer Methods in Biomechanics and Biomedical Engineering, 2008, 11(6): 615-626.
[18] Neofytou P., Tsangaris S. Flow effects of blood constitutive equations in 3D models of vascular anomalies [J].International Journal for Numerical Methods in Fluids, 2006, 51(5): 489-510.
[19] Ferziger J. H., Peric M. Computational methods for fluid dynamics [M]. 3rd edition, Berlin, Germany: Springer, 2002.
[20] Johnston B. M., Johnston P. R., Corney S. et al. Non-Newtonian blood flow in human right coronary arte- ries: Steady state simulations [J].Journal of Biomechanics, 2004, 37(5): 709-720.
[21] Neofytou P. A 3rd order upwind finite volume method for generalised Newtonian fluid flows [J].Advances in Engineering Software, 2005, 36(10): 664-680.
[22] Raghavan M. L., Ma B., Harbaugh R. E. Quantified aneurysm shape and rupture risk [J].Journal of Neurosurgery, 2005, 102(2): 355-362.
[23] Hoi Y., Meng H., Woodward S. H. et al. Effects of arterial geometry on aneurysm growth: Three-dimensional computational fluid dynamics study [J].Journal of Neurosurgery, 2004, 101(4): 676-681.
(Received September 27, 2015, Revised April 25, 2016)
* Biography: Anastasios Skiadopoulos (1980-), Male, Master
杂志排行

水动力学研究与进展 B辑的其它文章
- Magnetohydrodynamic flows tuning in a conduit with multiple channels under a magnetic field applied perpendicular to the plane of flow*
- Modelling of wave transmission through a pneumatic breakwater*
- The best hydraulic section of horizontal-bottomed parabolic channel section*
- Numerical simulation of hydrodynamic performance of blade position-variable hydraulic turbine*
- The effects of step inclination and air injection on the water flow in a stepped spillway: A numerical study*
- Efficient suction control of unsteadiness of turbulent wing-plate junction flows*