搅拌槽内三相流场混合时间的测定及模拟研究
2017-04-07秦帅王立成沈世忠强圣王霄亚
秦帅,王立成,沈世忠,强圣,王霄亚
天津理工大学化学化工学研,天津300384
搅拌槽内三相流场混合时间的测定及模拟研究
秦帅,王立成,沈世忠,强圣,王霄亚
天津理工大学化学化工学研,天津300384


为140 mm。导流筒直径为100 mm,高为50 mm,安装在搅拌桨上方,距离槽底70 mm。采用六直叶圆盘涡轮桨,桨径70 mm,叶宽20 mm,安装位置距离槽底40 mm。
本流场采用甘油水溶液,体积为2 L,固相分别为砂子和赤泥,各相的物性参数如表1所示。

表1 流场体系各相的物性参数Table 1 Physical parameters of each phase of the flow field system
混合时间的测定采用电导法。槽内流场稳定后,在两个挡板中间,距离搅拌轴中心径向距离为35 mm的液面上方10 mm处,滴加5 g NaCl,采用电导率仪测量体系的电导率,当电导率值与最终值偏差小于±5%时,认为混合均匀所用时间即为体系的混合时间。实验采用的电导率仪是梅特勒-托利多S230型电导率仪,电导率精度为±0.5%。在电解质加入位置对面的两个挡板中间,径向距离为35 mm处,测量四个不同位置的混合时间,取其中最大值作为体系的混合时间。测量点的位置及坐标如表2所示,其中,坐标以(径向位置,轴向位置)表示,坐标原点为搅拌槽底圆心,单位为 mm。

表2 混合时间测量点位置及坐标Table 2 Position and coordinate of the mixing time measuring point
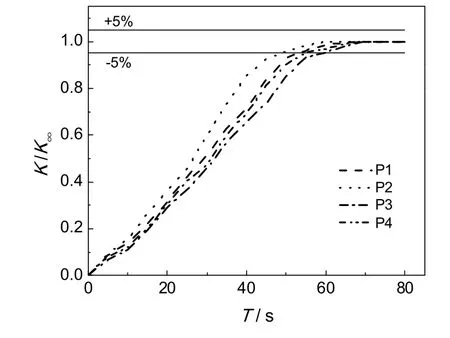
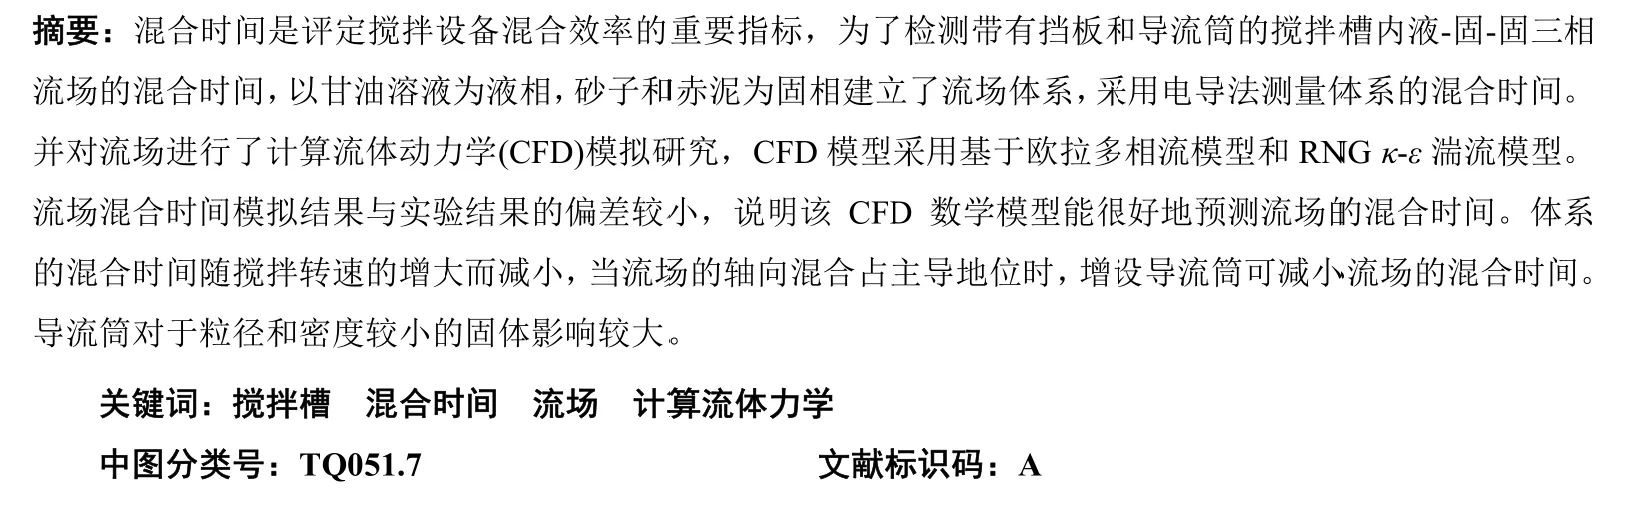
图2 不同区域的混合时间的测定Fig.2 Determination of mixing time in different areas by electrical conductivity method
以带导流筒的液-固-固三相流场,搅拌转速175 r/min为例,如图2所示。按照电导法,P1点混合时间T为53.4 s,P2点为48.6 s,P3点为59.0 s,P4点为54.2 s,其中P3点混合时间最大,所以体系的混合时间T为59.0 s。流场不同区域,搅拌桨周围混合时间最短,槽底和槽顶区域混合时间接近,导流筒区域混合时间最长,出现这样的分布规律,与流场的动能分布和流体阻力大小有关。
2 流场CFD数学模型的建立
本研究采用欧拉多相流模型[13,14]。对于流场中的某一相q(q为1,2,3),q相的连续性方程为:

即:单位空间单位时间内q相质量变化率 + 对流导致的q相质量变化率 = p与q相的质量传递变化量。
其中,α是q相的体积分数,ρ为q相密度,为q相速度,m为p至q相的质量传递,m
qqpqqp为q至p相的质量传递。
q相的动量守恒方程为:

在多相流场中,各相流体互相接触、碰撞、摩擦,存在相互作用力[15],各种作用力影响着流场的质量分布和动量传递[16]。这些作用力包括升力、虚拟质量力和曳力,其中,升力和虚拟质量力比曳力要小得多,因此,CFD模拟中只考虑了曳力对流场的影响[17]。
曳力的计算公式为:

其中,Kpq为相间动量传递系数。
液固相之间的曳力:
当:αl>0.8时,

ds为s相颗粒的直径,CD为曳力系数。

当:αl≤0.8时,
μl为粘度。
固相之间的曳力:

其中,ess’是颗粒碰撞的归还系数,Cfr,ss’是固体相间的摩擦系数,g0,ss’为径向分布函数,是一个当固体颗粒相变密时用于修改颗粒间碰撞概率的修正因子。在Fluent中:ess’=0.9,Cfr,ss’=0。
本研究采用的湍流模型为RNG(κ-ε)模型,该模型具有精度高,考虑因素全面,适用范围广等优点。
κ方程和ε方程为[18]:


式中C1ε、C2ε和Rε是模型参数,μeff为有效粘度。
3 流场网格数的确定
为了选择合适的网格数,对流场网格独立性进行了研究。对带有导流筒的搅拌体系分别采用18万、26万和74万三种网格划分,利用Fluent自带的前处理器Gambit进行网格划分,采用混合网格,其中搅拌桨及其以上区域采用非结构化网格,搅拌桨以下区域采用结构化网格。由于搅拌桨区域和搅拌槽底计算结果受网格数的影响较大,对这两部分区域的网格细化,提高模拟结果的准确性。模拟采用First Order Upwind离散方程差分格式,设定收敛残差为0.000 1。
搅拌转速u为200 r/min,比较不同径向距离r处砂子沿轴向的浓度分布,无因次结果如图3所示。在r为25 mm径向位置,如图3(a)所示,18万和26万两种网格划分,模拟偏差介于0.52%~6.94%;26万和74万两种网格划分,模拟偏差介于0.07%~3.97%。在r为35 mm径向位置,如图3(b)所示,18万和26万两种网格划分,模拟偏差介于0.39%~5.06%;26万和74万两种网格划分,模拟偏差介于0.01%~2.87%。在r为60 mm径向位置,如图3(c)所示,18万和26万两种网格划分,模拟偏差介于0.61%~7.33%;26万和74万两种网格划分,模拟偏差介于0.01%~2.99%。可以看出18万和26万两种网格划分偏差最大为7.33%,砂子轴向浓度分布曲线偏离较大;26万和74万两种网格划分下模拟偏差最大不超过3.97%,偏差较小,砂子轴向浓度分布曲线偏离较小。综合考虑计算的准确性、模拟速度及对设备的要求,该模拟研究采用的网格数为26万个网格。

图3 基于三种网格划分的砂子轴向浓度分布比较Fig.3 Comparison of the axial concentration distribution of sand based on three grid division
4 流场混合时间探讨
4.1 模型可信度验证
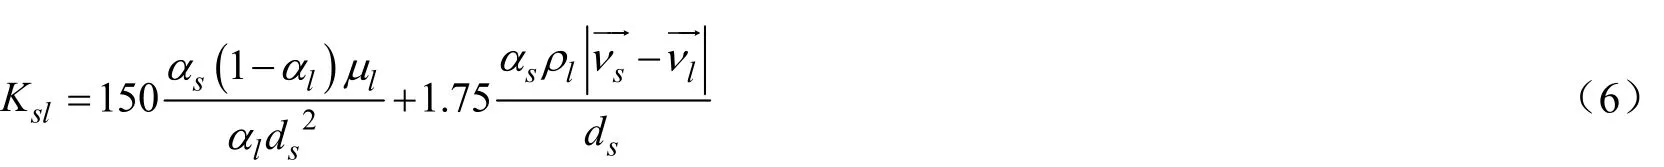
对于液-固-固三相流场,存在砂子和赤泥两种固相,选取两种固相混合时间大者为体系的混合时间。在搅拌转速175 r/min,砂子的混合时间的模拟结果确定方法如图4所示。计算得到P1点混合时间为51.2 s,P2点为44.4 s,P3点为55.4 s,P4点为51.9 s,其中P3点混合时间最大,所以该体系砂子混合时间的模拟值为55.4 s,与实验值59.0 s接近,也说明该CFD数学模型的准确性。
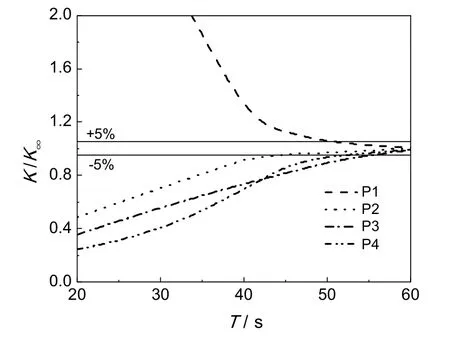
图4 流场模拟确定砂子混合时间的方法Fig.4 Determination of sand mixing time in the flow field simulation
表3所示为搅拌槽中有无导流筒设置三相流场混合时间的实验测定和模拟计算结果。其中,S1表示没有导流筒的体系,S2表示有导流筒的体系。由表3也可以看出,混合时间的实验值与模拟值吻合较好,S1体系最大偏差为5.25%,S2体系最大偏差为6.11%,说明建立的CFD模型能够很好地预测流场的混合时间。

表3 不同搅拌转速下流场混合时间实验值与模拟值的比较Table 3 Comparison of experimental and simulated values of mixing time under different stirred speed
4.2 不同条件下混合时间的模拟结果
4.2.1 搅拌转速对混合时间的影响
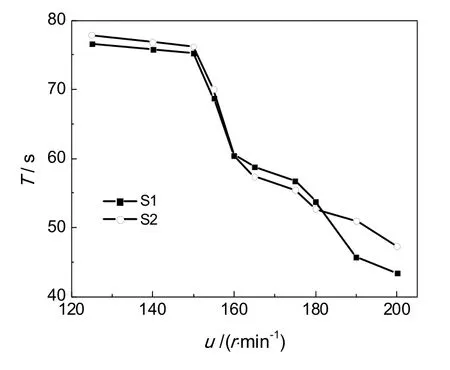
图5 搅拌槽内三相流场的混合时间Fig.5 Mixing time of the three-phase flow field in the stirred tank
搅拌槽内三相流场混合时间对搅拌速率的变化的模拟结果如图5所示,由图5可知,流场的混合时间随搅拌转速的增大而减小。当转速u小于150 r/min时,混合时间随搅拌转速增大,下降趋势较缓;转速u大于150 r/min后,混合时间随搅拌转速增大,下降趋势较大,特别是转速介于150~160 r/min时,混合时间呈直线下降趋势。
4.2.2 导流筒对流场混合时间和固相混合时间的影响
由图5可知,对于带有导流筒(S2)体系,当转速u小于160 r/min或u大于182 r/min时,体系的混合时间较无导流筒(S1)体系大;当转速为160~182 r/min时,混合时间较S1体系小。究其原因,当转速小于160 r/min或u大于182 r/min时,径向混合占主导地位,导流筒的存在降低了物质的径向流速,不利于了液相和固相间的质量、动量传递;当转速为160~ 182 r/min时,轴向混合占主导地位,导流筒的存在利于液相和固相间的质量、动量传递,缩短混合时间[19]。

图6 不同流场内同一固相混合时间比较Fig.6 Comparison of mixing time of the same solid phase in different flow fields
不同流场内同一固相混合时间的比较如图6所示。由图6(a)可见,在125~200 r/min搅拌转速时,砂子在设置导流筒的流场体系中混合时间大于不设导流筒的流场体系,但在165~180 r/min时,两者相差不大。由图6(b)可见,在125~160 r/min和184~200 r/min搅拌转速时,设置导流筒增大了赤泥的混合时间;160~184 r/min转速时,设置导流筒有利于赤泥混合时间的减小。
4.2.3 不同固相物料的混合时间
图7所示为同一流场内两种固相的混合时间。可以看见,不同固相的混合时间都随搅拌转速的增大而减小。不设导流筒时,在实验转速条件下(125~200 r/min),砂子的混合时间小于赤泥的混合时间。当设置导流筒时(S2体系),搅拌转速小于150 r/min时砂子易于混合均匀;当150~175 r/min转速时,砂子和赤泥的混合时间曲线几乎重合;但是当搅拌转速大于175 r/min时,砂子的混合时间反而大于赤泥的混合时间。
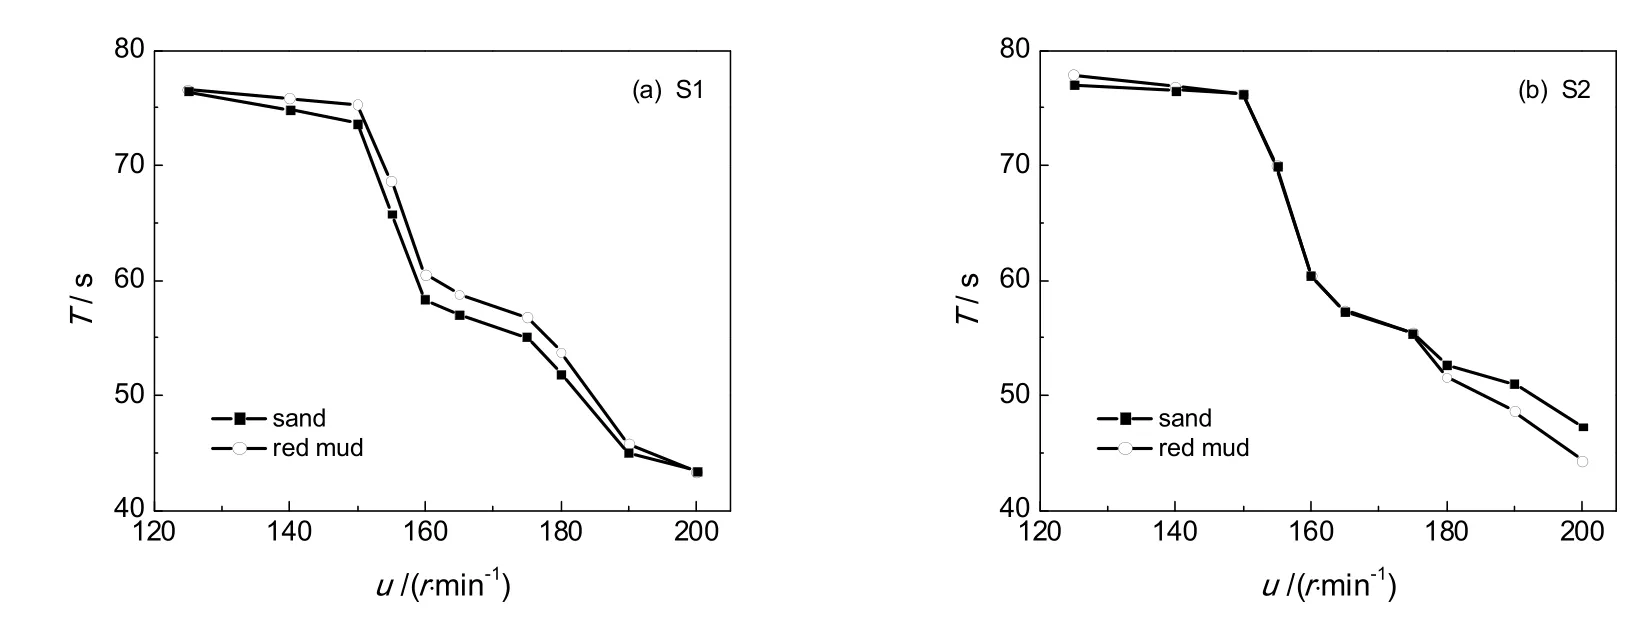
图7 同一流场内两种固相的混合时间Fig.7 Comparison of mixing time of two solid phases in the same flow field
5 结 论
混合时间是装置设计和放大的重要依据。该研究表明,搅拌槽内三相流场的混合时间随搅拌转速的增大而减小,转速较小时,混合时间减小较为缓慢,随着转速增大,混合时间减小幅度增大。对于不带导流筒的流场体系,粒径和密度大的固相(如砂子)混合时间较小。带有导流筒的流场体系,粒径和密度小的固相(如赤泥)在大部分搅拌转速范围内混合时间较小。搅拌转速较小或太大时,流场体系无法形成完整的轴向循环流场,设置导流筒不利于固相混合时间的缩短。当搅拌转速在一定范围内时,流场形成完整的轴向循环,轴向混合占主导地位,增设导流筒有利于固体物料混合时间的缩短。

[1] 张庆华, 毛在砂, 杨 超, 等. 搅拌反应器中液相混合时间研究进展 [J]. 化工进展, 2008, 27(10):1544-1549. Zhang Qinghua, Mao Zaisha, Yang Chao, et al. Research progress of liquid-phase mixing time in stirred tanks [J]. Chemical Industry and Engineering Progress, 2008, 27(10):1544-1549.
[2] Mcclure D D, Aboudha N, Kavanagh J M , et al. Mixing in bubble column reactors: experimental study and CFD modeling [J]. Chemical Engineering Journal, 2015, 264:291-301.
[3] Ruszkowski S. A rational method for measuring blending performance and comparison of different impeller types [J]. Proc. 8th Europe Mixing Conf., 1994, 283-291.
[4] 徐世艾. 两层桨搅拌釜内混合过程的新二维单元串联模型 [J]. 化学工业与工程, 2000, 17(4):208-213. Xu Shi’ai. A new cells-in-series model for the mixing process in a vessel with double impellers [J]. Chemical Industry and Engineering, 2000, 17 (4): 208-213.
[5] 周 坤. 偏心搅拌槽内固液两相流动特性的研究 [D]. 北京:北京化工大学, 2015:16.
[6] Abouzar A, Mahmoud Z, Nahid K, et al. Experimental and numerical study of iron pyrite nanoparticles synthesis based on hydrothermal method in a laboratory-scale stirred antoclave [J]. Powder Technology, 2016, 287:177-189.
[7] Claudio C, Giuseppina M, Cataldo D B, et al. Liquid mixing dynamics in slurry stirred tanks based on electrical resistance tomography[J]. Chemical Engineering Science, 2016, 152:478-487.
[8] 王曼曼. 剪切变稀体系下双轴组合搅拌桨的气液分散、传质和混合特性研究 [D]. 浙江:浙江大学, 2016.
[9] Yu X, Makkawi Y, Ocone R, et al. A CFD study of biomass pyrolysis in a downer reactor equipped with a novel gas-solid separator-I: hydrodynamic performance [J]. Fuel Processing Technology, 2014, 126:366-382.
[10] Patel R, He P F, Zhang B, et al. Transport of interacting and evaporating liquid sprays in a gas-solid riser reactor [J]. Chemical Engineering Science, 2013, 100:433-444.
[11] Murthy B N, Ghadge R S, Joshi J B. CFD simulations of gas-liquid-solid stirred reactor: Prediction of critical impeller speed for solid suspension [J]. Chemical Engineering Science, 2007, 62: 7184-7195.
[12] Panneerselvam R, Savithri S, Surender G D. CFD simulation of hydrodynamics of gas-liquid-solid fluidised bed reactor [J]. Chemical Engineering Science, 2009, 64: 1119-1135.
[13] Khan M J H, Hussain M A, Mansourpour Z, et al. CFD simulation of fluidized bed reactors for polyolefin production-a review [J]. Journal of Industrial and Engineering Chemistry, 2014, 20: 3919-3946.
[14] Heidari A, Hashemabadi S H. CFD study of diesel oil hydrotreating process in the non-isothermal trickle bed reactor [J]. Chemical Engineering Research and Design, 2015, 94: 549-564.
[15] Ranade V V. Numerical simulation of dispersed gas-liquid flows [J]. Sadhaana, 1992, 17: 237-273.
[16] Ljungqvist M, Rasmuson A. Numerical simulation of the two-phase flow in an axially stirred vessel [J]. Trans. Inst. Chem. Eng., 2001, 79: 533-546.
[17] Chen X Z, Shi D P, Gao X, et al. A fundamental CFD study of the gas-solid flow field in fluidized bed polymerization reactors[J]. Powder Technology, 2005, 205: 276-288.
[18] Wang L C, Zhang Y F, Li X G, et al. Experimental investigation and CFD simulation of liquid-solid-solid dispersion in a stirred reactor[J]. Chemical Engineering Science, 2010, 65: 5559-5572.
[19] 王立成. 带导流筒搅拌槽中液-固-固三相流场的实验与模拟研究 [D]. 天津: 天津大学, 2010.
Measurement and Simulation of Mixing Time of Three-Phase Flow Field in the Stirred Tank
Qin Shuai, Wang Licheng, Shen Shizhong, Qiang Sheng, Wang Xiaoya
School of Chemistry and Chemical Engineering, Tianjin University of Technology, Tianjin 300384, China
The mixing time is an important index to evaluate the mixing efficiency of the mixing equipment. In order to detect the mixing time of the liquid-solid-solid three-phase flow field in the stirred tank equipped with baffles and draft tube, a flow field system using the glycerol solution as the liquid phase, the sand and red mud as solid phases was established and the mixing time of the system was measured by electrical conductivity method. The computational fluid dynamics (CFD) simulation of the flow field was carried out. The CFD model was based on the Eulerian multiphase model and the RNG κ-ε turbulence model. The simulation results indicated that the CFD model could well predict the mixing time of the flow field due to smaller deviation of between the simulation and experimental results. The mixing time decreased with the increase of the stirring speed, and when the axial mixing of the flow field was dominant, the mixing time of the flow field can be reduced by adding the draft tube. The draft tube had a great influence on the solids with smaller particle size and density.
stirred tank; mixing time; flow field; computational fluid dynamics