Large eddy simulation of turbulent attached cavitating flow with special emphasis on large scale structures of the hydrofoil wake and turbulence-cavitation interactions*
2017-03-09BinJi季斌YunLong龙云XinpingLong龙新平ZhongdongQian钱忠东JiajianZhou周加建
Bin Ji (季斌), Yun Long (龙云), Xin-ping Long (龙新平), Zhong-dong Qian (钱忠东),Jia-jian Zhou (周加建)
1.State Key Laboratory of Water Resources and Hydropower Engineering Science, School of Power and Mechanical Engineering, Wuhan University, Wuhan 430072, China, E-mail:jibin@whu.edu.cn
2.Hubei Key Laboratory of Waterjet Theory and New Technology, Wuhan University, Wuhan 430072, China
3.Science and Technology on Water Jet Propulsion Laboratory, Shanghai 200011, China
(Received June 9, 2016, Revised December 6, 2016)
Large eddy simulation of turbulent attached cavitating flow with special emphasis on large scale structures of the hydrofoil wake and turbulence-cavitation interactions*
Bin Ji (季斌)1,2,3, Yun Long (龙云)1,2, Xin-ping Long (龙新平)1,2, Zhong-dong Qian (钱忠东)1,Jia-jian Zhou (周加建)3
1.State Key Laboratory of Water Resources and Hydropower Engineering Science, School of Power and Mechanical Engineering, Wuhan University, Wuhan 430072, China, E-mail:jibin@whu.edu.cn
2.Hubei Key Laboratory of Waterjet Theory and New Technology, Wuhan University, Wuhan 430072, China
3.Science and Technology on Water Jet Propulsion Laboratory, Shanghai 200011, China
(Received June 9, 2016, Revised December 6, 2016)
In this paper, the turbulent attached cavitating flow around a Clark-Y hydrofoil is investigated by the large eddy simulation (LES) method coupled with a homogeneous cavitation model. The predicted lift coefficient and the cavity volume show a distinctly quasi-periodic process with cavitation shedding and the results agree fairly well with the available experimental data. The present simulation accurately captures the main features of the unsteady cavitation transient behavior including the attached cavity growth, the sheet/cloud cavitation transition and the cloud cavitation collapse. The vortex shedding structure from a hydrofoil cavitating wake is identified by theQ-criterion, which implies that the large scale structures might slide and roll down along the suction side of the hydrofoil while being further developed at the downstream. Further analysis demonstrates that the turbulence level of the flow is clearly related to the cavitation and the turbulence velocity fluctuation is much influenced by the cavity shedding.
Cavitation, large eddy simulation (LES), vortex structure, turbulence-cavitation interactions
Introduction
The cavitation involves a very complex twophase flow. It can have negative impacts on the hydraulic machinery such as through vibrations, erosions, noises and performance break-down[1]. Therefore, it is necessary to investigate its physical mechanism for controlling cavitation in engineering applications.
The fundamental physics of the cavitation phenomenon was widely studied. Much attention was paid on the evolution of both sheet and cloud cavitations on the hydrofoil. The typical quasi-periodic phenomenon was a focus, including the sheet cavitation inception,growth and shedding[2-4]. Li et al.[5]reproduced the quasi-periodic phenomenon by using the large eddy simulation (LES) method and the VOF model. The VOF technique is widely used for the simulation of the free surface flow[6]. The cavity interface can be predicted accurately[7]. Gnanaskandan and Mahesh[8]studied the sheet to cloud cavitation transition over a wedge. It is found that the frequency of the shedding process obtained by the LES is in good agreement with that of the experiments. These studies show that the recent methods can accurately capture the detailed features of the cavitation. Studies about the sheet to cloud cavitation show that the re-entrant jet is a very important source factor for the cavity shedding. Le et al.[9]studied partial cavities. They observed that the cavitation periodic shedding was closely associated with the re-entrant jet. Pham et al.[10]confirmed the conclusions of Le et al.[9]by analyzing the frequencies of the re-entrant jet surges and the cloud shedding. Recent studies confirm that the re-entrant jet is the main cause for the development and the shedding of the attachedcavity[2]. The studies of the cylindrical objects[11], the head-form body[12]and others[13-15]demonstrate that the re-entrant jets are responsible for the cavity shedding.
The unsteady cavity shedding often involves a complex cavity vortex structure. Therefore, the cavitation-vortex interactions are important research issues. Gopalan and Katz[16]demonstrated by means of the PIV and the high speed photography that the collapse of the vapor cavity in the downstream region was mainly responsible for the generation of the vortex. The LES method is a useful tool to reproduce the unsteady cavitating flow, with great advantages in accurately capturing the complex vortex structures. It was firstly proposed by Smagorinsky[17], and now it is widely applied for the simulations[18,19]. Roohi et al.[7]combined the 2-D LES with the VOF and the cavitation model and showed that it was useful to simulate the shape of the cloud cavity and its dynamics. Ji et al.[13]and Luo et al.[20]studied the 3-D cavitation and vortex structures based on the LES around a twisted hydrofoil. Ji et al.[21]indicated that the mass transfer along the cavity surface induces an increase in the vortex dilatation. They found that the baroclinic torque term is important along the liquid-vapor interface but has a negligible effect inside the attached cavity region. Dreyer et al.[22]studied the tip leakage vortex on a NACA0009 hydrofoil using the stereo-PIV. The results revealed that it is prone to generate the cavitation when the vortex length is the maximum. All these studies have enhanced the understanding of the cavitation-vortex interactions, but the large scale vortex structures remain a difficult issue. More recently, Peng et al.[23]performed a series of experimental observations around hydrofoils in the cavitation tunnel. They observed that the U-type fl ow structures were common in cloud cavities. The side reentrant jets were identified as the main cause of the sheet cavity shedding and the formation of the U-type vortex structure was controlled in the cloud cavitation, which usedQ-criterion[24]to visualize the vortex structure evolution in numerical results. This helps us gain a deeper understanding of the cavitation shedding dynamics and cavitation-vortex interactions.
Besides these fundamental studies of the dynamics of the sheet and cloud cavitation and the cavitation-vortex interactions, various kinds of cavitations were also studied, among others, the cavitating fl ows around a semi-circular leading-edge fl at plate[25], the axisymmetric projectile[26], the 3-D hemispherical head-form body[12], and behind a 3-D disk[27]by numerical and experimental methods. Wang et al.[28]studied the effect of free surface on the unsteady behavior of the cloud cavity. They found that the cavity evolution was remarkably different when the axisymmetric projectile was near the free surface. Park and Rhee[29]performed a comparative study of incompressible and compressible flow solvers for the cavitating flow. They concluded that the compressibility effects can enhance the reproduction of the cavitation. Various features of the cavitation at different cavitators are thus revealed, and the understanding and the ability to control and utilize the cavitation are enhanced.
The pressure and velocity fluctuations were also attracted some attention. Chen et al.[30]found that the pressure fl uctuations are closely related to the transient cavitation behaviors, and they are excited by the acceleration due to the changes in the cavity volume. Ji et al.[31]illustrated the relationship between the cavitation evolution and the pressure fluctuations by analyzing the cavity volume fluctuation. They came to a similar conclusion that the cavity volumetric acceleration is the main source of the cavitation excited pressure. Huang et al.[32]introduced a filter-based corrected model. They found that the transient cavitation behaviors significantly enhanced the turbulence velocity fluctuations to induce a thicker turbulence boundary layer. More researches show that the streamwise velocity fluctuations generally are dominant inside the cavity[33], and the streamwise and spanwise fluctuations are equally important at the cavity closure and in the wake[8]. The turbulence-cavitation interactions continue to attract many research interests, but their mechanisms remain not well understood[34,35].
Although a great progress has been made on the cavitating flow and the cavity vortex structures by both numerical and experimental methods, the large scale structures in the hydrofoil wake are still a worthwhile topic. Furthermore, the turbulence-cavitation interactions remain elusive due to the unsteadiness and the complex flow structures. This paper studies the cavitating flow around a Clark-Y hydrofoil by investigating the turbulent attached cavitating flow with a special emphasis on the large scale structures in the hydrofoil wake and the turbulence-cavitation interactions with the LES approach.
1. Cavitation model and numerical methods
The LES method is employed in this paper to solve the unsteady Navier-Stokes equations coupled with a mass transfer cavitation model. The main features of the solver are as follows.
1.1Physical cavitation model
Schnerr and Sauer[36]developed the cavitation model adopted in this paper to describe the mass transfer through the interface of the vapor and the liquid. The cavitation model is described by the follow equation

whereαvis the vapor volume fraction. The source termsm˙+andm˙−in Eq.(1) are deduced from the bubble dynamics equation and they denote the evaporation and condensation rates, which are defined as follows
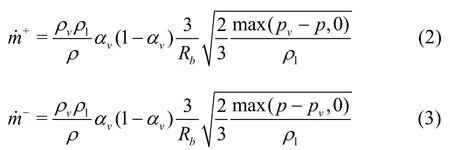
whereRbis the bubble radius which is computed by

whereNbis the bubble number density, which is set as 1013, as recommended by Schnerr and Sauer[36].
1.2Governing equations and the LES approach
In the basic governing equations in the mixture model adopted in this study, the same velocity and pressure for the vapor and the liquid are assumed, and the mass and momentum conservation equations are as follows

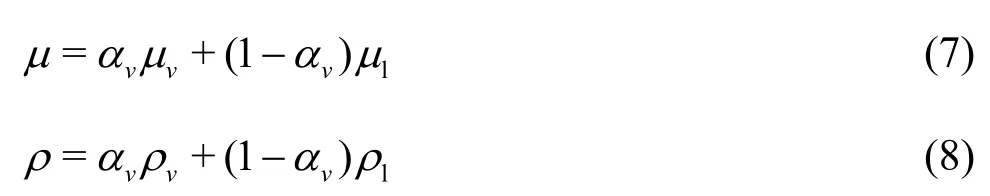
whereuiis the velocity component in theidirection andpis the mixture pressure which is assumed taking the same value for the vapor and the liquid, andμis the laminar viscosity andρis the mixture density, and they are defined as follows
The LES equations are obtained by applying a Favre-filtering operation to Eqs.(5) and (6). The equations are as follow:

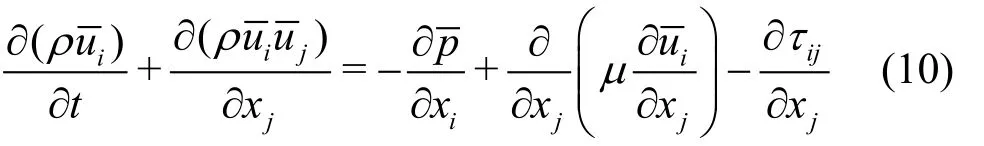
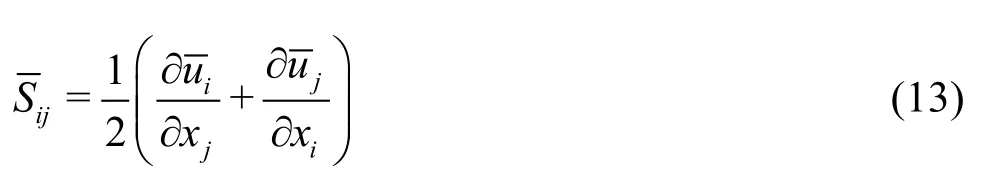
where the over-bars denote the filtered quantities andτijmeans the subgrid-scale stresses which are the unknown terms and defined as


whereis the rate of the strain tensor in the resolved scale and is defined as
whereμtis the subgrid-scale turbulence viscosity closed by applying the wall-adopting local eddy-viscosity (WALE) model[37]in this paper. The WALE model can return a zero turbulence viscosity for the laminar shear flows to allow the correct treatment of the laminar zones in the domain. In the WALE model,μtis modeled as


wherekis the von Karman’s constant,dis the distance to the closest wall,Vis the volume of the computational cell andCSis the default WALE constant with the value of 0.5[37].
1.3Simulation setup
A Clark-Y hydrofoil with a chord length ofC=0.07 m is studied in this paper. The hydrofoil is placed horizontally in the computational domain with a fixed angle of attack ofα=8oas shown in Fig.1. Note that it is difficult to use the experimental spanwise size in view of the huge computational cost. Therefore, the spanwise length is chosen as0.3Cin Fig.1(a). The adopted length and height in the computational section is10Cand2.7C, respectively, as the height is usually chosen at least as twice of the thickness of the hydrofoil for capturing the streamwise vortex accurately[38]. The boundary inlet is arranged an imposed velocity and the outlet is with a fixed static pressure and a no-slip boundary on the surface of the hydrofoil. The free slip wall is imposed on the upper and lower walls. The side wall boundary is arranged as the periodicity interface. An O-H type grid as shown in Fig.2 is generated with a sufficient refinement near the foil surface for the LES method. The calculation mesh is a 3-D mesh and the 2-D mesh in Fig.2 is just its 2-D side view. The grid sizes near the hydrofoil of Fig.2 in the stream-wise, wall-normal and span-wise directions are Δx=2× 10⁻⁴m,Δy=2× 10⁻⁵mand Δz=2.1× 10⁻⁴m, respectively.

Fig.1 Computational domain and boundary conditions
The time-dependent governing equations are discretized in both space and time domains. The second order central difference scheme is adopted for the diffusion term, with a high order resolution scheme[39]for the convective term in the governing equations. The second-order implicit formulation is adopted for the transient term. The simulation setup is similar to that described in our previous paper[21]. The simulation is carried out initially under the steady non-cavitation condition and then, the unsteady cavitating flow is modeled with the steady non-cavitation results as the initial conditions. The time step isTref/200and theYplus is about 1. The residual is 10‒3for the continuity equation, the momentum equations and the mass transport equation. The maximum internal iteration steps for the unsteady cavitating flow in each time step is 50. The calculation is conducted in a computer of 64G memory and 8-core parallel, and with about 10 000 time steps, and it takes about 1 week. The convergence process is smooth and the results are as follows.
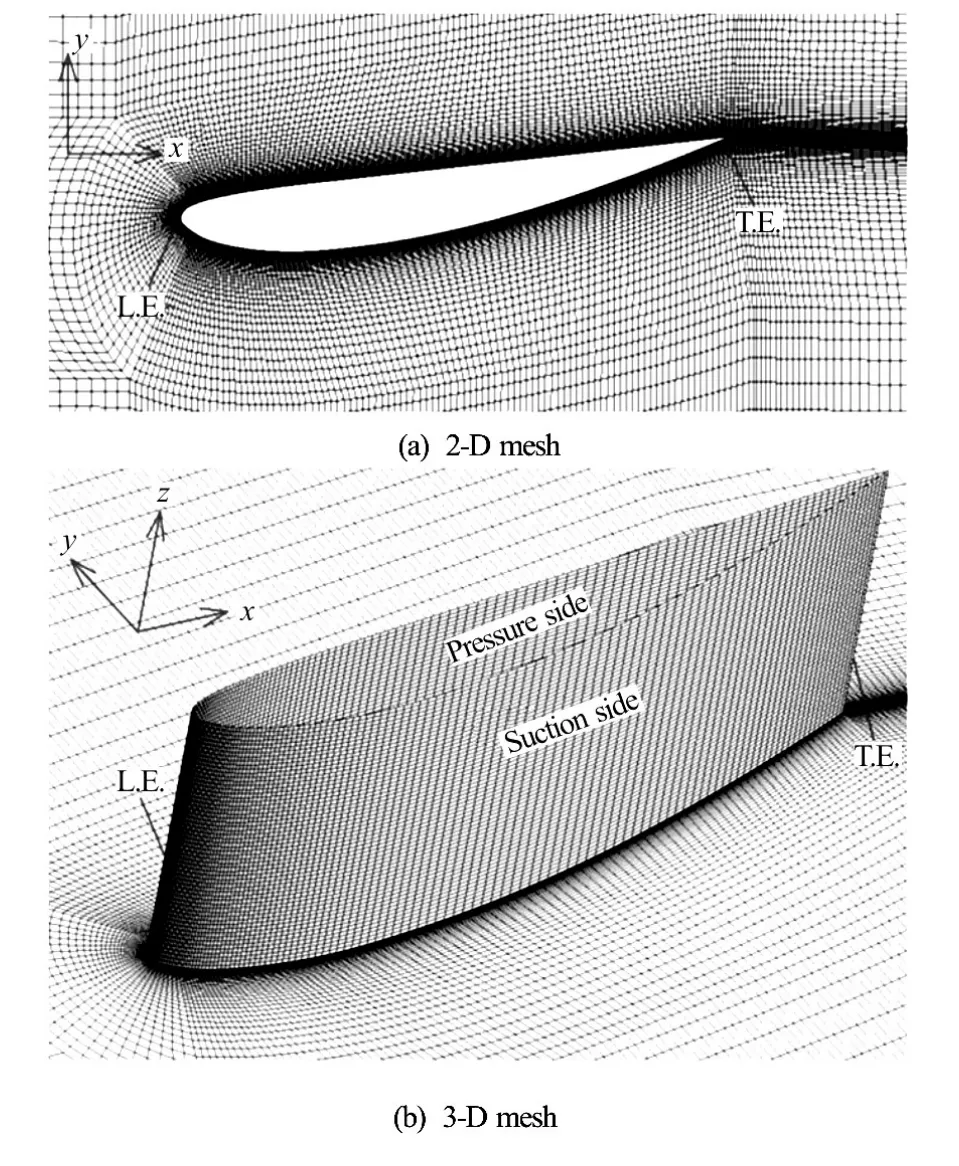
Fig.2 Structural mesh around the hydrofoil surface
2. Results and discussions
2.1Periodic behaviors of the hydrodynamic performance and the cavity volume fluctuationsThe lift coefficient is defined as

Figure 3 shows the predicted lift coefficient against the time. The lift coefficient clearly shows periodic behaviors against the time. It varies dramatically as the pressure distribution changes sharply, which is reasonable in view of the sheet cavity shedding and the cloud cavity, as illustrated in the followed discussion. Figure 4 presents the numerical total cavity volume variation over three typical cycles. The cavity volume obtained by simulation is defined as
whereNis the total number of the control volumes in the computational domain,αiis the vapor volumefraction in each control volume andViis the volume of each cell.Scavin Fig.4 is the hydrofoil profile area. The reference time isTref=40 msbased on Huang et al.[32]. The experimental cavity volume is obtained from Huang et al.[32]. It is indicated that the fluctuation of the cavity volume occurs during the cavity shedding. Wang et al.[40]confirmed that the large fluctuation of the total cavity volume occurs when the cavitation exists. It is observed that the cavity volume variation is a distinctly quasi-periodic process with the cavity shedding. The numerical largest cavity volume is smaller than that in the experiment when the LES method is used, but the predicted total cavity volume is in good agreement with the experimental data in general. In Huang et al.[32], the numerical largest cavity volume is a little bit higher than the experimental one obtained with the fi lter-based density corrected model (FBDCM), but the variation of the cavity volume is indeed captured. Overall, the lift coefficient and the cavity volume show periodic behaviors. The large fluctuation of the lift coefficient and the cavity volume occurs during the cavitation shedding. Next we will have detailed discussions about the time evolution of the cavity, the unsteady cavity and the vortex structures and their interactions.
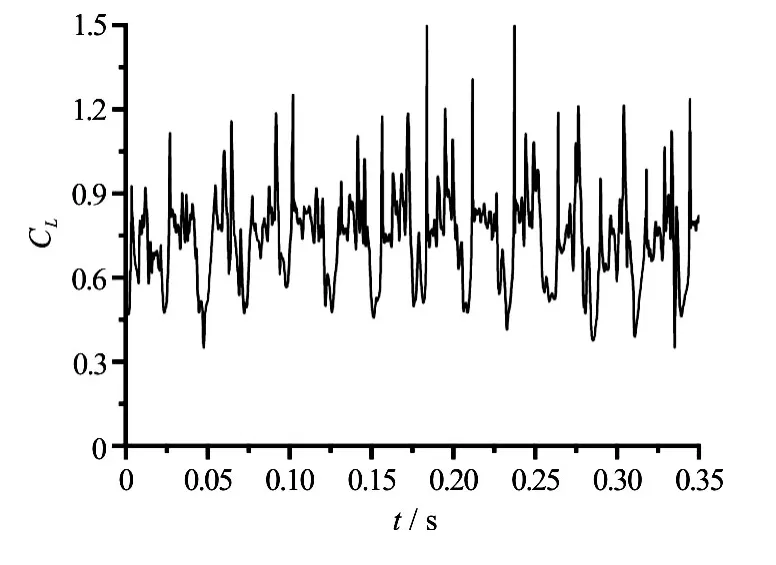
Fig.3 Predicted lift coefficients against the time.σ=0.8,α=8o,U=10 m/s∞

Fig.4 (Color online) Cavity volume variation during cavitation shedding (Exp.[32]vs. Cal.).σ=0.8,α=8o,U∞= 10 m/s
2.2Time evolution of the unsteady cavitation and discussions of large scale structures in the hydrofoil wake
To show the calculated time evolution of the unsteady cavitation, eight numerical snapshots are shown in Fig.5. The experimental results are from the doctoral thesis of Huang[41]. Figure 5 shows the comparison between the experimental and predicted time evolutions of the cavitation shedding in one typical cycle. The numerical snapshots show that the experimental and predicted cavitation shedding patterns within one typical cycle are in good agreement, except for a few differences. The numerical results obtained with the LES method have captured the transient cavitation features visualized in the experiment, including the inception, the growth and the shedding of the sheet cavity. The detailed analyses are as follows. Att=1/8T, a thin attached cavity appears near the foil leading edge (L.E.) in Fig.5(b1), and the cloud cavity near the trailing edge (T.E.) resulted by the breakup of the previous sheet cavity is still seen apparently. Then, the numerical cavitation pattern shows that the length of the attached cavity increases as shown in Figs.5(b2) and 5(b3). The length of the attached cavity grows to its maximum att=4/8Tand the cavity surface near the T.E. becomes a bubble from now on. In Fig.5(b5), a re-entrant jet appears apparently while the adverse pressure gradient is strong enough to conquer the momentum near the foil surface. The re-entrant jet will be visualized by the distribution of the axial velocity along the foil later. Then, the re-entrant jet develops towards the L.E. as shown in Figs.5(b6) and 5(b7). With the development of the re-entrant jet, the attached cavity surface becomes an unstable turbulent vapor cloud and begins to shed from the foil surface. The unstable turbulent vapor cloud finally leads to a highly unstable cloudy cavitation in Figs.5(b5)-5(b8), resulting in a highly turbulent flow which will be discussed later on in Section 2.3. Meanwhile, the cavity volume decreases to the minimum as shown in Fig.4. Overall, the numerical results predicted with the LES method are in a reasonable agreement with the experimental pictures to show that the LES method can accurately capture the features of the unsteady cavitation transient behavior.
The vortex structures in one typical cycle visualized based on theQ-criterion andα=10%isosurface are shown in Fig.6. It is useful to apply theQ-criterion for presenting the vorticity due to the vortex rather than the shear. TheQ-criterion is introduced by Hunt et al.[24], and it is defined as
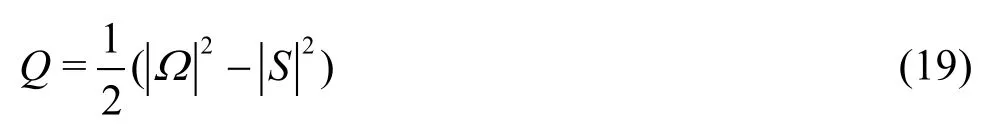

Fig.5 (Color online) Time evolution of cavitation shedding in one typical cycle.σ=0.8,α=8o,U∞=10 m/s

Fig.6 (Color online) Vortex structures in one typical cycle forσ=0.8,α=8o
whereΩis the vorticity tensor andSis the rate of the strain tensor. The value of theQ-criterion is set as 20 000 in Fig.6 to ensure that the vorticity is mainly resulted by the vortex. As is shown in Fig.6, the vortex shape based on theQ-criterion is much more complicated than the vapor volume fraction. The cloud cavitation collapses downstream and then becomes a large number of small bubbles, but the vortex is closely related to the cavitation and it can still slide and develop into the downstream. The vortex structurewhich is visually based on theQ-criterion can be seen in Figs.6(b1)-6(b8).
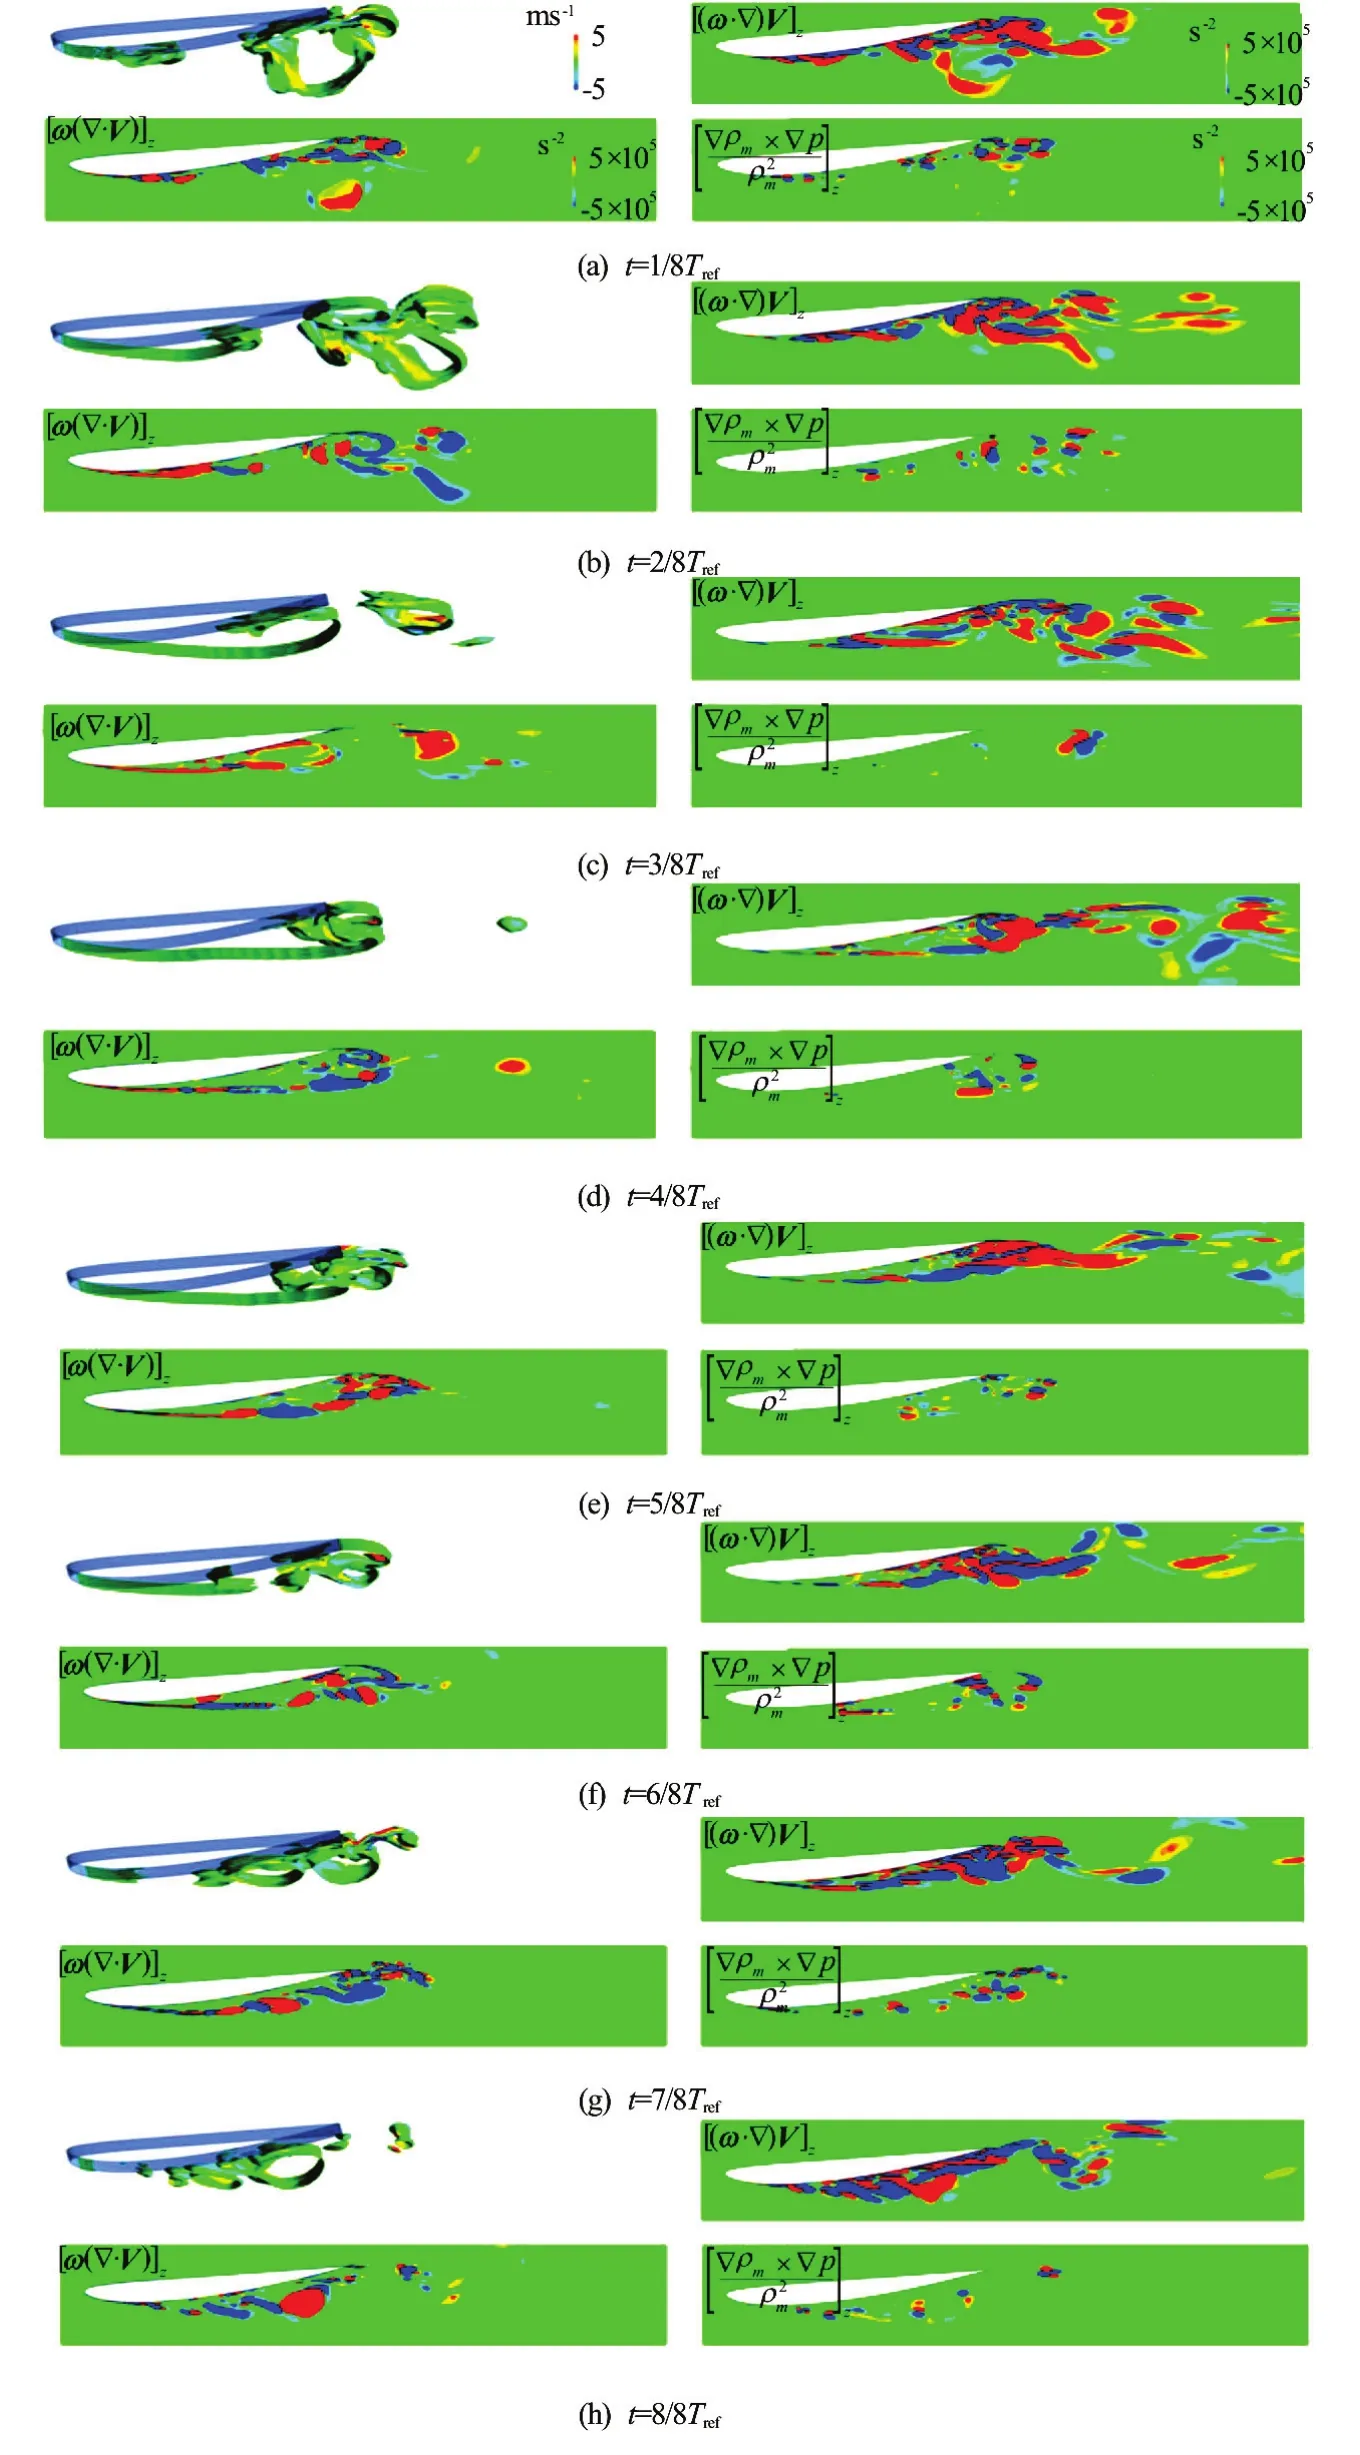
Fig.7 (Color online) The predicted vapor volume fraction, vortex stretching term, vortex dilatation and baroclinic torque term in one typical cycle.σ=0.8,α=8o,U∞=10 m/s
Att=1/8Tand 2/8Tnear the T.E. in Fig.6, the shed vapor cloud has a clearly horseshoe-shaped vortex structure indicated by the arrows. In Figs.6(b1)-6(b7), the horseshoe-shaped structure rolls down alongthe suction face of the hydrofoil and slides towards the hydrofoil wake as the red dash line shows, and the evolution of the same large-scale structure can be seen. The large-scale structure intensity becomes weaker as it progresses further downstream. Note that by the isosurface of theQ-criterion, the horseshoe-shaped structure is generated in Fig.6(b1) after the cavity shedding due to the re-entrant jet, and the main flow transports the horseshoe-shaped structure towards the downstream. Gopalan and Katz[16]show that the horseshoe-shaped vortex is formed from the initial rounded cavity structure which shrinks due to the increase of the local pressure. The head of the horseshoe-shaped vortex structure travels further downstream than the two legs and therefore, the horseshoeshaped vortex structure is at an oblique angle with the horizontal plane. The initial horseshoe-shaped vortex structure is thicker and complicated above the face near the trailing edge, but with the time passing, the vortex structure becomes more and more weaker. Finally, the vortex structure collapses initially at the head due to the local high pressure. The sheet cavity shedding and the cloud cavity have a substantial influence on the vortex structure. The large-scale vortex structure gives rise to a very complex and turbulent flow, which will be shown in Section 2.3.
The transient evolution of the cavity shedding and the horse-shaped vortex were also observed and illustrated in other investigations of different hydrofoils. Ji et al.[13]studied the twisted hydrofoil and found that the cavitation is also evolved due to the effects of both the re-entrant jet and a pair of sideentrant jets. It is noted that the vapor cloud will generate a more clear and dramatical horse-shaped vortex at the twist and large attack angle in the middle area. Another study of the NACA66 hydrofoil by Ji et al.[21]is also carried out with the LES method. Both the numerical and experimental investigations demonstrate that the highly turbulent vapor cloud with a 3-D structure is developed from a 2-D smooth pocket of vapor.
As is shown in Fig.6, the highly unsteady flow in the cloud cavitation can result in a very complicated vortex structures. In order to investigate the cavitationvortex interaction, the vorticity transport equation in a variable density flow is employed as follows

In this equation, the vorticity consists of three terms. The vortex stretching term (ω⋅∇)Vdenotes the stretching and the tilting of a vortex due to the velocity gradients, the vortex dilatation term(ω⋅∇)Vcomes from the volumetric expansion/contraction, and the baroclinic torque (∇ρm×∇p)/ρm2represents the generation of vorticity due to the misaligned pressure and the density gradients. The last term on the right side indicates the viscous diffusion of the vorticity, and it can be neglected in a high Reynolds number flow[34].
Figure 7 presents the predicted vapor volume fraction and the contours of the terms of the vortex stretching, the vortex dilatation and the baroclinic torque at one typical cycle as in Fig.4. Att=1/8T, the three terms show very different levels of the vorticity transportation. The vortex stretching term is dominant near the L.E., as a thin attached cavity appears near the L.E. With the attached cavity development and the cavity shedding occurring as shown by other pictures, the vortex stretching term is always an important part due to the velocity gradients. In Figs.7(b) and 7(c), the vortex becomes thicker with the increase of the length of the attached cavity, and the interface of the vapor and the liquid has a larger magnitude than in the other area of the vortex dilatation term. When the re-entrant jet develops towards the L.E., a cavity shedding occurs. At the same time, in Figs.7(e)-7(h), the vortex dilatetion term becomes much more significant than that in Figs.7(b) and 7(c), due to the fact that the local density changes dramatically. It is equal to zero in the non-cavitation region without the volumetric expansion/contraction. Although it is not so remarkable as compared with the vortex stretching and dilatation terms, the baroclinic torque term is very important that it might be the main mechanism for the production of the cavitating vortex as illustrated by Ji et al.[21]. These pictures show the strong correlation between the cavitation and the vortex, and more details and the mechanism might be found in a future research.
2.3The cavitating flow structure and the turbulencecavitation interactions
The normalized ensemble averaged velocity and Reynolds stress may illustrate the features of the turbulence cavitating flow structure more directly. The measured and predicted normalized ensemble averaged amplitudes of the axial velocity are compared at the selected monitoring locations along the foil, as shown in Fig.8. It can be seen that the numerical predictions are in good agreement with the experimental results, although the differences increase near the trailing edge (x/C=0.8)due to the sheet cavity shedding and the complicated vortex. The vertical location indicates that the velocity increases to the normal value. It can be seen that the vertical location moves upward with the selected monitoring locations approaching the trailing edge, which shows that the thickness of the boundary layer significantly increases due to the unsteady cavitation. Note that the normalized ensemble averaged velocity is negative near the foil face in Figs.8(a) and 8(b), and the height that the velocityis negative increases clearly in Figs.8(c) and 8(d), namely, there is an apparent re-entrant jet due to the adverse pressure gradient.

Fig.8 Comparisons of the measured and predicted normalized ensemble averaged amplitudes of the axial velocity at the selected monitoring locations along the foil.σ=0.8,α=8o,=10 m/s
The running average of the Reynolds stress is shown in Fig.9, where the Points A and B denote the locationsx/C=0.4andx/C=0.8, respectively, as shown in Fig.10(a). It can be seen that the convergence is achieved after 6 000 samples. These data also suggest that the magnitudes of the Reynolds stress remain little fluctuanted after the convergence, but this does not affect the turbulent flow features to be determined in Fig.10. Figure 10 shows the distributions of the normal Reynolds stressesu′u′andv′v′, and the shear Reynolds stressu′v′, whereu′andv′are the horizontal and vertical components of the turbulent velocity fluctuations.
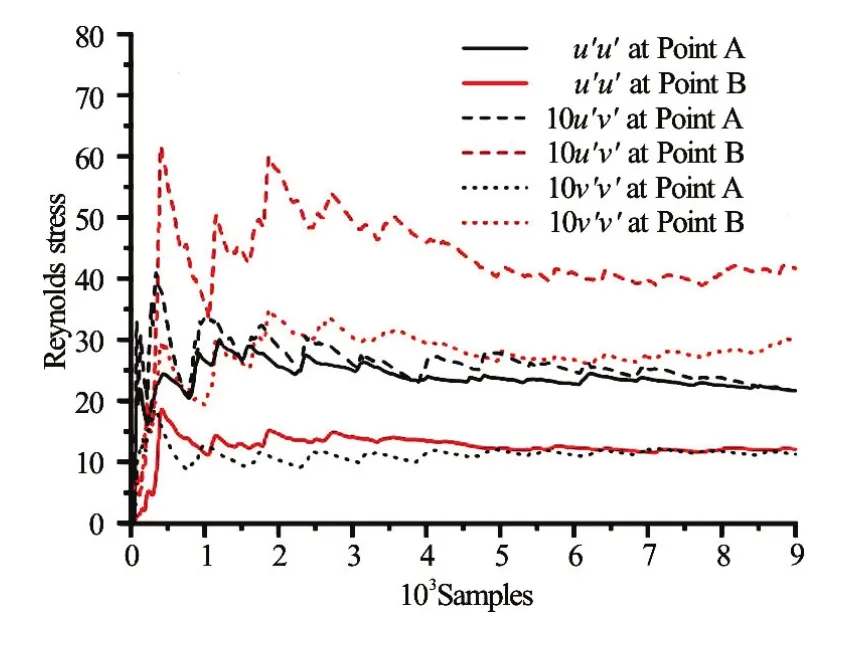
Fig.9 (Color online) Running average of Reynolds stress at random sample points at selected locations along the foil.σ=0.8,α=8o,U∞=10 m/s
As seen in Fig.10, the magnitudes of the normal and shear Reynolds stresses are significantly higher around the suction side than in other area. This indicates that the turbulence velocity fluctuations mainly locate in the region where the cavity exists. The turbulence in the region away from the hydrofoil is small. It is interesting to note that the horizontal and vertical Reynolds stresses show completely different distributions along the foil face and in the wake. In Fig.10(a), the horizontal Reynolds stress′is dominant above the foil face, as is demonstrated in Fig.9 that the magnitude of Reynolds stress′at Point A is clearly larger than that at Point B. It can be seen that the turbulence velocity fluctuations are restricted to a narrow height range in the vertical direction. This shows that the detached cavity is only formed for a short time and is not transformed into a large-scale cavity structure as shown in Fig.5. Therefore, the turbulent fluctuation is restricted to a small area. Conversely, the vertical Reynolds stress shows its predominance in the wake over other area in Fig.10(c). This indicates that the shedding of the sheet cavity and the horse-shaped vortex structure produce a high turbulence fluctuation in the wake. Note that in the cavityclosure and the downstream regions, there is a remarkable increase of the turbulence as is seen in Figs.10(a)-10(c). Again, this strongly illustrates that the cloud cavity and the large-scale vortex structure in the wake are the cause of the large turbulent fluctuation. The similar conclusions were reached by Laberteaux and Ceccio[42]. Therefore, the turbulence level of the flow is clearly related to the cavitation. The turbulence velocity fluctuation is greatly influenced by the cavity shedding and the vortex structures.
Fig.10 (Color online) Distributions of Reynolds stresses.σ= 0.8,α=8o,=10 m/s
3. Conclusions
The LES coupled with a homogeneous cavitation model is carried out for the unsteady turbulent attached cavitating flow around a Clark-Y hydrofoil. The quasi-periodic behaviors of the lift coefficient and the cavity volume, the evolution of the unsteady cavitation, the cavity vortex structure, the cavitating flow structure and the turbulence-cavitation interactions are examined. The main conclusions are as follows:
(1) The predicted lift coefficient and the cavity volume show a distinct quasi-periodic process with the cavitation shedding and they vary dramatically as the pressure distribution changes sharply by the sheet cavity shedding. The LES results of the cavity volume are generally in good agreement with the experiment measured values.
(2) The time evolution of the unsteady cavitation predicted with the LES method is in good agreement with the experimental results, which shows that the LES method can accurately capture the features of the unsteady cavitation transient behavior. The vortex shape based on theQ-criterion is much more complicated than the vapor volume fraction. The horseshoe-shaped structure is generated after the cavity shedding due to the re-entrant jet, and the horseshoeshaped structure can roll down along the suction face of the hydrofoil and slide towards the hydrofoil wake. The sheet cavity shedding and the cloud cavity have a substantial influence on the vortex structure. The largescale vortex structure gives rise to a very complex and turbulent flow. The vortex stretching term becomes much more predominant when the highly unstable cavitation becomes more severe. The baroclinic torque term is very important and it might be the main mechanism for the production of the cavitating vortex.
(3) The predicted normalized ensemble averaged amplitudes of the axial velocity are in good agreement with the measured ones. The ensemble averaged velocity shows that the attached cavitation and the cloud cavitation shedding are largely responsible for the increase of the thickness of the boundary layer. The distribution of the normalized ensemble averaged velocity shows the existence of an apparent re-entrant jet. There is a remarkable increase of the turbulence due to the cloud cavitation and the cavity vortex structure in the cavity closure and wake regions. The turbulence level of the flow is clearly related to the cavitation, and the turbulence velocity fluctuation is greatly influenced by the cavity shedding and the cloud cavitation.
The Verification is an important part in the CFD. However, there is no clear guide about the Verification in the cavitation research. Our previous paper[21]indicates that a sufficient accuracy can be obtained with a reasonable mesh resolution in a fully wetted model with the LES method. The grid effects on the cavitation remain unknown, and an inconsistent conclusion might be reached if we compare the results obtained with three different grids with the process as the ITTC standard for verification and validation in CFD (V&V in CFD)[43,44]about ship hydrodynamics. What we should do is to investigate the relationship between the subgrid-scale turbulence model and the grids. Therefore, the grid independency for the LES method is a difficult and challenging issue for us[45]. We are trying to conduct more investigations on the verification research in the cavitation study with the LES method in our future study.
[1] Luo X. W., Ji B., Tsujimoto Y. A review of cavitation inhydraulic machinery [J].Journal of Hydrodynamics, 2016, 28(3): 335-358.
[2] Huang B., Zhao Y., Wang G. Large eddy simulation of turbulent vortex-cavitation interactions in transient sheet/ cloud cavitating flow [J].Computers and Fluids, 2014, 92(3): 113-124.
[3] Wang G., Ostoja-Starzewski M. Large eddy simulation of a sheet/cloud cavitation on a NACA0015 hydrofoil [J].Applied Mathematical Modelling, 2007, 31(3): 417-447.
[4] Dai S., Younis B. A., Sun L. Large-eddy simulations of cavitation in a square surface cavity [J].Applied Mathematical Modelling, 2014, 38(23): 5665-5683.
[5] Li L., Li B., Hu Z. et al. Large eddy simulation of unsteady shedding behavior in cavitating flows with time-average validation [J].Ocean Engineering, 2016, 125: 1-11.
[6] Passandideh-Fard M., Roohi E. Coalescence collision of two droplets: bubble entrapment and the effects of important parameters [C].14th Annual (International) Mechanical Engineering Conference. Isfahan, Iran, 2006.
[7] Roohi E., Zahiri A. P., Passandideh-Fard M. Numerical simulation of cavitation around a two-dimensional hydrofoil using VOF method and LES turbulence model [J].Applied Mathematical Modelling, 2013, 37(9): 6469-6488.
[8] Gnanaskandan A., Mahesh K. Large eddy simulation of the transition from sheet to cloud cavitation over a wedge [J].International Journal of Multiphase Flow, 2016, 83: 86-102.
[9] Le Q., Franc J. P., Michel J. M. Partial cavities: Global behavior and mean pressure distribution [J].Journal of Fluids Engineering, 1993, 115(2): 243-248.
[10] Pham T. M., Larrarte F., Fruman D. H. Investigation of unsteady sheet cavitation and cloud cavitation mechanisms [J].Journal of Ffluids Engineering, 1999, 121(2): 289-296.
[11] Zhang L. X., Khoo B. C. Computations of partial and super cavitating flows using implicit pressure-based algorithm (IPA) [J].Computers and Fluids, 2013, 73: 1-9.
[12] Pendar M. R., Roohi E. Investigation of cavitation around 3D hemispherical head-form body and conical cavitators using different turbulence and cavitation models [J].Ocean Engineering, 2016, 112: 287-306.
[13] Ji B., Luo X. W., Peng X. X. et al. Three-dimensional large eddy simulation and vorticity analysis of unsteady cavitating flow around a twisted hydrofoil [J].Journal of Hydrodynamics, 2013, 25(4): 510-519.
[14] Park S., Rhee S. H. Numerical analysis of the three-dimensional cloud cavitating flow around a twisted hydrofoil [J].Fluid Dynamics Research, 2012, 45(1): 015502.
[15] Sedlar M., Ji B., Kratky T. et al. Numerical and experimental investigation of three-dimensional cavitating flow around the straight NACA2412 hydrofoil [J].Ocean Engineering, 2016, 123: 357-382.
[16] Gopalan S., Katz J. Flow structure and modeling issues in the closure region of attached cavitation [J].Physics of Fluids, 2000, 12(4): 895-911.
[17] Smagorinsky J. General circulation experiments with the primitive equations: I. The basic experiment [J].Monthly Weather Review, 1963, 91(3): 99-164.
[18] Moin P. Advances in large eddy simulation methodology for complex flows [J].International Journal of Heat and Fluid Flow, 2002, 23(5): 710-720.
[19] Piomelli U. Large-eddy simulation: Achievements and challenges [J].Progress in Aerospace Sciences, 1999, 35(4): 335-362.
[20] Luo X. W., Ji B., Peng X. X. et al. Numerical simulation of cavity shedding from a three-dimensional twisted hydrofoil and induced pressure fluctuation by large-eddy simulation [J].Journal of Fluids Engineering, 2012, 134(4): 379-389.
[21] Ji B., Luo X. W., Arndt R. E. A. et al. Large eddy simulation and theoretical investigations of the transient cavitating vortical flow structure around a NACA66 hydrofoil [J].International Journal of Multiphase Flow, 2015, 68: 121-134.
[22] Dreyer M., Decaix J., Münch-Alligné C. et al. Mind the gap: A new insight into the tip leakage vortex using stereo-PIV [J].Experiments in Fluids, 2014, 55(11): 1-13.
[23] Peng X. X., Ji B., Cao Y. et al. Combined experimental observation and numerical simulation of the cloud cavitation with U-type flow structures on hydrofoils [J].International Journal of Multiphase Flow, 2016, 79: 10-22.
[24] Hunt J. C. R., Wray A. A., Moin P. Eddies, streams, convergence zones in turbulent flows [C].Proceedings of the Summer Program 1988 in its Studying Turbulence Using Numerical Simulation Databases. California, USA, 1988, 2: 193-208.
[25] Kravtsova A. Y., Markovich D. M., Pervunin K. S. et al. High-speed visualization and PIV measurements of cavitating flows around a semi-circular leading-edge flat plate and NACA0015 hydrofoil [J].International Journal of Multiphase Flow, 2014, 60: 119-134.
[26] Yu X., Huang C., Du T. et al. Study of characteristics of cloud cavity around axisymmetric projectile by large eddy simulation [J].Journal of Fluids Engineering, 2014, 136(5): 051303.
[27] Roohi E., Pendar M. R., Rahimi A. Simulation of threedimensional cavitation behind a disk using various turbulence and mass transfer models [J].Applied Mathematical Modelling, 2016, 40(1): 542-564.
[28] Wang Y., Wu X., Huang C. et al. Unsteady characteristics of cloud cavitating flow near the free surface around an axisymmetric projectile [J].International Journal of Multiphase Flow, 2016, 85: 48-56.
[29] Park S., Rhee S. H. Comparative study of incompressible and isothermal compressible flow solvers for cavitating flow dynamics [J].Journal of Mechanical Science and Technology, 2015, 29(8): 3287-3296.
[30] Chen G., Wang G., Hu C. et al. Combined experimental and computational investigation of cavitation evolution and excited pressure fluctuation in a convergent–divergent channel [J].International Journal of Multiphase Flow, 2015, 72: 133-140.
[31] Ji B., Luo X., Wu Y. et al. Numerical investigation of three-dimensional cavitation evolution and excited pressure fluctuations around a twisted hydrofoil [J].Journal of Mechanical Science and Technology, 2014, 28(7): 2659-2668.
[32] Huang B., Young Y. L., Wang G. et al. Combined experimental and computational investigation of unsteady structure of sheet/cloud cavitation [J].Journal of Fluids Engineering, 2013, 135(7): 071301.
[33] Iyer C. O., Ceccio S. L. The influence of developed cavitation on the flow of a turbulent shear layer [J].Physics of Fluids, 2002, 14(10): 3414-3431.
[34] Dittakavi N., Chunekar A., Frankel S. Large eddy simulation of turbulent-cavitation interactions in a Venturi nozzle [J].Journal of Fluids Engineering, 2010, 132(12): 121301.
[35] Decaix J., Goncalvès E. Investigation of three-dimensional effects on a cavitating Venturi flow [J].International Journal of Heat and Fluid Flow, 2013, 44: 576-595.
[36] Schnerr G. H., Sauer J. Physical and numerical modelingof unsteady cavitation dynamics[C].Fourth International Conference on Multiphase Flow. New Orleans, USA, 2001.
[37] Nicoud F., Ducros F. Subgrid-scale stress modelling based on the square of the velocity gradient tensor [J].Flow Turbulence and Combustion, 1999, 62(3):183-200.
[38] Sagaut P., Lee Y. T. Large eddy simulation for incompressible Flows: An introduction. scientific computation series [J].Applied Mechanics Reviews, 2002, 55(6): 1745-1746.
[39] Barth T. J., Jespersen D. C. The design and application of upwind schemes on unstructured meshes [C].27th Aerospace Sciences Meeting, Reno, NV, USA, 1989.
[40] Wang G., Senocak I., Shyy W. et al. Dynamics of attached turbulent cavitating flow [J].Progress in Aerospace Sciences, 2001, 37(6): 551-581.
[41] Huang B. Physical and numerical investigation of unsteady cavitating fl ows [D]. Doctoral Thesis, Beijing, China: Beijing Institute of Technology, 2012(in Chinese).
[42] Laberteaux K. R., Ceccio S. L. Partial cavity flows. Part 1. Cavities forming on models without spanwise variation [J].Journal of Fluid Mechanics, 2001, 431: 1-41.
[43] ITTC QM Procedure. Uncertainty analysis in CFD verification and validation methodology and procedures [R]. 7.5-03-01-01, 2002.
[44] ITTC QM Procedure. Uncertainty analysis in CFD, examples for resistance and flow [R]. 7.5-03-02-01, 2002.
[45] Xing T. A general framework for verification and validation of large eddy simulations [J].Journal of Hydrodynamics, 2015, 27(2): 163-175.
* Project supported by the National Natural Science Foundation of China (Grant Nos. 51576143, 11472197).
Biography:Bin Ji (1982-), Male, Ph. D., Associate Professor
Xin-ping Long, E-mail:xplong@whu.edu.cn
猜你喜欢
杂志排行

水动力学研究与进展 B辑的其它文章
- Journal of Hydrodynamics, Vol. 28 Annual Classified Catalog (2016)
- Numerical study of the flow and dilution behaviors of round buoyant jet in counterflow*
- Numerical simulation of flow through circular array of cylinders using porous media approach with non-constant local inertial resistance coefficient*
- Numerical estimation of bank-propeller-hull interaction effect on ship manoeuvring using CFD method*
- Insoluble additives for enhancing a blood-like liquid flow in micro-channels*
- Entropy generation analysis for the peristaltic flow of Cu-water nanofluid in a tube with viscous dissipation*