Roles of microRNAs in immunopathogenesis of non-alcoholic fatty liver disease revealed by integrated analysis of microRNA and mRNA expression profles
2017-02-10
Beijing, China
Roles of microRNAs in immunopathogenesis of non-alcoholic fatty liver disease revealed by integrated analysis of microRNA and mRNA expression profles
Yu-Jun Zhang, Ying Hu, Jing Li, Yu-Jing Chi, Wei-Wei Jiang, Feng Zhang and Yu-Lan Liu
Beijing, China
BACKGROUND: The integrative analysis of microRNA and mRNA expression profles can elucidate microRNA-targeted gene function. We used this technique to elucidate insights into the immunological pathology of non-alcoholic fatty liver disease (NAFLD).
METHODS: We analyzed differentially expressed microRNA and mRNA expression profles of CD4+T lymphocytes from the liver and mesenteric lymph nodes (MLNs) of mice with NAFLD using microarrays and RNA sequencing. Normal mice were used as controls. The target genes of microRNAs were predicted by TargetScan. Integrative analysis showed that the mRNAs were overlapped with microRNAs. Furthermore, the Gene Ontology (GO) and Kyoto Encyclopedia of Genes and Genomes (KEGG) analyses were performed to predict the key genes and pathways. Then, 16 microRNAs and 10 mRNAs were validated by qRT-PCR.
RESULTS: Microarray analysis suggested that 170 microRNAs were signifcantly de-regulated in CD4+T lymphocytes from the liver between the two groups. Eighty mRNAs corresponded with microRNA targeted genes. KEGG analysis indicated that the MAPK pathway was consistently augmented in the liver of NAFLD mice. miR-23b, let-7e, miR-128 and miR-130b possibly played signifcant parts in the MAPK pathways. Furthermore, between the two groups, 237 microRNAs were signifcantly deregulated in CD4+T lymphocytes from MLNs. 38 mRNAs co-incided with microRNA target genes. The metabolic pathway was consistently enriched in the MLNs of NAFLD mice. miR-206-3p, miR-181a-5p, miR-29c-3p and miR-30d-5p likely play important roles in the regulation of metabolic pathways.
CONCLUSION: The results of this study presented a new perspective on the application of integrative analysis to identify complex regulation means involved in the immunological pathogenesis of NAFLD.
(Hepatobiliary Pancreat Dis Int 2017;16:65-79)
microRNA-mRNA;
gut;
non-alcoholic fatty liver disease;
CD4+T lymphocytes;
immunopathogenesis
Introduction
Non-alcoholic fatty liver disease (NAFLD) is characterized by a broad array of pathological lesions from simple liver steatosis to non-alcoholic steatohepatitis (NASH), liver cirrhosis, and hepatocellular carcinoma. The key features of NAFLD include insulin resistance and liver infammation.[1]Tilg and Moschen[2]proposed the “multiple hits” NAFLD pathogenesis model, which suggested that gut-derived factors and adipose tissue could promote liver infammation.
Immune cells derived from the gut and cytokines transported to the liver by the portal vein can regulate intrahepatic immune reactions. We found that CD4/ CD8 ratios in the peripheral blood mononuclear cells and Peyer's patches of high fat diet rats were augmented at the 4th week and decreased at the 8th week. However, on the 12th week, the CD4/CD8 ratio within the Peyer's patches increased to levels observed in the 4th week.[3]We also found that the activated CD4+T cellswere increased in the mesenteric lymph nodes (MLNs) of NAFLD mice. The gut-derived lymphocytes from NAFLD have a tendency to travel to the liver and induce liver injury, and fatty liver stimulates the relocation of gut-derived lymphocytes.[4]
The liver itself demonstrates immune properties that can be considered as an “immunological organ”.[5-7]The immune responses in NAFLD involve CD4+T-helper cells. Recent data recommended that its pathogenesis may be predisposed by an imbalance between the surplus of proinfammatory T-helper1 cytokines and the defcit of anti-infammatory IL-4 and IL-10 cytokines.[8]
Recent studies[9,10]have specifed that the microRNAs hepatic expression profle is considerably diverse in subjects with NASH versus controls with regular liver histology. microRNAs comprise an imperative class of highly preserved non-coding RNAs that hinder the protein expression of their target genes through the process variation in the mRNA translation rate and/or stability.[11]The developing role of microRNAs as a signifcant player in adipocyte differentiation, hepatic metabolic functions, insulin resistance and NAFLD pathogenesis advocates some specifc microRNAs as potential diagnostic and prognostic markers.[12,13]There is an alteration in the microRNA signature that may underlie the metabolic changes, resulting in the initial formation of hepatic steatosis and the subsequent development of NASH. In this study, we aimed to apply an integrative molecular and bioinformatics approach by concurrently profling both microRNA and mRNA for CD4+T lymphocytes of the liver and MLNs in NAFLD mice to examine the immunological pathogenesis of NAFLD.
Methods
Animal experiments
Wild-type C57BL/6 male mice (7 weeks old) were purchased from the Chinese Academy of Military Medical Sciences. The NAFLD model was induced by feeding mice with a high-fat diet (Diet#MD 45% fat, 35% carbohydrate, 20% protein, Medicience Ltd.) for 12 weeks; mice fed with a normal-fat diet (Diet#MD 10% fat, 70% carbohydrate, 20% protein, Medicience Ltd.) were used as controls.[14]Their weight was measured every week. The mice were sacrifced by isofurane overdose. After perfusion with phosphate-buffered saline (PBS), the liver and MLNs were aseptically removed and placed in cold PBS. Part of the liver was embedded with paraffn as previously described.[15]Paraffn sections were stained with hematoxylin-eosin (HE). The animal experiments were approved by the Institutional Animal Care and Use Committee of Peking University People's Hospital.
Cell isolation
The hepatic mononuclear cells (HMNCs) were isolated by the method described previously.[16]Briefy, after perfusion with PBS, mouse liver was pressed through a 70-μm cell strainer (BD Falcon). Cell suspensions were washed twice with PBS, and HMNCs were separated from parenchymal cells by Percoll (GE Healthcare) sedimentation. Liver cells were pelleted and re-suspended in 4 mL of 40% Percoll and then layered onto 4 mL of 80% Percoll and centrifuged for 25 minutes at 750 g. HMNCs at the interface were collected and washed twice with PBS. The MLNs were isolated, pressed through 70-μm cell strainers and then washed twice. After that the cell suspensions were fltered twice using 40-μm cell strainers and MLN cells were collected and washed. HMNCs and MLN cells were sequestered and tarnished with fuorochrome-conjugated antibodies against CD4. After washing, CD4+T cells were arranged using the FACSAria II fow cytometer. Since the number of cells from one mouse is limited, we pooled the RNA of CD4+T cells from 6 mice equally into one pool to do further experiments.
microRNA microarray
Total RNA was isolated from two sets of CD4+T lymphocytes of liver from NAFLD mice and controls. Additionally, MLNs were harvested using TRIzol (Invitrogen) and then sterilized by means of the mirVana microRNA isolation kit (Agilent) according to the manufacturer's instructions. The concentration and purity of the total RNA were calculated by the NanoDrop ND 1000 at 260 and 280 nm (A260/280) and confrmed by gel electrophoresis. Each RNA sample was stamped using the microRNA Complete Labeling and Hyb Kit and crossbred on the Agilent mouse microRNA microarray, Release 18.0, 8×60K (Agilent), which contained probes for 1700 mature microRNAs. Imaging was performed with the Agilent microarray scanner. Agilent feature extraction (v10.7) was used to interpret the crude intensity of the image.
RNA profling
Total RNA was harvested as described above. To identify the changes of mRNA transcription level among different groups, we performed RNA profling by Illumina HiSeq 2000. The cDNA library of RNA profling was constructed according to RNA Seq Library Preparation Kit for RNA Profling (Gnomegen). Twenty to 30 nucleotide read length were sequenced (very 3' end close to polyA). A 36 nucleotides read could comfortably include an index read. The original data of sequencing was 50M per sample. Those with a greater than a 2-fold increase or a 2-fold decrease in expression in two samples wereconsidered signifcantly changed.
Gene ontology (GO) and pathway analysis
GO analysis was used to organize the differentially expressed genes in hierarchical categories and elucidate the gene regulatory networks of the biological process and molecular function. The two-side Fisher's exact test and the Chi-square test were used to classify the GO category. The false discovery rate (FDR) was calculated to correctPvalue. Pathway analysis was used to fnd the signifcant pathway of the differential genes according to the Kyoto Encyclopedia of Genes and Genomes (KEGG), Fisher's exact test and the Chi-square test were used to select the signifcant pathway, and the threshold of significance was defned byPvalue and FDR. The enrichment Re was calculated like the equation above. The center of the pathway network was represented by degree. The degrees represented the individual impact of one pathway to the pathways or around.
The integrative analysis of microRNA target genes
The differentially expressed microRNAs were chosen for target calculation using the TargetScan. To increase the accuracy of target calculation, the analysis of differentially expressed mRNA using RNA Seq with the target prediction of the differentially expressed microRNAs was further incorporated. We found that the intersecting gene expression inversely correlated with the microRNAs. Then, we performed the subsequent bioinformatic analysis.
microRNA-gene-network
We used the method of graph theory to uncover the regulatory roles of microRNA and genes in the system. The standard of evaluation was based on the degree of microRNA and genes in the system. The degree represents the amount of microRNA regulated targeted genes in the system. The greater the degree, the greater the microRNA regulated target genes. Moreover, the circles signifed the genes, and squares signifed microRNAs. Additionally, their relationship was symbolized by one track in the microRNA-gene-network. The focus of the system is represented by a degree, which is the involvement of one microRNA to the genes surrounding it or the involvement of one gene to the microRNAs around it. The key microRNA and genes in the system always have the maximum degree.[17,18]The system of microRNA-mRNA interactions representing the crucial microRNAs and their targets was recognized according to the microRNAs grade.
microRNA-pathway-network
The microRNA-pathway-network was developed corresponding to the relationship of important pathways and genes and their associations among microRNA.[19-21]The focus of the system was represented by degrees. The degrees signifed the individual involvement of one microRNA or pathway to the pathways or microRNAs surrounding it. The key microRNA and pathway in the system had the maximum degrees.
microRNA isolation and qRT-PCR of microRNAs
Five pools of CD4+T cells from 30 mice were further verifed. The overall RNA isolation and a minor RNA augmentation procedure were performed with the miRNeasy RNA Isolation Kit (QIAGEN) according to the manufacturer's guidelines. RNA strength and integrity were constrained by the NanoDrop ND 1000. RNA reliability was substantiated by using 1% agarose electrophoresis; small RNAs were checked and confrmed using 3.5% NuSieve agarose electrophoresis (Cambrex). The RNA (1 μg) was polyadenylated with ATP by a polyA polymerase kit. RNAs were dissolved in diethylpyrocarbonate-treated water and reverse-transcribed with an MMLV Reverse Transcriptase and an anchored oligo dT RT primer with a 40 nt augmentation at the 5' end according to the manufacturer's instruction for the First-strand cDNA Synthesis Kit for microRNA (Origene). qRT-PCR was accomplished using a SYBR Green Rea1-time PCR Master Mix kit (Toyobo) on the Opticon 2 (BioRad) with the temperature gradient purpose, as published previously.[22,23]
Statistical analysis
All data were calculated using SPSS version 16.0 (SPSS Inc.). The continuous variables are expressed as mean ± SD. Categorical variables are expressed as frequencies, percentages or both. An unsupervised hierarchical clustering was accomplished on microarray data. Two-sided Fisher's exact test and the Chi-square test were used to classify the GO category, and the FDR was calculated to correct thePvalue. We chose only the GOs that hadPvalues <0.01.The level of signifcance was expressed by thePvalue and FDR. The screening criterion wasP<0.05. The signifcance of differentially expressed microRNAs of microarray data was analyzed through a Welch two samples Student'sttest, aPvalue of 0.05 or lower was used for statistical signifcance. Statistical differences were assessed by the Mann-WhitneyUtest between the 2 groups;Pvalues <0.05 were considered signifcant.
Results
NAFLD mouse model

Fig. 1. High-fat diet-induced NAFLD mouse model. A: The body weights of mice fed with high-fat diet were increased signifcantly compared with mice fed with normal-diet from 4 to 12 weeks (*:P<0.05); B: HE staining indicated that fatty changes in the livers of mice fed with high-fat diet 12 weeks.
HE-stained slides showed mild to severe steatosis in the livers of mice receiving a high intake of fat diet (Fig. 1). This proves that feeding mice with a high intake of fat diet for 12 weeks could successfully induce a NAFLD.
RNA profling analysis
The RNA profling showed that 1317 mRNAs were differentially expressed, comprising of 612 down-regulated mRNAs and 705 up-regulated mRNAs in CD4+T lymphocytes of the liver from NAFLD mice compared to that from control mice. Moreover, 749 mRNAs were differentially expressed, comprising of 309 down-regulated mRNAs and 440 up-regulated mRNAs in CD4+T lymphocytes of MLNs in NAFLD mice relative to that in control mice.
GO analysis
The GO enrichment evaluation suggested that the down-regulated genes regulated 17 GOs, and the upregulated genes regulated 25 GOs signifcantly in CD4+T lymphocytes of the liver from NAFLD mice relative to that from control mice. The main GO groups directed by the up-regulated genes included infammatory response, innate immune response, apoptosis, response to virus, chemotaxis, acute-phase response, etc. Consequently, noteworthy GOs resembling the down-regulated genes comprised transport, endocytosis, oxidation-reduction processes, neuron differentiation, etc. (Fig. 2). The down-regulated genes regulated the 10 GOs, and the up-regulated genes regulated the 24 GOs signifcantly in the CD4+T lymphocytes of MLNs in NAFLD mice relative to that in control mice. The main GO classes targeted by the up-regulated genes involved infammatory response, response to virus, apoptosis, innate immune response, response to stress, chemotaxis, etc. In comparison, signifcant GOs tallying the down-regulated genes included lipid biosynthetic processes, Wnt receptor signaling pathways, lipid metabolic processes, etc. (Fig. 3).

Fig. 2. Signifcantly changed GO of differentially expressed genes in CD4+T cells from the liver of NAFLD mice relative to control mice. A: The up GOs in CD4+T cells from the liver of NAFLD mice; B: The down GOs in CD4+T cells from the liver of NAFLD mice. The larger -LgPsuggested a smallerPvalue.
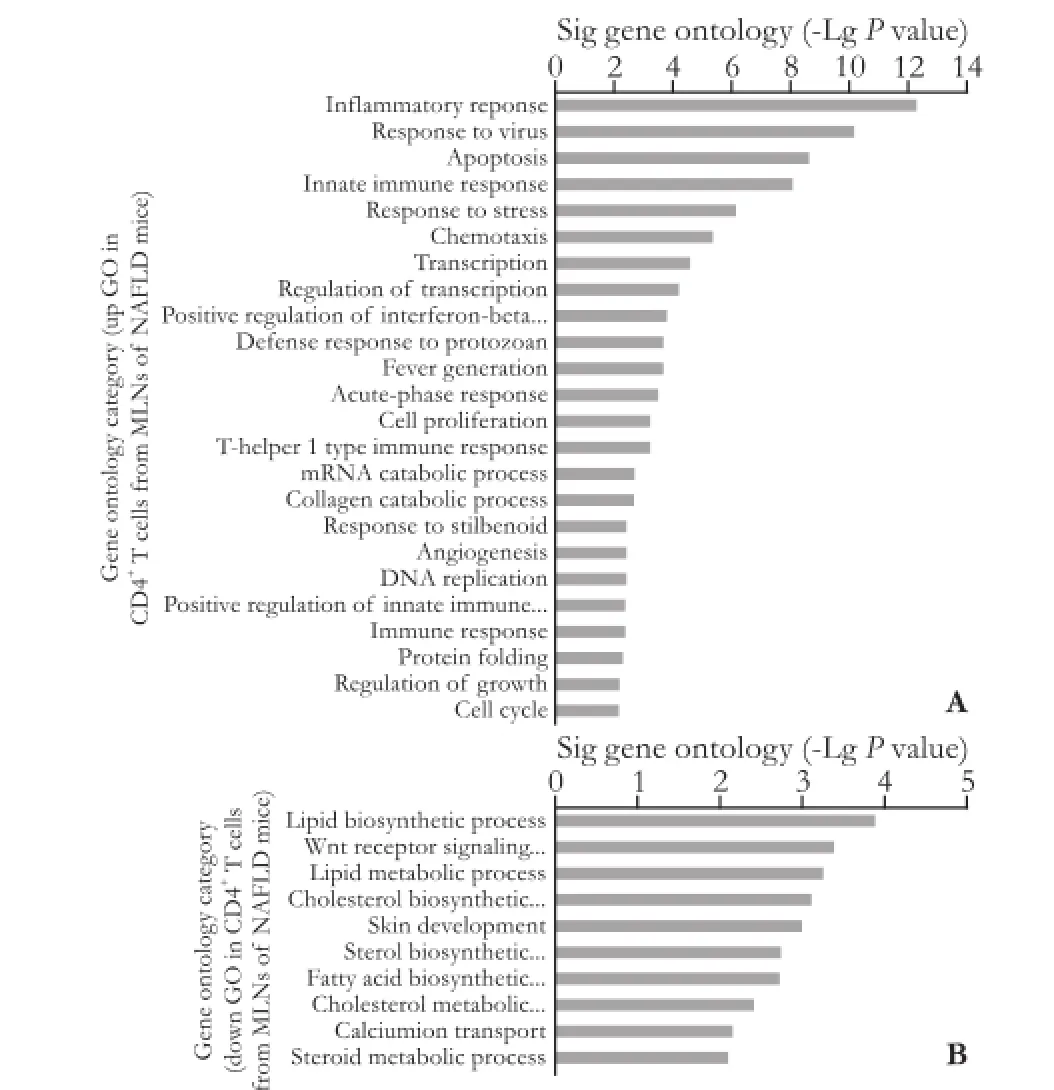
Fig. 3. Signifcantly changed GO of differentially expressed genes in CD4+T cells from the MLNs of NAFLD mice relative to control mice. A: The up GOs in CD4+T cells from the MLNs of NAFLD mice; B: The down GOs in CD4+T cells from the MLNs of NAFLD mice. The larger -LgPsuggested a smallerPvalue.
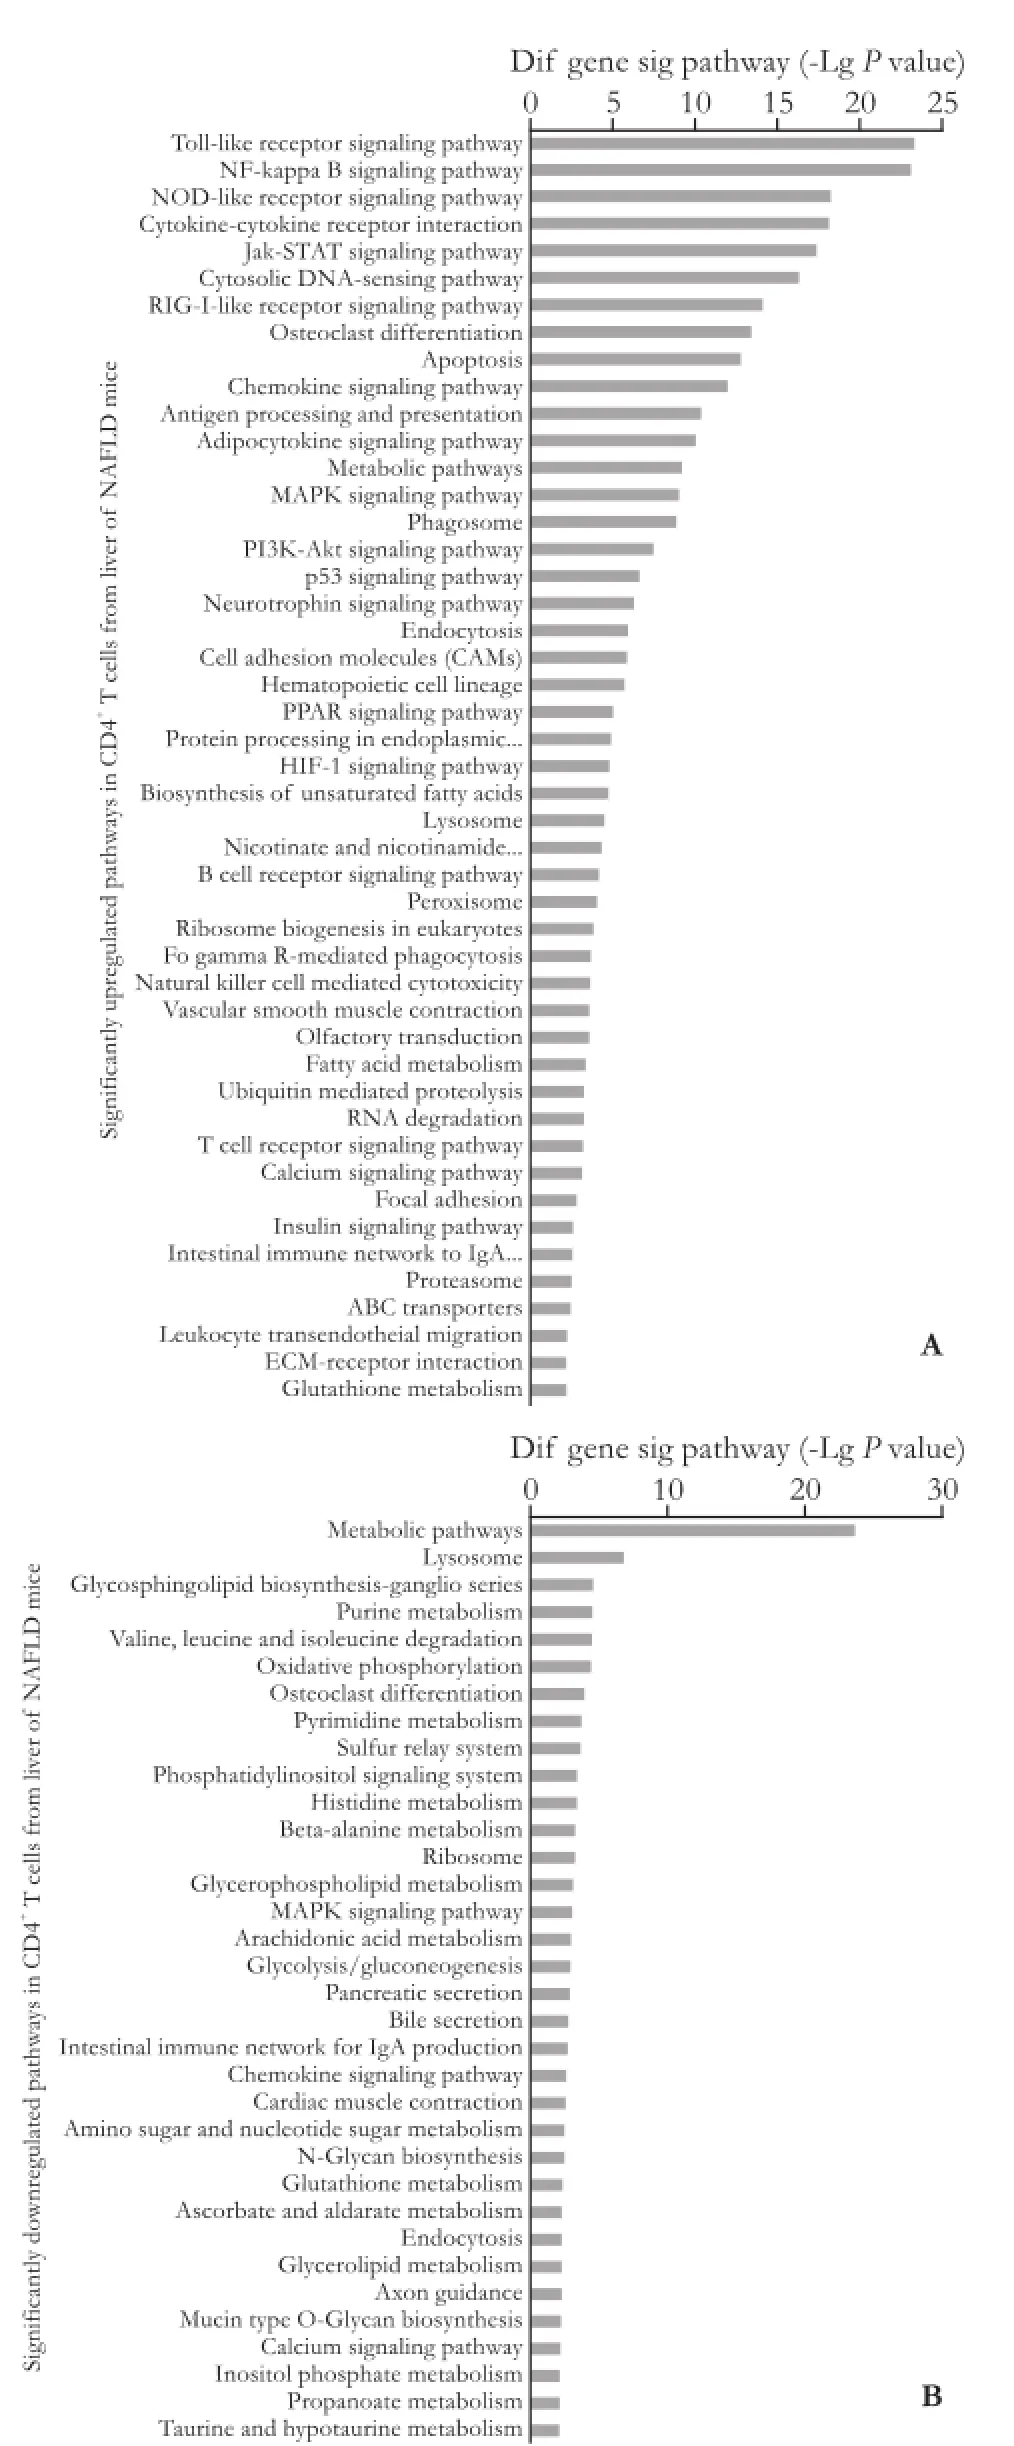
Fig. 4. Significantly changed pathways in CD4+T cells from the liver of NAFLD mice relative to control mice. A: Significantly up-regulated pathways in CD4+T cells from the liver of NAFLD mice; B: Significantly down-regulated pathways in CD4+T cells from the liver of NAFLD mice. Pathway analysis was used to fnd out the signifcant pathway of the differential genes according to KEGG, Biocarta and Reactome. The threshold of signifcance was defned byPvalue and FDR. The screening criterion wasP<0.05. The larger -LgPsuggested a smallerPvalue.
KEGG pathway analysis
KEGG pathway evaluation for up-regulated genes in CD4+T lymphocytes from the liver exhibited that thegenes were mainly implicated in numerous passages: a Toll-like receptor beckoning passage, a NF-kappa B beckoning passage, a NOD-like receptor beckoning passage, cytokine-cytokine receptor interaction, Jak-STAT signaling pathways, osteoclast discrimination, apoptosis, a chemokine signaling pathway, antigen processing, etc. (Fig. 4). The KEGG passage evaluation for down-regulated genes in CD4+T lymphocytes from the liver suggested that the genes were most related to the following pathways: metabolic pathways, lysosomes, glycosphingolipid biosynthesis, purine metabolism, valine, leucine and isoleucine degradation, oxidative phosphorylation, osteoclast differentiation, etc. (Fig. 4). We performed a path-net analysis to generate an interactive network covering 67 signifcantly changed pathways (Table 1 and Fig. 5). The MAPK signaling pathway (degree=13) and apoptosis (degree=10) showed the highest degrees, suggesting that these two pathways played a core role in the immunologic response of CD4+T lymphocytes from the liver. KEGG pathway evaluation for up-regulated genes in CD4+T lymphocytes from MLNs suggested that the genes were mainly implicated in several pathways: NF-kappa B signaling pathways, cytokine-cytokine receptor interactions, cytologic DNA-sensing pathways, Toll-like receptor signaling pathways, MAPK signaling pathways, NOD-like receptor signaling pathways, osteoclast differentiation, RIG-I-like receptor signaling pathways, and Jak-STAT signaling pathways (Fig. 6). KEGG pathway analysis for down-regulated genes in CD4+T lymphocytes from MLNs revealed that the genes were most linked to the following pathways: metabolic pathways, retrograde endocannabinoid signaling, lysosomes, intes-tinal immune networks for IgA production, Wnt signaling pathways, circadian entrainment, cholinergic synapse, glutamatergic synapse, bile secretion, and chemokine signaling pathways (Fig. 6). We performed a path-net analysis to generate an interactive network covering 48 signifcantly changed pathways. The MAPK signaling pathway (degree=11) and apoptosis (degree=9) showed the highest degrees, suggesting that these two pathways have a core role in the immunologic response of CD4+T lymphocytes from MLNs (Table 2 and Fig. 7).

Table 1. Pathway-network analysis of signifcantly changed pathways in CD4+T cells from the liver of NALFD mice
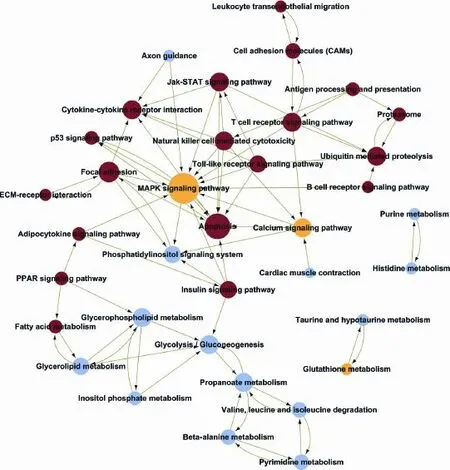
Fig. 5. Pathway-network analysis of signifcantly changed pathways in CD4+T cells from the liver of NAFLD mice. The path-net was the interaction net of the signifcant pathways of the differential expression genes, and was built according to the interaction among pathways of the KEGG database to fnd the interaction among the signifcant pathways directly and systemically. The pathway in network was weighed by counting its interacted pathways, which was shown as degree. A higher degree of pathway indicated that the pathway may play a vital role in the network. The red circles represent the up-regulated pathway. The blue circles represent the down-regulated pathway. The yellow circles represent both the up-regulated and down-regulated pathways. The lines indicate the interaction between the pathways.

Fig. 6. Significantly changed pathways in CD4+T cells from the MLNs of NAFLD mice relative to control mice. A: Significantly up-regulated pathways in CD4+T cells from the MLNs of NAFLD mice; B: Significantly down-regulated pathways in CD4+T cells from the MLNs of NAFLD mice. Pathway analysis was used to fnd out the signifcant pathway of the differential genes according to KEGG, Biocarta and Reactome. The threshold of signifcance was defined byPvalue and FDR. The screening criterion wasP<0.05. The larger -LgPsuggested a smallerPvalue.

Table 2. Pathway-network analysis of signifcantly changed pathways in CD4+T cells from MLNs of NAFLD mice
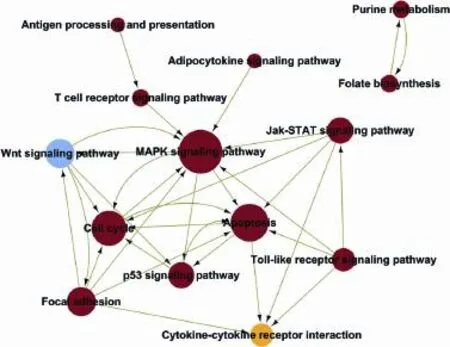
Fig. 7. Pathway-network analysis of significantly changed pathways in CD4+T cells from the MLNs of NAFLD mice. The pathnet was the interaction net of the significant pathways of the differential expression genes, and was built according to the interaction among pathways of the KEGG database to fnd the interaction among the signifcant pathways directly and systemically.

Table 3. The key microRNAs in microRNA-pathway-network of liver
microRNA array analysis and integrative identifcation of microRNA targets

Fig. 8. microRNAs are deregulated in CD4+T lymphocytes of liver and MLNs from NAFLD mice compared to that of control mice as detected by microRNA microarray. Unsupervised hierarchical cluster analysis of microRNA expression was performed. For each microRNA, yellow represents higher expression and blue represents lower expression than the average expression. HFMLCD4: CD4+T lymphocytes of the MLNs from NAFLD mice; NDMLCD4: CD4+T lymphocytes of the MLNs from control mice; NDLiCD4: CD4+T lymphocytes of the liver from control mice; HFLiCD4: CD4+T lymphocytes of the liver from NAFLD mice.
In our study, 170 (74 up-regulated and 96 downregulated) of the 1700 microRNAs (GEO accession: GSE63577) analyzed were signifcantly de-regulated in CD4+T lymphocytes of the liver from NAFLD mice relative to that of controls (Fig. 8). Furthermore, TargetScan was utilized to calculate the 5566 target genes of the 170 microRNAs to explore the biological role of these microRNAs. Among this group of genes, there are 80 overlapped target genes (42 down-regulated mRNAs and 38 up-regulated mRNAs) of 25 distinctively expressed microRNAs (Table 3). 237 (137 up-regulated and 100 down-regulated) of the 1700 microRNAs analyzed were signifcantly de-regulated in CD4+T lymphocytes of MLNs in NAFLD mice relative to that in controls (Fig. 8). The TargetScan was utilized to forecast the target genes of the 237 microRNAs that ensued in the recognition of 5843 putative target genes. Among these genes, 38 intersected with the recognized target genes of 28 distinctly expressed microRNAs, comprising 18 down-regulated mRNAs and 25 up-regulated mRNAs (Table 4).
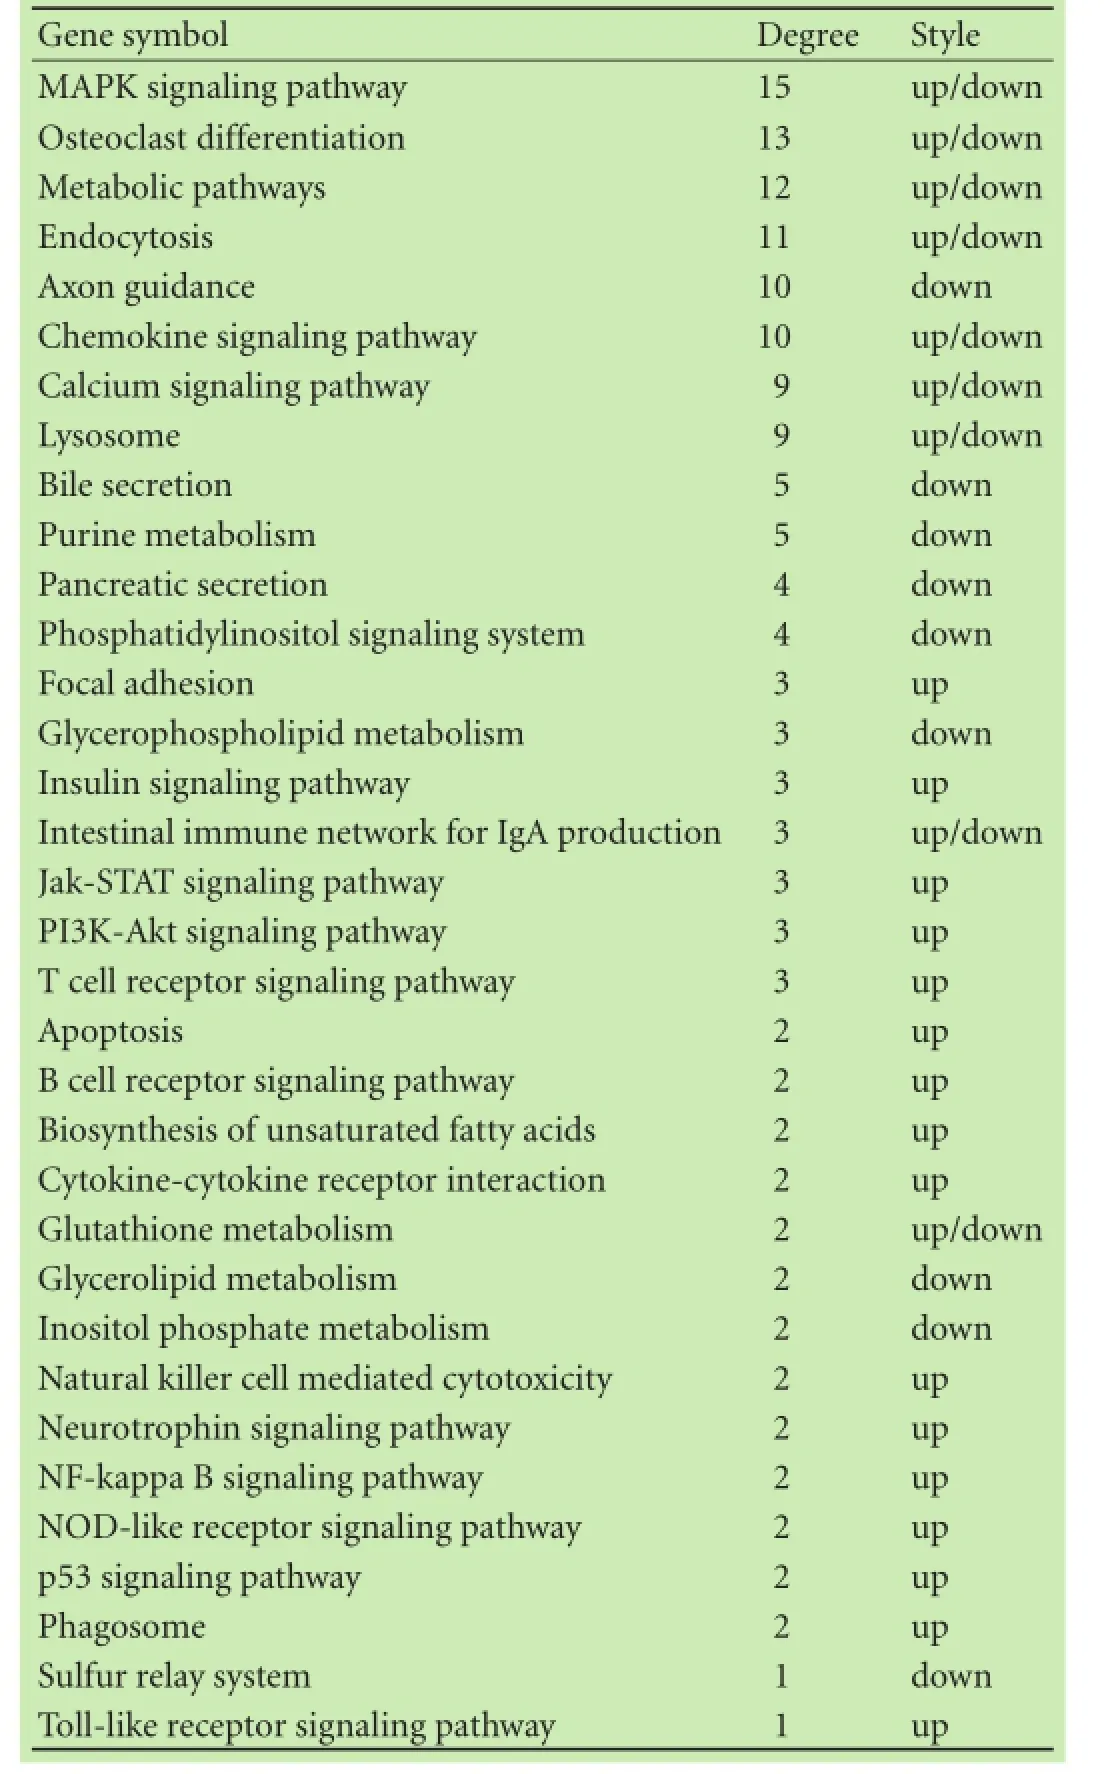
Table 4. The key pathways in microRNA-pathway-network of the liver
Identifcation of the microRNA-gene network
Depending on these microRNAs and their recognized target genes, a microRNA-gene regulatory system was originated to sketch the interactions of microRNAs and such targets. In CD4+T lymphocytes of the liver from NAFLD mice, nine microRNAs were centralized in the microRNA-gene network that had the majority of target genes (degree≥5), respectively. The degree characterized the involvement of one microRNA to the genes around it or the involvement of one gene to the microRNAs around it. The largest degrees are correlated with the key microRNA in the network. Apparently the targeted genes that had the most microRNAs (degree≥5) were Fosb, Mef2c, Ndst1 and Tgfbr1 (Fig. 9A). In CD4+T lymphocytes of MLNs in NAFLD mice, two microRNAs were centralized in the microRNA-gene network that had the maximum target genes (degree≥5), respectively. It seems that the targeted genes that had the most microRNAs (degree≥5) were Ldlr and Mgll (Fig. 9B).
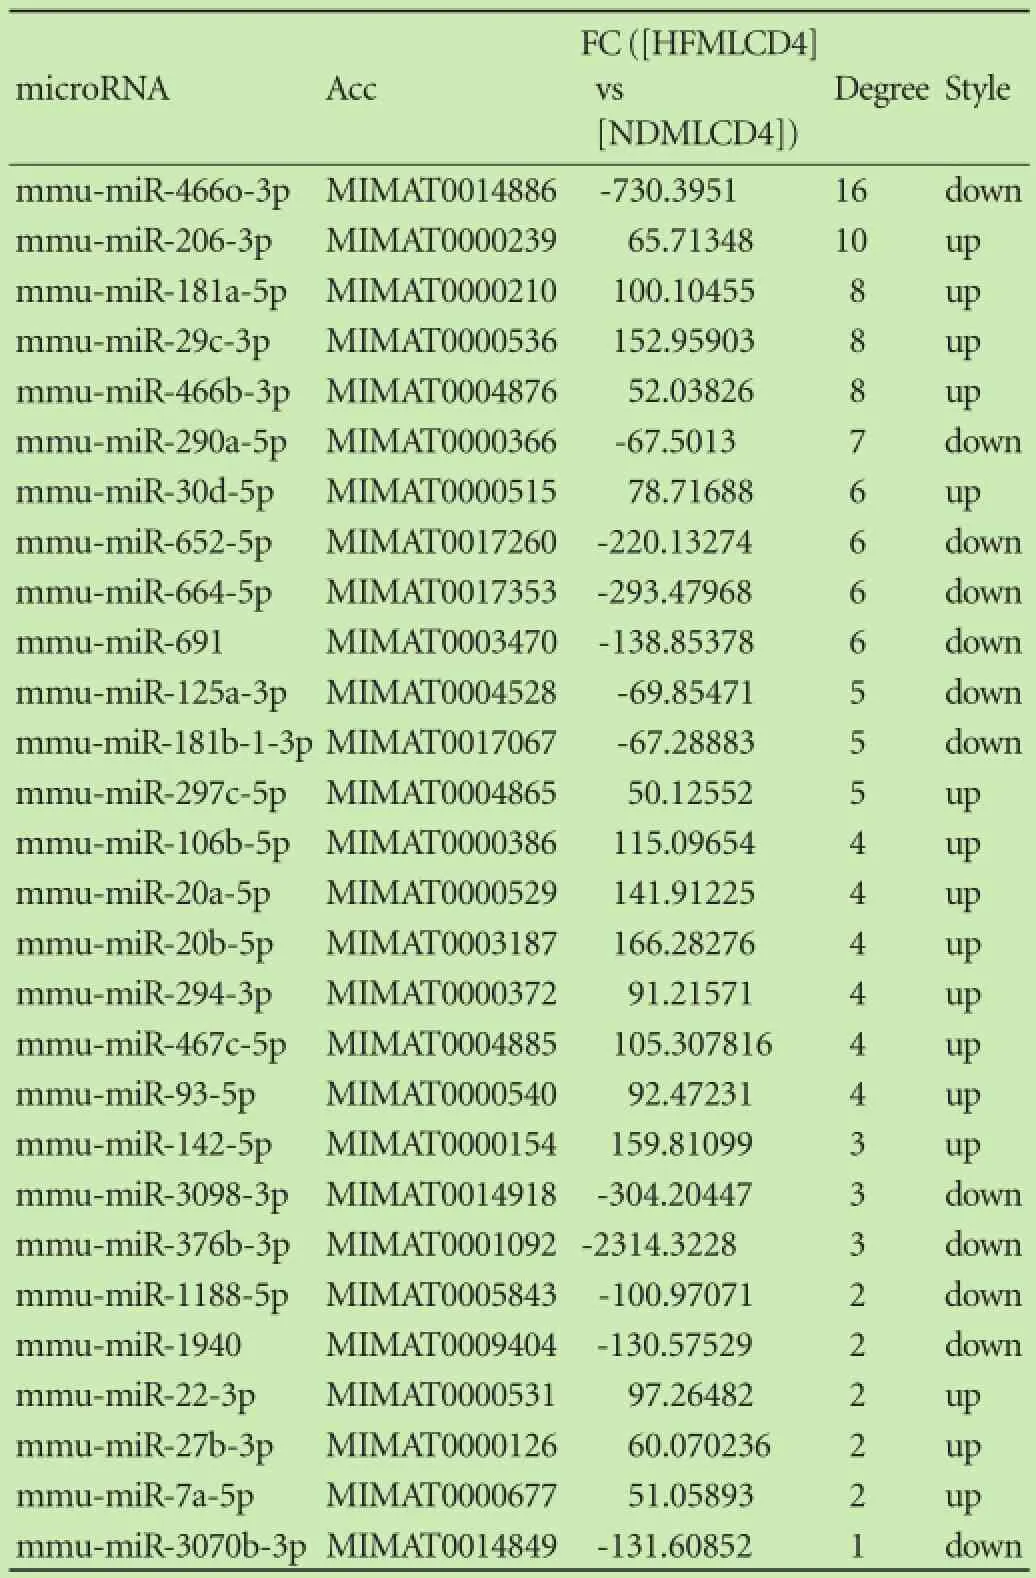
Table 5. The key microRNAs in microRNA-pathway-network of MLNs
Identifcation of microRNA-pathway network
As showed in Fig. 10A, in CD4+T lymphocytes of the liver from NAFLD mice, fve microRNAs were centralized the microRNA-pathway network that had the maximum pathways (degree≥10, Table 3). It seems that the pathways that had the most microRNAs (degree≥10) were the MAPK signaling, osteoclast, metabolic, endocytosis, axon guidance and chemokine signal pathways (Table 4). Meanwhile, in CD4+T lymphocytes of MLNs from NAFLD mice, two microRNAs were centralized in the microRNA-pathway network that had the maximum pathways (degree≥10, Table 5). It seems that the pathways that had the most microRNAs (degree≥10) were the metabolic, endocytosis and retrograde endocannabinoid signaling pathways (Table 6 and Fig. 10B).

Table 6. The key pathways in microRNA-pathway-network of MLNs
Validation of microRNA array results
To validate the microRNA array results, we chose 8 key microRNAs that had a higher degree of CD4+T lymphocytes of the liver as well as CD4+T lymphocytes of the MLNs from NAFLD mice compared with those from controls. The qRT-PCR was implemented to analyze the manifestation of the signifcantly regulated microRNAs in fve pools of CD4+T lymphocytes. The qRT-PCR evaluation verifed that the expression levels of miR-23b-3p, let-7e-5p and miR-451a were also comparably downregulated and the expression levels of miR-211-5p, miR-669b-3p, miR-128-3p, miR-130b-3p and miR-504-3p were comparably up-regulated (Fig. 11A) in the CD4+T lymphocytes of the liver from NAFLD mice compared with those of controls, as anticipated from the microarray data. Moreover, the levels of miR-23b-3p and let-7e-5p were down-regulated signifcantly, and the expression levels of miR-211-5p, miR-669b-3p, miR-128-3p and miR-130b-3p were up-regulated signifcantly. miR-466o-3p, miR-652-5p and miR-290a-5p were also comparably down-regulated, and miR-206-3p, miR-181a-5p, miR-29c-3p, miR-466b-3p and miR-30d-5p were also comparablyup-regulated (Fig. 11B) in the CD4+T lymphocytes of MLNs from NAFLD mice compared with those of controls. However, the overall expression levels of miR-466o-3p and miR-290a-5p were down-regulated signifcantly, and the expression levels of miR-181a-5p, miR-29c-3p, miR-206-3p and miR-30d-5p were up-regulated signifcantly in the CD4+T lymphocytes of MLNs from NAFLD mice. Every experiment was repeated three times.
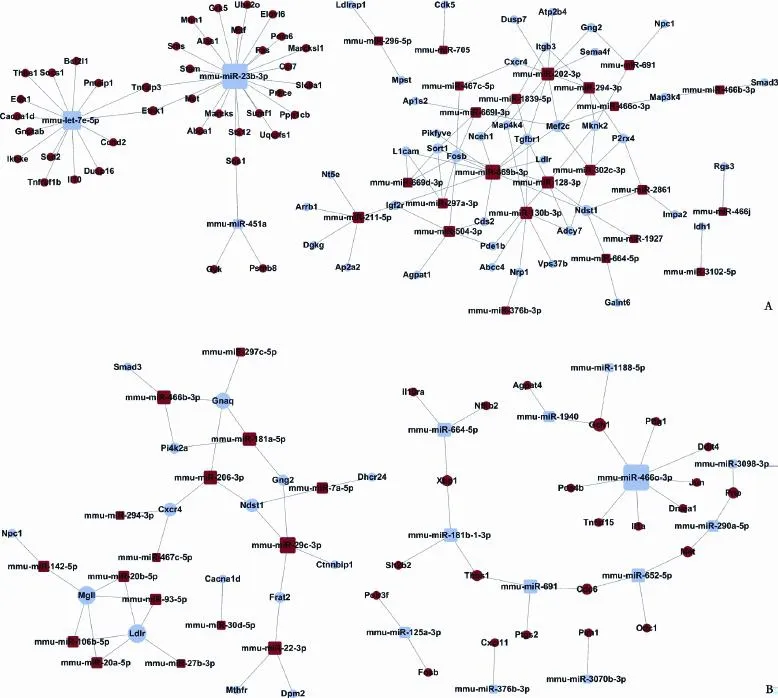
Fig. 10. microRNA-pathway network. A: CD4+T lymphocytes from the liver; B: CD4+T lymphocytes from the MLNs. The circle represented pathways (the red represented up-regulated, the blue represented down-regulated, the yellow represented up- and down-regulated), and the ground square represented microRNAs (the red represented up-regulated, the blue represented down-regulated) and their relationship was represented by lines.

Fig. 11. Real-time PCR assays for validation of microRNAs. A: The key microRNAs which have a high degree in CD4+T lymphocytes of the liver; B: The key microRNAs which have a high degree in CD4+T lymphocytes of the MLNs. *:P<0.05, **:P<0.01, using the Mann-WhitneyUtest (n=5).

Fig. 12. Real-time PCR assays for validation of mRNAs. A: The key mRNAs which have high degree in CD4+T lymphocytes of the liver; B: The key mRNAs which have high degree in CD4+T lymphocytes of the MLNs. *:P<0.05, **:P<0.01, using the Mann-WhitneyUtest (n=5).
Validation of microRNA target gene
Fosb, Mef2c, Ndst1, Tgfbr1 and Mknk2 are the targeted genes that have the most microRNAs regulated in the CD4+T lymphocytes of the liver. qRT-PCR was accomplished to analyze the expression of the signifcantly regulated mRNAs in fve pools of CD4+T lymphocytes. qRT-PCR analysis showed that the expression levels of Mef2c and Tgfbr1 were signifcantly down-regulated (Fig. 12A) in the CD4+T lymphocytes of the liver from NAFLD mice compared with those from controls, as expected from the RNA Seq data. Ldlr, Mgll, Gnaq, Ndst1 and Cxcr4 are the targeted genes that have the most microRNAs regulated in the CD4+T lymphocytes of MLNs. qRT-PCR analysis indicated that the signifcantly down-regulated (Fig. 12B) expression levels of Ndst1 in the CD4+T lymphocytes of the liver from NAFLD mice compared with those from controls, as expected from the RNA Seq data.
Discussion
In this study, the profles of mRNA and microRNA were established in the CD4+T lymphocytes of the liver and MLNs to investigate the complexity of gene deregulation in the immunopathology of NAFLD. The novel deregulated genes were identifed in CD4+T cells from the liver and MLNs of NAFLD mice.
Studies[24-26]have shown the relationship between the gut and liver immune systems in disease and health. The term “gut-liver axis” was used to describe the immunological relationship between the liver and gut.[27]Other studies[3,4,8]showed that CD4+T lymphocytes played a vital role in the immunopathogenesis of NAFLD. In the present study, we found signifcant enrichments in the up-regulated genes from the liver and MLNs of NAFLD CD4+T cells, which may be related to infammatory response, innate immune response, apoptosis, response to virus and chemotaxis. These results demonstrated that CD4+T cells from the liver and MLNs of NAFLD mice were activated to perform immune and infammatory responses, and their chemotaxis was enhanced. Pathnet analysis showed that both MAPK signaling pathway and apoptosis played a core role in CD4+T lymphocytes from the liver and MLNs. MAPK is a class of serine/threonine protein kinase that widely exists in mammalian cells and mediates signal conduction from the cell surface to the endonuclear, which includes cell extracellularsignal-regulated kinases (ERKs), c-Jun amino-terminal kinases (JNK) and p38 MAPK. In recent years, many reports have indicated that JNK and p38 MAPK are closely related to insulin resistance and involved in the cell infammatory response and apoptosis process, which are also related to the release of a variety of infammatory cytokines (such as IL-1, IL-6 and TNF-α) in NAFLD.[28-31]It is noteworthy that our fndings indicated that the NF-kappa B signal pathway was up-regulated in CD4+T lymphocytes from the MLNs and liver of NAFLD. Cytokines, growth factors, immune receptors, stress response, bacteria and other factors could activate NF-kappa B which initiates transcription of many genes such as TNF-α, IL-1, IL-6, and IL-8. These gene products are included in the infammation of the liver, liver fbrosis, liver regeneration and apoptosis of NAFLD. There have also been experiments confrming that NF-kappa B expression was signifcantly enhanced in liver tissue from NAFLD mice compared with that from normal group.[32]
microRNAs are required for normal immune system development and function. Studies[33,34]have explored the vital functions of microRNAs in regulating immunity. Increasing evidence shows that microRNAs are important for standardizing gene expression in metabolism-related syndromes, such as NAFLD.[9,10,12,13]We found the six signifcantly de-regulated microRNAs (miR-23b-3p, let-7e-5p, miR-211-5p, miR-669b-3p, miR-128-3p, and miR-130b-3p) in CD4+T lymphocytes from the liver were anticipated to aim at MAPK signaling pathway-related genes (Mknk2, Mef2c and Tgfbr1) through an inverse relationship. miR-23b cluster microRNAs regulate the transforming growth factor-beta/bone morphogenetic protein signaling and liver stem cell differentiation by targeting SMADs.[35]The miR-23b has been found to suppress IL-17-associated autoimmune infammation in lupus and arthritis by targeting TAB2, TAB3 and IKK-α.[36]It has been previously explained in regards to the immune response that let-7e regulates the endotoxin sensitivity and easiness of macrophages by affecting TLR4.[37]let-7e was related to liver fbrosis in a CCL4-induced mouse liver fbrosis model.[38]let-7a and let-7e showed pro-infammatory functions in experimental asthma by targeting IL-13.[39]miR-128 is known as a proapoptotic microRNA which negatively regulates cancer cell invasion and is able to affect the p53 network. miR-128 has recently been identifed as a controller of cholesterol homeostasis by targeting the ATP-binding cassette transporters ABCA1 and ABCG1 in tissues from mice that were fed a high-fat diet.[40-42]miR-130b was able to suppress fat deposition and reduce the expression of its direct target gene, PGC-1α (also known as PPARGC1A), which plays a key role in lipid oxidation in muscles.[43,44]miR-211 is known to be a tumor suppressor in melanoma.[45,46]The biological role of miR-669b has not been previously explained and therefore needs further study. In terms of our fndings, and the affliation of miR-23b, let-7e, miR-128 and miR-130b with immunological response and lipid metabolism that has been previously documented led us to believe that the four microRNAs might play a vital part in the immunological pathogenesis of NAFLD.
Moreover, the six signifcantly deregulated microRNAs (miR-466o-3p, miR-206-3p, miR-181a-5p, miR-29c-3p, and miR-290a-5p and miR-30d-5p) in CD4+T lymphocytes from MLNs were predicted to target the metabolic pathways of pathway-related genes. The plasma levels of miR-181a have been found to be linked to vulnerability to NAFLD and the extent of NAFLD-associated liver injury.[47]The miR-181a has been identifed to down-regulate in activated CD4+T cells. Overexpression of miR-181 can negatively regulate IFN-γ expression by directly binding to their target sites.[48]The development of NASH was paralleled by down-regulation of miR-29c, signifying that harshness of and vulnerability to diet-induced NASH may be explained by alterations in this microRNAs expression.[49]Liver X receptor α (LXRα) plays a vital role in the transcriptional control of lipid metabolism, which stimulates hepatic steatosis and steatohepatitis. miR-206 can repress LXRα-induced accumulation of lipid droplets in hepatocytes by targeting LXRα.[50]miR-30d, a glucose up-regulated microRNA, can induce insulin gene transcription by targeting the mitogen-activated protein 4 kinase 4 (MAP4K), a TNA-a activated kinase.[51]miR-181a, miR-206, miR-30d and miR-29c might have an important part in the immunological pathogenesis of NAFLD.
According to the integrative analysis of microRNA and mRNA expression patterns, the microRNA-gene regulatory network and microRNA-pathway network were established to predict the interactions of microRNAs and these targets. Our fndings indicated that the targeted genes with the most microRNAs were Fosb, Mef2c, Ndst1, Tgfbr1 and Mknk2 in CD4+T lymphocytes from the NAFLD liver. Mef2c and Tgfbr1, the components of MAPK signal pathway, were signifcantly down-regulated. It seems that the pathways with the most microRNAs were the MAPK signaling, osteoclast, metabolic, endocytosis, axon guidance and chemokine signal pathways. Meanwhile, the targeted genes with the most microRNAs were Ldlr, Mgll, Gnaq, Ndst1 and Cxcr4 in CD4+T lymphocytes from MLNs. The Ndst gene, which belongs to the metabolic pathway, was down-regulated signifcantly. The pathways with the most microRNAs were the metabolic, endocytosis and retrograde endocannabinoid signaling pathways.
Overall, the integrative analysis of microRNAs and gene transcription showed that the mRNA expression ofmany potential target genes of the de-regulated microRNAsoRNAs was altered in NAFLD CD4+T cells. The GO and KEGG pathway analyses also identifed signifcant gene enrichments of these potential target genes in immune system processes, cell cycle and cytokine-cytokine receptor interactions, and cell signaling pathways.
Integrative analyses revealed that the novel roles of microRNAs will be identifed in the occurrence and development of NAFLD. The results of our study offered a new perspective for the application of integrative analysis to identify the regulation methods involved in immunological pathogenesis of NAFLD. However, the microRNAs and their respective target genes were mainly investigated by bioinformatics methods. It should be verifed by concrete experiments.
Contributors:ZYJ, HY and LYL proposed the study, designed the research, analyzed and further interpreted the data, and wrote the manuscript. ZYJ and HY collected the data and contributed equally to the work. JWW and ZF analyzed the data. ZYJ, LJ and CYJ provided technical support. HY performed the statistical analysis. LYL is the guarantor.
Funding:This study was supported by a grant from the National Natural Science Foundation of China (81170375).
Ethical approval:This study was approved by the Institutional Animal Care and Use Committee of Peking University People's Hospital.
Competing interest:No benefts in any form have been received or will be received from a commercial party related directly or indirectly to the subject of this article.
1 Day CP, James OF. Steatohepatitis: a tale of two “hits”? Gastroenterology 1998;114:842-845.
2 Tilg H, Moschen AR. Evolution of infammation in nonalcoholic fatty liver disease: the multiple parallel hits hypothesis. Hepatology 2010;52:1836-1846.
3 Su L, Wang JH, Cong X, Wang LH, Liu F, Xie XW, et al. Intestinal immune barrier integrity in rats with nonalcoholic hepatic steatosis and steatohepatitis. Chin Med J (Engl) 2012;125:306-311.
4 Hu Y, Zhang H, Li J, Cong X, Chen Y, He G, et al. Gut-derived lymphocyte recruitment to liver and induce liver injury in non-alcoholic fatty liver disease mouse model. J Gastroenterol Hepatol 2016;31:676-684.
5 Racanelli V, Rehermann B. The liver as an immunological organ. Hepatology 2006;43:S54-62.
6 Gadd VL, Skoien R, Powell EE, Fagan KJ, Winterford C, Horsfall L, et al. The portal infammatory infltrate and ductular reaction in human nonalcoholic fatty liver disease. Hepatology 2014;59:1393-1405.
7 Maher JJ, Leon P, Ryan JC. Beyond insulin resistance: innate immunity in nonalcoholic steatohepatitis. Hepatology 2008;48:670-678.
8 Kremer M, Thomas E, Milton RJ, Perry AW, van Rooijen N, Wheeler MD, et al. Kupffer cell and interleukin-12-dependent loss of natural killer T cells in hepatosteatosis. Hepatology 2010;51:130-141.
9 Hoekstra M, van der Sluis RJ, Kuiper J, Van Berkel TJ. Nonalcoholic fatty liver disease is associated with an altered hepatocyte microRNA profle in LDL receptor knockout mice. J Nutr Biochem 2012;23:622-628.
10 Lakner AM, Bonkovsky HL, Schrum LW. microRNAs: fad or future of liver disease. World J Gastroenterol 2011;17:2536-2542.
11 von Mering C, Bork P. Teamed up for transcription. Nature 2002;417:797-798.
12 Kerr TA, Korenblat KM, Davidson NO. MicroRNAs and liver disease. Transl Res 2011;157:241-252.
13 Cheung O, Puri P, Eicken C, Contos MJ, Mirshahi F, Maher JW, et al. Nonalcoholic steatohepatitis is associated with altered hepatic microRNA expression. Hepatology 2008;48:1810-1820.
14 Wu J, Wang C, Li S, Li S, Wang W, Li J, et al. Thyroid hormoneresponsive SPOT 14 homolog promotes hepatic lipogenesis, and its expression is regulated by liver X receptor α through a sterol regulatory element-binding protein 1c-dependent mechanism in mice. Hepatology 2013;58:617-628.
15 Zhu X, Herzenberg AM, Eskandarian M, Maguire GF, Scholey JW, Connelly PW, et al. A novel in vivo lecithin-cholesterol acyltransferase (LCAT)-defcient mouse expressing predominantly LpX is associated with spontaneous glomerulopathy. Am J Pathol 2004;165:1269-1278.
16 Ma X, Hua J, Mohamood AR, Hamad AR, Ravi R, Li Z. A highfat diet and regulatory T cells infuence susceptibility to endotoxin-induced liver injury. Hepatology 2007;46:1519-1529.
17 Enright AJ, John B, Gaul U, Tuschl T, Sander C, Marks DS. MicroRNA targets in Drosophila. Genome Biol 2003;5:R1.
18 Joung JG, Hwang KB, Nam JW, Kim SJ, Zhang BT. Discovery of microRNA-mRNA modules via population-based probabilistic learning. Bioinformatics 2007;23:1141-1147.
19 Draghici S, Khatri P, Tarca AL, Amin K, Done A, Voichita C, et al. A systems biology approach for pathway level analysis. Genome Res 2007;17:1537-1545.
20 Kanehisa M, Goto S, Kawashima S, Okuno Y, Hattori M. The KEGG resource for deciphering the genome. Nucleic Acids Res 2004;32:D277-280.
21 Yi M, Horton JD, Cohen JC, Hobbs HH, Stephens RM. WholePathwayScope: a comprehensive pathway-based analysis tool for high-throughput data. BMC Bioinformatics 2006;7:30.
22 He X, Zhang Q, Liu Y, Pan X. Cloning and identifcation of novel microRNAs from rat hippocampus. Acta Biochim Biophys Sin (Shanghai) 2007;39:708-714.
23 Zhang Y, He X, Liu Y, Ye Y, Zhang H, He P, et al. microRNA-320a inhibits tumor invasion by targeting neuropilin 1 and is associated with liver metastasis in colorectal cancer. Oncol Rep 2012;27:685-694.
24 Eksteen B, Miles AE, Grant AJ, Adams DH. Lymphocyte homing in the pathogenesis of extra-intestinal manifestations of infammatory bowel disease. Clin Med (Lond) 2004;4:173-180.
25 Bliss SK, Bliss SP, Beiting DP, Alcaraz A, Appleton JA. IL-10 regulates movement of intestinally derived CD4+ T cells to the liver. J Immunol 2007;178:7974-7983.
26 Grant AJ, Lalor PF, Hübscher SG, Briskin M, Adams DH. MAdCAM-1 expressed in chronic infammatory liver disease supports mucosal lymphocyte adhesion to hepatic endothelium (MAdCAM-1 in chronic infammatory liver disease). Hepatology 2001;33:1065-1072.
27 Mehal WZ. The gut-liver axis: a busy two-way street. Hepatology 2012;55:1647-1649.
28 Tarantino G, Caputi A. JNKs, insulin resistance and infammation: a possible link between NAFLD and coronary artery disease. World J Gastroenterol 2011;17:3785-3794.
29 Malhi H, Bronk SF, Werneburg NW, Gores GJ. Free fatty acids induce JNK-dependent hepatocyte lipoapoptosis. J Biol Chem 2006;281:12093-12101.
30 Pearson G, Robinson F, Beers Gibson T, Xu BE, Karandikar M, Berman K, et al. Mitogen-activated protein (MAP) kinase pathways: regulation and physiological functions. Endocr Rev 2001;22:153-183.
31 Sinha-Hikim I, Sinha-Hikim AP, Shen R, Kim HJ, French SW, Vaziri ND, et al. A novel cystine based antioxidant attenuates oxidative stress and hepatic steatosis in diet-induced obese mice. Exp Mol Pathol 2011;91:419-428.
32 Leclercq IA, Farrell GC, Sempoux C, dela Peña A, Horsmans Y. Curcumin inhibits NF-kappaB activation and reduces the severity of experimental steatohepatitis in mice. J Hepatol 2004;41:926-934.
33 Cobb BS, Nesterova TB, Thompson E, Hertweck A, O'Connor E, Godwin J, et al. T cell lineage choice and differentiation in the absence of the RNase III enzyme Dicer. J Exp Med 2005;201:1367-1373.
34 Muljo SA, Ansel KM, Kanellopoulou C, Livingston DM, Rao A, Rajewsky K. Aberrant T cell differentiation in the absence of Dicer. J Exp Med 2005;202:261-269.
35 Rogler CE, Levoci L, Ader T, Massimi A, Tchaikovskaya T, Norel R, et al. MicroRNA-23b cluster microRNAs regulate transforming growth factor-beta/bone morphogenetic protein signaling and liver stem cell differentiation by targeting Smads. Hepatology 2009;50:575-584.
36 Zhu S, Pan W, Song X, Liu Y, Shao X, Tang Y, et al. The microRNA miR-23b suppresses IL-17-associated autoimmune infammation by targeting TAB2, TAB3 and IKK-α. Nat Med 2012;18:1077-1086.
37 Androulidaki A, Iliopoulos D, Arranz A, Doxaki C, Schworer S, Zacharioudaki V, et al. The kinase Akt1 controls macrophage response to lipopolysaccharide by regulating microRNAs. Immunity 2009;31:220-231.
38 Murakami Y, Toyoda H, Tanaka M, Kuroda M, Harada Y, Matsuda F, et al. The progression of liver fbrosis is related with overexpression of the miR-199 and 200 families. PLoS One 2011;6:e16081.
39 Polikepahad S, Knight JM, Naghavi AO, Oplt T, Creighton CJ, Shaw C, et al. Proinfammatory role for let-7 microRNAS in experimental asthma. J Biol Chem 2010;285:30139-30149.
40 Adlakha YK, Saini N. MicroRNA-128 downregulates Bax and induces apoptosis in human embryonic kidney cells. Cell Mol Life Sci 2011;68:1415-1428.
41 Adlakha YK, Saini N. miR-128 exerts pro-apoptotic effect in a p53 transcription-dependent and -independent manner via PUMA-Bak axis. Cell Death Dis 2013;4:e542.
42 Adlakha YK, Khanna S, Singh R, Singh VP, Agrawal A, Saini N. Pro-apoptotic miRNA-128-2 modulates ABCA1, ABCG1 and RXRα expression and cholesterol homeostasis. Cell Death Dis 2013;4:e780.
43 Pan S, Yang X, Jia Y, Li R, Zhao R. Microvesicle-shuttled miR-130b reduces fat deposition in recipient primary cultured porcine adipocytes by inhibiting PPAR-g expression. J Cell Physiol 2014;229:631-639.
44 Wang YC, Li Y, Wang XY, Zhang D, Zhang H, Wu Q, et al. Circulating miR-130b mediates metabolic crosstalk between fat and muscle in overweight/obesity. Diabetologia 2013;56:2275-2285.
45 Kozubek J, Ma Z, Fleming E, Duggan T, Wu R, Shin DG, et al. In-depth characterization of microRNA transcriptome in melanoma. PLoS One 2013;8:e72699.
46 Bell RE, Khaled M, Netanely D, Schubert S, Golan T, Buxbaum A, et al. Transcription factor/microRNA axis blocks melanoma invasion program by miR-211 targeting NUAK1. J Invest Dermatol 2014;134:441-451.
47 Tryndyak VP, Latendresse JR, Montgomery B, Ross SA, Beland FA, Rusyn I, et al. Plasma microRNAs are sensitive indicators of inter-strain differences in the severity of liver injury induced in mice by a choline- and folate-defcient diet. Toxicol Appl Pharmacol 2012;262:52-59.
48 Fayyad-Kazan H, Hamade E, Rouas R, Najar M, Fayyad-Kazan M, El Zein N, et al. Downregulation of microRNA-24 and -181 parallels the upregulation of IFN-γ secreted by activated human CD4 lymphocytes. Hum Immunol 2014;75:677-685.
49 Pogribny IP, Starlard-Davenport A, Tryndyak VP, Han T, Ross SA, Rusyn I, et al. Difference in expression of hepatic microRNAs miR-29c, miR-34a, miR-155, and miR-200b is associated with strain-specifc susceptibility to dietary nonalcoholic steatohepatitis in mice. Lab Invest 2010;90:1437-1446.
50 Zhong D, Huang G, Zhang Y, Zeng Y, Xu Z, Zhao Y, et al. MicroRNA-1 and microRNA-206 suppress LXRα-induced lipogenesis in hepatocytes. Cell Signal 2013;25:1429-1437.
51 Zhao X, Mohan R, Özcan S, Tang X. MicroRNA-30d induces insulin transcription factor MafA and insulin production by targeting mitogen-activated protein 4 kinase 4 (MAP4K4) in pancreatic β-cells. J Biol Chem 2012;287:31155-31164.
Received June 10, 2015
Accepted after revision March 28, 2016
Author Affliations: Institute of Clinical Molecular Biology (Zhang YJ and Liu YL) and Department of Gastroenterology, Peking University People's Hospital, Beijing 100044, China (Hu Y, Li J, Chi YJ, Jiang WW, Zhang F and Liu YL)
Yu-Lan Liu, MD, PhD, Department of Gastroenterology, Peking University People's Hospital, Beijing 100044, China (Tel: +86-10-88325559; Fax: +86-10-68318386; Email: liuyulan@pkuph.edu.cn)
© 2017, Hepatobiliary Pancreat Dis Int. All rights reserved.
10.1016/S1499-3872(16)60098-X
Published online May 17, 2016.
杂志排行

Hepatobiliary & Pancreatic Diseases International的其它文章
- Instructions for Authors
- The consensus on liver autotransplantation from an international panel of experts
- Associating liver partition and portal vein ligation for staged hepatectomy: the current role and development
- Right hepatectomy in living donors with previous abdominal surgery
- Diagnosis and outcomes of collateral arterial formation after irreversible early hepatic artery thrombosis in pediatric liver recipients
- Cytokines are early diagnostic biomarkers of graft-versus-host disease in liver recipients