用显微CT研究不同植被恢复模式的土壤团聚体微结构特征
2016-12-19许明祥刘国彬张蓉蓉脱登峰
赵 冬,许明祥,刘国彬,张蓉蓉,脱登峰
(1. 中国科学院水利部水土保持研究所黄土高原土壤侵蚀与旱地农业国家重点实验室,杨凌 712100;2. 西北农林科技大学资源环境学院,杨凌 712100;3. 西北农林科技大学水土保持研究所,杨凌 712100;4. 中国科学院大学资源与环境学院,北京 100049)
用显微CT研究不同植被恢复模式的土壤团聚体微结构特征
赵 冬1,4,许明祥1,2,刘国彬1※,张蓉蓉2,脱登峰3
(1. 中国科学院水利部水土保持研究所黄土高原土壤侵蚀与旱地农业国家重点实验室,杨凌 712100;2. 西北农林科技大学资源环境学院,杨凌 712100;3. 西北农林科技大学水土保持研究所,杨凌 712100;4. 中国科学院大学资源与环境学院,北京 100049)
为了更好了解不同植被恢复模式对土壤团聚体微结构的影响,该研究采用显微CT技术扫描3~5 mm土壤团聚体,获取了3.25 μm分辨率的二维图像,并应用数字图像处理软件对团聚体孔隙结构进行三维重建,定量研究了黄土丘陵区不同植被恢复模式下(自然草地、人工灌木和坡耕地)土壤团聚体微结构特征。结果表明,两种植被恢复模式均显著提高了土壤有机碳含量和团聚体水稳性(P<0.05),降低了土壤容重。与坡耕地处理相比,自然草地土壤团聚体总孔隙度、大孔隙度(>100 μm)、瘦长型孔隙度分别增加了20%、23%和24%,而分形维数和连通性指数欧拉特征值分别降低了2%和75%,且各指标二者间差异均显著(P<0.05)。人工灌木土壤团聚体的上述各项孔隙参数均优于自然草地(较坡耕地分别增加了70%、88%和43%以及降低了4%和92%),且除欧拉特征值外,差异均显著(P<0.05)。分形维数和连通性对土壤结构变化的响应相当敏感,可作为该地区植被恢复过程中土壤质量评价的指标,研究结果可为黄土高原土壤质量评价提供科学参考。
土壤;团聚体;图像处理;显微CT;微结构;植被恢复;黄土丘陵区
0 引言
土壤结构是维持土壤功能的基础。作为土壤结构重要组成单元的团聚体,其大小分布和稳定性影响着土壤的孔隙性、持水性、通透性和抗蚀性,是评价土壤肥力和土壤质量的重要指标之一[1-2]。在土壤结构问题研究方面,尽管土壤团聚体的数量和分布以及稳定性等较为准确地反映了土壤的结构状况[3-5],但这些土壤团聚体指标包涵的信息非常有限,尤其是忽略了团聚体内部结构的差异,难以区分和判别各类土壤团聚体性状与特征[6]。土壤团聚体微结构决定着土壤水分运移、养分循环和微生物活动,从而影响着土壤的生物地球化学反应[7]。因此,为了模拟和预测土壤中各种物理、化学及生物过程,进而更加准确地评价土壤的质量水平,有必要进行团聚体内部微结构的研究。
由于土壤组成的复杂性和结构的易破碎性,以及研究方法的限制,无损地真实地获得团聚体内部结构非常困难[8]。近年来,以计算机断层扫描(computed tomography,CT)为代表的无损探测技术为快速、准确获取土壤三维结构提供了可行的技术手段。尤其是显微CT具有扫描快速、成像对比度强及分辨率高的优点,使得土壤结构的研究延伸到团聚体微结构[9-11]。Dal Ferro等[12]利用显微CT,构建了土壤团聚体的三维结构,定量研究了土壤有机碳对团聚体孔隙结构的影响。周虎等[13]通过显微CT分析了不同耕作年限水稻土团聚体的三维微结构特征,指出随着种植年限的增加,团聚体微结构和土壤质量明显改善。通过CT扫描和数字图像处理技术,不仅可以直观可视化研究土壤团聚体的三维结构,还可以定量表征团聚体内部孔隙的连通性和复杂性[10,14],从而更好地了解土壤团聚体形成机制及其与土壤性质、环境等因素之间的关系。
植被恢复是黄土高原地区生态环境建设的重要措施,植被恢复的实施改变了不合理的土地利用方式,促进了土壤肥力恢复和土壤质量的改善[15]。目前多数研究主要集中在植被恢复对土壤容重、孔隙度以及团聚体含量和稳定性的影响等方面[16-18],而研究土壤团聚体微结构对植被恢复的响应还相对较少。本文以黄土丘陵区不同植被恢复类型土壤为研究对象,利用同步辐射显微CT和图像分析技术研究了土壤团聚体内部微结构特征,探讨了植被恢复对团聚体结构的影响,以期为黄土高原土壤质量评价提供科学依据。
1 材料与方法
1.1 研究区域概况
研究区位于陕西省安塞县纸坊沟流域(36°43′11″-36°46′25″N,109°13′46″-109°16′33″E),属典型黄土丘陵沟壑区,流域面积8.27 km2。研究区属暖温带半干旱气候,年平均气温8.8℃,平均无霜期159 d。多年平均降雨量为505 mm,降雨年际变化大且年内分配不均,其60%以上降雨集中在7-9月份,年蒸发量为1010~1400 mm。土壤为黄土母质上发育的黄绵土,土壤抗冲抗蚀能力差,水土流失严重。受地形地貌和人类经济活动的多重影响,特别是毁林开荒的加剧,导致生态系统严重退化[19]。经过多年的综合治理,尤其是“退耕还林工程”的实施,该区域生态系统得以逐步恢复,并进入良性循环的轨道[20]。
1.2 样地选择与样品采样
在研究区内,根据流域地貌特征、植被以及土地利用状况,以典型性和代表性为原则,在流域内选择退耕前种植背景相同,坡度坡向相似,年限均为23 a的自然草地(natural grassland,GL)和人工灌木林(artificial shrubland,SL)。同时设置相应的坡耕地(slope cropland,CK)作为对照。样地的基本特征如表1。

表1 样地基本地形及植被特征Table 1 Geographical features and vegetation characteristics of sampling sites
2014年8月,在各样地选取3个20 m×20 m研究小区,在每个小区内布设5个点,采集表层0~20 cm土样。将各个小区的土样混合,然后用四分法取出足够样品。样品混合均匀后,分为两部分。综合考虑仪器分辨率、测样时间和样品大小,通常选取3~5 mm团聚体作为团聚体微结构的研究对象[11,13]。一部分通过5 mm筛和3 mm筛,用于土壤团聚体测定,另一部分挑出杂物,风干,用于测定土壤理化性质。团聚体稳定性采用Le Bissonnais 法[21],快速湿润处理,筛分后计算平均质量直径(mean weight diameter,MWD)。土壤容重采用环刀法,颗粒组成采用英国马尔文公司的MS2000型激光粒度仪测定;有机碳采用重铬酸钾氧化外加热法。在CT扫描之前土壤团聚体在40℃下烘干24 h,并置于冰箱中4℃下保存。
1.3 CT扫描和图像重建
由于束流时间的限制,每个处理随机选择3个3~5 mm团聚体样品进行CT扫描[13]。团聚体样品CT扫描在上海光源X射线成像及生物医学应用光束线/实验站(BL13W1)完成,光子能量设置为24 keV,分辨率3.25 μm。曝光时间为1.8 s,样品台与探测器距离为12 cm。将样品固定在样品台上,样品台在水平方向从0到180°匀速旋转,共采集720幅投影图像。然后利用上海光源PITRE软件进行图像重建,采用背投影算法重建获得约550张大小为1 024×1 024像素的32位tiff格式的灰度图像,再将其转存为8位tiff格式的灰度图像,灰度值范围为0~255。
1.4 图像处理
重建后切片图像的处理以及团聚体三维结构的可视化、定量化利用ImageJ1.48V软件完成。为消除不同CT切片图像间亮度差别,首先利用ImageJ软件的Normalize命令对图像进行归一化处理。为了避免边界部分的影响,选取团聚体中间部分500×500×500体元(即1.625 mm× 1.625 mm×1.625 mm)进行图像分析。对灰度图像的二值分割是土壤结构定量分析的关键,不同分割方法对土壤结构特征分析结果影响很大[13]。二值分割是指灰度图像通过阈值化被分割为二部分(黑色和白色两种颜色来表征):土壤基质和孔隙。本研究采用全局阈值法,结合实际的土壤孔隙度反复调试确定每个图像的分割阈值。图像二值化后,团聚体的三维结构的可视化通过ImageJ 3D viewer插件实现(见图1)。
同时,对于分割后的二值图像,利用ImageJ插件分别获取孔隙度、孔隙大小分布[22]、分形维数[12]和孔隙连通性[23]等。按孔隙当量直径将孔隙分为4个等级:<30 μm,≥30~75 μm,>75~100 μm和>100 μm[22]。然后通过公式(1)来计算孔隙形状系数(F)[24]。
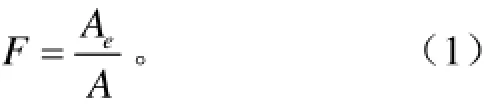
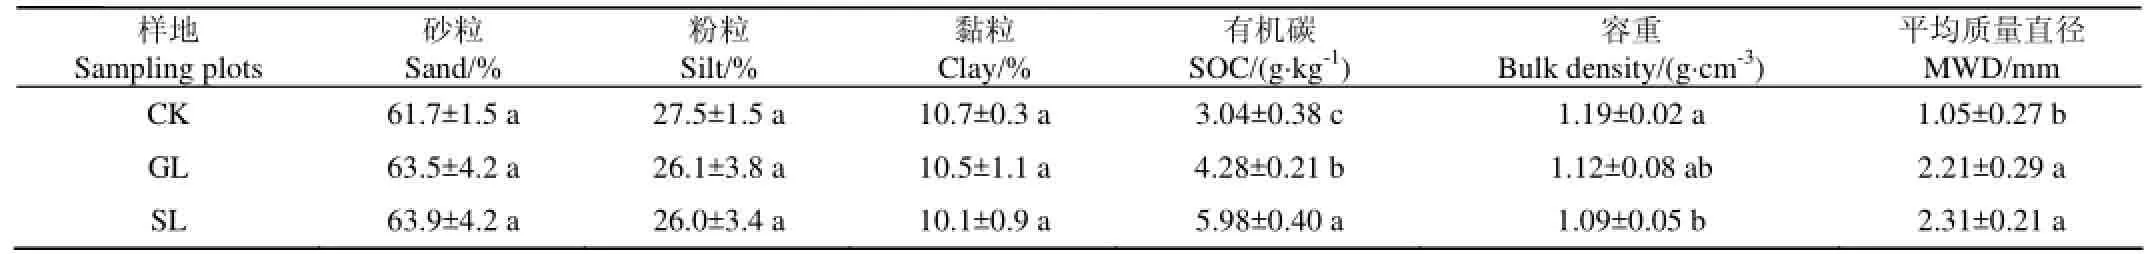
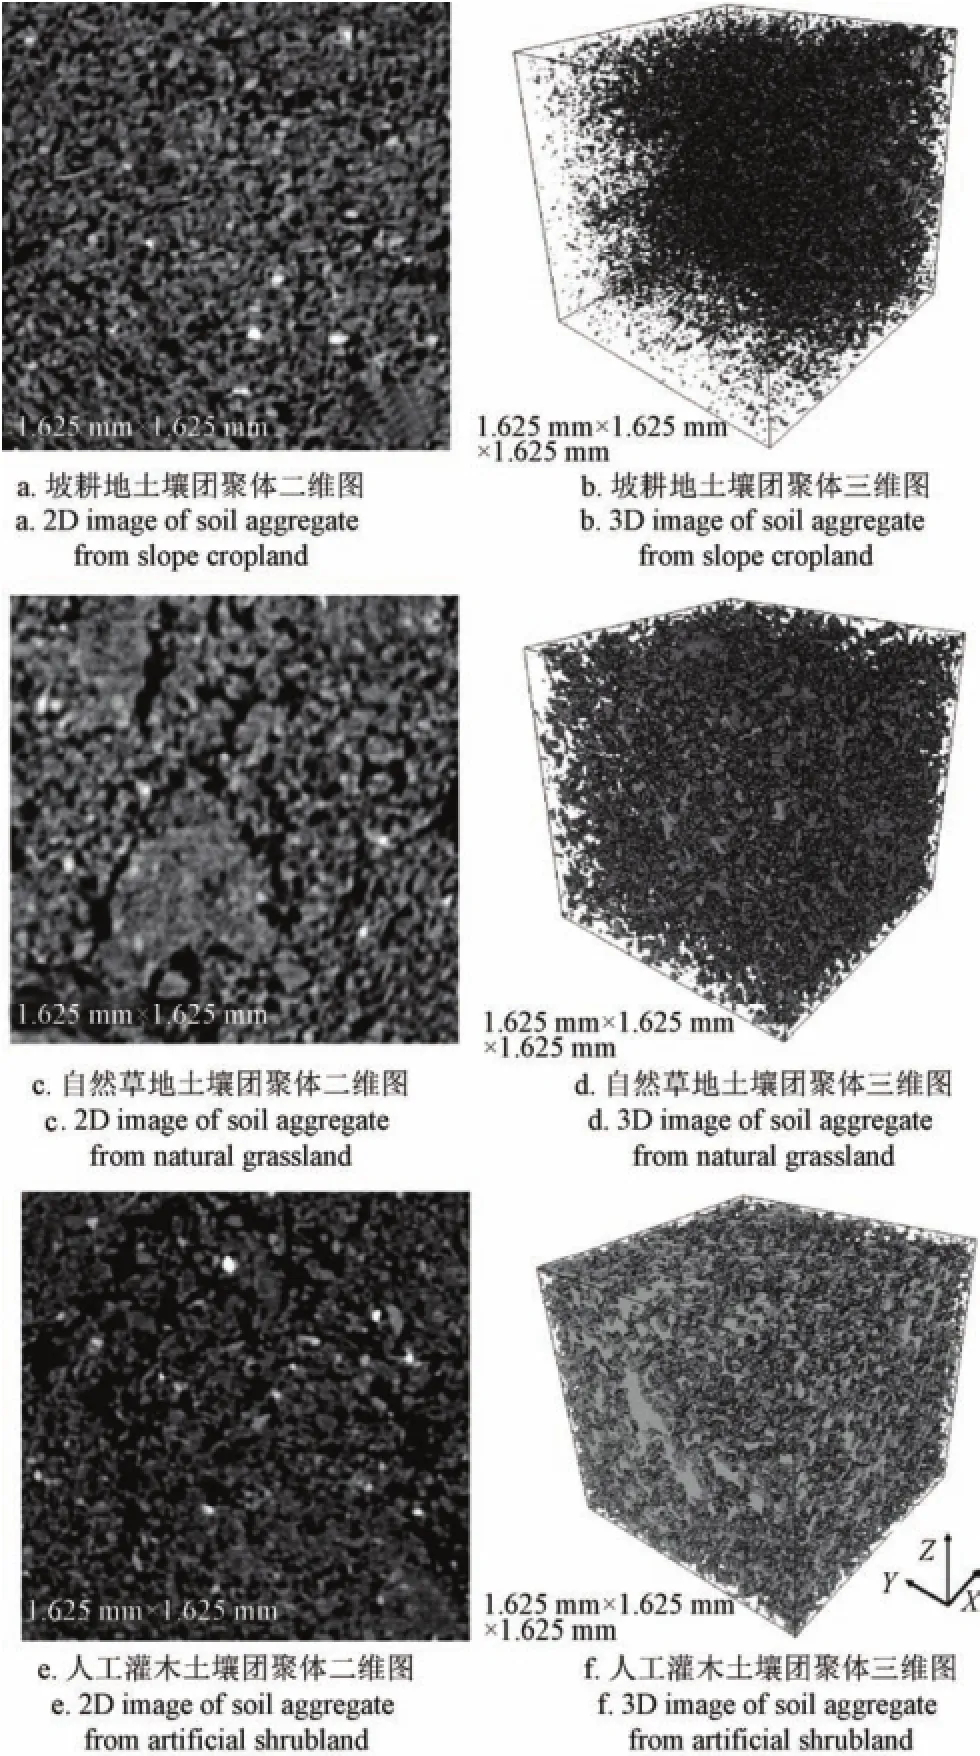
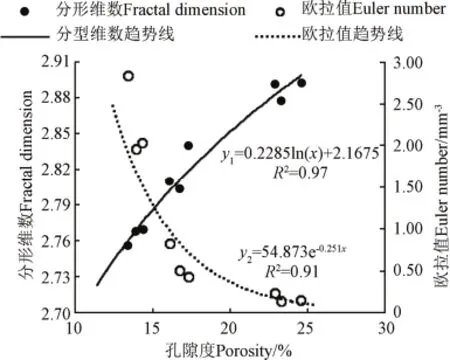
式中Ae为孔隙等体积球体的表面积,而A为孔隙的实测表面积。按孔隙形状系数将孔隙分为三类:规则型(F≥0.5),不规则型(0.2 1.5 统计分析 采用SPSS20.0统计分析软件对不同植被恢复土壤团聚体微结构参数的差异性进行单因素方差分析(ANOVA)和多重比较(LSD法,P=0.05)。 2.1 不同植被恢复模式土壤理化性质 退耕地植被恢复后,土壤部分理化性质发生了显著的变化(表2)。经过23 a的植被恢复,与坡耕地(CK)相比,天然草地(GL)和人工灌木(SL)显著提高了土壤有机碳的含量,且两种植被恢复处理间差异显著。植被恢复后,土壤容重降低,而土壤团聚体平均质量直径(MWD)显著增加,但两种植被恢复处理间差异并不显著(P>0.05)。然而在植被恢复过程中土壤质地并没有发生显著变化(P>0.05)。 表2 不同植被类型下土壤理化性质Table 2 Soil physical and chemical properties under different vegetation types 图1 不同植被恢复类型土壤团聚体二维和三维结构Fig.1 2D and 3D visualizations of soil aggregate structures of soil aggregates under different vegetation types 2.2 土壤团聚体孔隙度及孔隙大小分布 由于本试验显微CT图像分辨率为3.25 μm,所以本文仅讨论大于3.25 μm的孔隙。植被恢复后,GL和SL处理显著地提高了土壤团聚体总孔隙度,分别较CK处理提高了20%和70%(表3)。而GL和SL处理土壤团聚体孔隙数量却显著减少,分别减少了68%和62%(表3)。图2为经过图像分析得到的不同植被土壤团聚体孔隙大小分布状况。当量孔径>100 μm的孔隙度占到总孔隙度的83%以上,且GL和SL处理较CK处理分别提高了23% 和88%。这与团聚体的二维和三维结构图所示一致(图1)。对于当量孔径<30 μm和≥30~75 μm的各级孔隙,两种植被恢复处理均显著小于坡耕地,其中SL处理减少程度大于GL处理。虽然两种植被恢复模式当量孔径>75~100 μm的孔隙度均大于CK处理,但是差异不显著。 图2 不同植被类型团聚体孔隙大小分布Fig.2 Pore size distributions of soil aggregates under different vegetation types 2.3 土壤团聚体孔隙形状特征 土壤孔隙形状影响着土壤的水力特性[26],尤其是瘦长型孔隙由于其较大的孔壁表面积,更有利于水分和气体的存储,从而满足植物生长的需要。不同植被恢复类型土壤团聚体孔隙形状特征如图3所示,植被恢复显著改变了团聚体孔隙形状分布。瘦长型孔隙为土壤团聚体孔隙的主要形态,其所占孔隙度大约为81%,且GL和SL处理较CK处理分别提高了24%和43%。而规则型和不规则孔隙所占孔隙度呈现出相反的趋势。这与图1中观察到的现象一致,随着植被的恢复,土壤团聚体中产生了更多的细长的不规则的孔隙,呈现明显的复杂多孔结构。 图3 不同植被类型土壤团聚体孔隙形状分布Fig.3 Pore shape distribution of soil aggregates under different vegetation types 2.4 孔隙结构的分形维数和连通性 为了更好地表征团聚体孔隙结构的复杂度和连通性,本文引入了孔隙形态参数:分形维数和欧拉特征数。由表3可知,团聚体孔隙结构的分形维数在2.77~2.89之间,GL和SL处理较CK处理分别降低了2%和4%,可见植被恢复显著地改善了土壤团聚体微结构,使其结构更加复杂和稳定。GL和SL处理的欧拉特征显著低于CK处理(P<0.05),分别减少了75%和92%,说明植被恢复促进了团聚体孔隙连通性的提高,更利于水分和气体的流通。此外,最大孔隙所占孔隙度达到了82%以上,且随植被恢复其比例不断增大(表3),一方面表明团聚体的孔隙网络是高度连通的,另一方面进一步证明植被恢复对团聚体孔隙结构的改善作用。 表3 不同植被土壤团聚体孔隙基本结构参数Table 3 General properties of soil pore network of aggregates under different vegetation types 植被恢复促进了土壤质量的提升,而土壤质量改善的基础是土壤结构的恢复。只有良好的土壤结构才能有利于土壤各项基本功能的实现。坡耕地退耕还林还草后,大量的凋落物返回到土壤中,提高了土壤有机碳的含量,并且促进土壤团聚体的形成及其稳定性的提高[3],从而增强土壤抗蚀性,防止土壤退化。同时由于植被地下根系的增多,使得根在土壤中的穿透和扎伸能力增强,造成土壤容重下降,土壤结构相对松散、通透性好[27]。平均质量直径(MWD)值越大,说明团聚体稳定性越好。天然草地和人工灌木均提高了土壤团聚体稳定性(表2),但这两种植被恢复之间并没有显著差异(P>0.05),可见尽管通过土壤团聚体稳定性能够反映出土壤团聚体的综合变化,然而不同植被土壤团聚体内部结构的异同以及结构发育的程度却无法得知,因此本文开展的团聚体微结构的研究显得更加重要。 通过对土壤团聚体二维和三维形态的观察,并结合图像分析,本研究发现,植被恢复显著地改善了土壤团聚体孔隙结构状况。相较于坡耕地,植被恢复显著提高了团聚体总孔隙度、孔径>100 μm的孔隙度、瘦长型孔隙度,这与Zhou等的研究结果接近,其指出植被恢复显著增加了团聚体孔隙度,尤其是大孔隙所占孔隙度。一般将当量直径>100 μm定义为大孔隙(通气孔隙或非毛管孔隙)[28],因此大孔隙的增多,增加了土壤通气性,提高导水率,从而土壤结构也就更好。此外,利用分形维数和孔隙连通性指标欧拉特征值,来量化表征团聚体微结构的形态特征,也发现植被恢复土壤团聚体孔隙结构更加复杂(较大的分形维数)且连通性更高(较低的欧拉值)。可见经过23a植被恢复,土壤团聚体内部微结构从紧密的细孔结构发育到疏松的复杂多孔结构[25],有利于水肥保持与供应,从而提高了土壤肥力和质量。 由于不同植被的凋落物成分不同,以及根系的大小、分布等差异,造成不同植被土壤的团聚体微结构不同[15]。通过对孔隙系统(总孔隙度,大孔隙度,瘦长型孔隙度,分形维数和连通性)的定量分析,发现相较于天然草地,人工灌木土壤团聚体具有更加连通的稳定结构。Zhao等[17]利用CT技术研究黄土高原植被演替下土壤孔隙特征,也得到类似的结果,即灌木的土壤孔隙结构优于草本。究其原因,一方面是灌木具有更加发达更加强壮的根系系统,且根系寿命更长以及较长的生长季节[29],有利于更多孔隙的形成,使土壤结构更加疏松。另一方面由于灌木土壤含有更多有机质,而有机质作为该地区土壤团聚体形成最主要的胶结物质[17],促使更多微团聚体形成或微团聚体胶结成大团聚体,改善了土壤孔隙状况,土壤结构得到改善。 本研究发现孔隙形态参数(分形维数和连通性)能够量化不同处理团聚体微结构的差异,很好地反映孔隙网络状况。通过对土壤团聚体总孔隙度与分形维数、孔隙连通性指标欧拉特征值进行相关性分析(图4),发现团聚体总孔隙度与分形维数呈显著的非线性正相关性(R2=0.97),而与欧拉特征值呈非线性负相关性(R2=0.91)。De Gryze等[30]研究有机残渣对土壤团聚体孔隙度和孔隙形态的影响,指出孔隙度与分形维数存在非线性相关性。相关研究表明,连通性不但可以反映不同管理措施对土壤孔隙特征的影响,而且能够应用在不同尺度上(土块尺度和团聚体尺度)[12]。可见分形维数和欧拉特征值对团聚体孔隙变化的响应是相当敏感的,因此在一定程度上可以作为评价土壤团聚体内部复杂结构的理想指标。 尽管CT技术大大促进了土壤结构的研究,然而还存在很多问题急需解决,尤其是图像处理中阈值的选取仍然还是难点,缺乏被广泛接受的阈值分割方法[31]。因此,未来随着CT技术的进一步发展,更高分辨率、更高对比度和更低噪图像的获取,将有利于准确进行二值分割,制定出更加适合的阈值方法,进而将该技术应用到更多环境条件下、更多的土壤类型下的土壤结构研究中。 图4 土壤团聚体总孔隙度与分形维数及欧拉值的关系Fig.4 Relationships of total porosity of soil aggregates with fractal dimension and with Euler number 本文利用显微CT技术获得土壤团聚体二维图像,通过计算机图像处理技术,构建出团聚体的三维立体结构,实现了孔隙网络结构的可视化,弥补了传统方法难以真实获得团聚体内部结构的缺陷。结果表明,植被恢复显著提高了土壤有机碳含量和团聚体水稳性(P<0.05),降低了土壤容重。与坡耕地处理相比,自然草地和人工灌木土壤团聚体总孔隙度、大孔隙度(>100 μm)、瘦长型孔隙度分别增加了20%、23%、24%和70%、88%、43%,而分形维数和连通性指数欧拉特征值分别降低了2%、4% 和75%、92%,说明植被恢复能促进团聚体微结构的改善,从而提高了土壤质量。人工灌木土壤团聚体孔隙结构优于自然草地,主要是由于其有较高的有机碳含量和更发达的根系系统。分形维数和连通性能很好反映团聚体形态结构的变化,可作为黄土丘陵区植被恢复过程中土壤质量评价的指标。 [1] 卢金伟,李占斌. 土壤团聚体研究进展[J]. 水土保持研究,2002,9(1):81-85. Lu Jinwei, Li Zhanbin. Advance in soil aggregate study[J]. Research of Soil and Water Conservation, 2002, 9(1): 81-85. (in Chinese with English abstract) [2] 安韶山,黄懿梅,李壁成,等. 黄土丘陵区植被恢复中土壤团聚体演变及其与土壤性质的关系[J]. 土壤通报,2006,37(1):45-50. An Shaoshan, Huang Yimei, Li Bicheng, et al. Characteristics of soil water stable aggregates and relationship with soil properties during vegetation rehablitation in a Loess hilly region[J]. Chinese Journal of Soil Scienc, 2006, 37(1): 45-50. (in Chinese with English abstract) [3] 彭新华,张斌,赵其国. 红壤侵蚀裸地植被恢复及土壤有机碳对团聚体稳定性的影响[J]. 生态学报,2003,23(10):2176-2183. Peng Xinhua, Zhang Bin, Zhao Qiguo. Effect of soil organic carbon on aggregate stability after vegetative restoration on severely eroded red soil[J]. Acta Ecologica Sinica, 2003, 23(10): 2176-2183. (in Chinese with English abstract) [4] 谢锦升,杨玉盛,陈光水,等. 植被恢复对退化红壤团聚体稳定性及碳分布的影响[J]. 生态学报,2008,28(2):702-709. Xie Jinsheng, Yang Yusheng, Chen Guangshui, et al. Effects of vegetation restoration on water stability and organic carbon distribution in aggregates of degraded red soil in subtropics of China[J]. Acta Ecologica Sinica, 2008, 28(2): 702-709. (in Chinese with English abstract) [5] 于寒青,李勇,金发会,等. 黄土高原植被恢复提高大于0.25 mm粒级水稳性团聚体在土壤增碳中的作用[J]. 植物营养与肥料学报,2012,18(4):877-884. Yu Hanqing, Li Yong, Jin Fahui, et al. The role of increasing soil water-stable aggregates with diameter >0.25 mm by vegetation restoration in enhancement of soil organic carbon in the Loess Plateau[J]. Plant Nutrition and Fertilizer Science, 2012, 18(4): 877-884. (in Chinese with English abstract) [6] 祁迎春,王益权,刘军,等. 不同土地利用方式土壤团聚体组成及几种团聚体稳定性指标的比较[J]. 农业工程学报,2011,27(1):340-347. Qi Yingchun, Wang Yiquan, Liu Jun, et al. Comparative study on composition of soil aggregates with different land use patterns and several kinds of soil aggregate stability index[J]. Transactions of the Chinese Society of Agricultural Engineering (Transactions of the CSAE), 2011, 27(1): 340-347. (in Chinese with English abstract) [7] Peth S, Horn R, Beckmann F, et al. Three-dimensional quantification of intra-aggregate pore-space features using synchrotron-radiation-based microtomography[J]. Soil Science Society of America Journal, 2008, 72(4): 897-907. [8] 周虎,李文昭,张中彬,等. 利用X射线CT研究多尺度土壤结构[J]. 土壤学报,2013,50(6):159-163. Zhou Hu, Li Wenzhao, Zhang Zhongbin, et al. Characterization of multi-scale soil structure with X-ray computed tomography[J]. Acta Pedologica Sinica, 2013, 50(6): 159-163. (in Chinese with English abstract) [9] Deurer M, Grinev D, Young I, et al. The impact of soil carbon management on soil macropore structure: a comparison of two apple orchard systems in New Zealand[J]. European Journal of Soil Science, 2009, 60(6): 945-955. [10] Dal Ferro N, Delmas P, Duwig C, et al. Coupling X-ray microtomography and mercury intrusion porosimetry to quantify aggregate structures of a cambisol under different fertilisation treatments[J]. Soil and Tillage Research, 2012, 119: 13-21. [11] 李文昭,周虎,陈效民,等. 基于同步辐射显微CT研究不同施肥措施下水稻土团聚体微结构特征[J]. 土壤学报,2014,51(1):67-74. Li Wenzhao, Zhou Hu, Chen Xiaomin, et al. Characterization of aggregate microstructures of paddy soils under different patterns of fertilization with synchrotron radiation micro-CT[J]. Acta Pedologica Sinica, 2014, 51(1): 67-74. (in Chinese with English abstract) [12] Dal Ferro N, Charrier P, Morari F. Dual-scale micro-CT assessment of soil structure in a long-term fertilization experiment[J]. Geoderma, 2013, 204: 84-93. [13] 周虎,彭新华,张中彬,等. 基于同步辐射微CT研究不同利用年限水稻土团聚体微结构特征[J]. 农业工程学报,2011,27(12):343-347. Zhou Hu, Peng Xinhua, Zhang Zhongbin, et al. Characterization of aggregate microstructure of paddy soils cultivated for different years with synchrotron based micro-CT[J]. Transactions of the Chinese Society of Agricultural Engineering (Transactions of the CSAE), 2011, 27(12): 343-347. (in Chinese with English abstract) [14] Garbout A, Munkholm L J, Hansen S B. Tillage effects on topsoil structural quality assessed using X-ray CT, soil cores and visual soil evaluation[J]. Soil and Tillage Research, 2013, 128: 104-109. [15] 张超,刘国彬,薛萐,等. 黄土丘陵区不同植被类型根际土壤微团聚体及颗粒分形特征[J]. 中国农业科学,2011,44(3):507-515. Zhang Chao, Liu Guobin, Xue Sha, et al. Fractal features of rhizosphere soil microaggregate and particle-size distribution under different vegetation types in the hilly-gully region of Loess Plateau [J]. Scientia Agricultura Sinica, 2011, 44(3): 507-515. (in Chinese with English abstract) [16] 马祥华,焦菊英,白文娟. 黄土丘陵沟壑区退耕植被恢复地土壤水稳性团聚体的变化特征[J]. 干旱地区农业研究,2005,23(3):69-74. Ma Xianghua, Jiao Juying, Bai Wenjuan. The changes of soil water-stable aggregates in abandoned lands during vegetation restoration in hilly and gully regions on the Loess Plateau[J]. Agricultural Research in the Arid Areas, 2005, 23(3): 69-74. (in Chinese with English abstract) [17] Zhao Shiwei, Zhao Yonggang, Wu Jinshui. Quantitative analysis of soil pores under natural vegetation successions on the Loess Plateau[J]. Science China Earth Sciences, 2010, 53: 617-625. [18] An Shaoshan, Darboux F, Cheng Man. Revegetation as an efficient means of increasing soil aggregate stability on the Loess Plateau (China)[J]. Geoderma, 2013, 209: 75-85. [19] 薛萐,刘国彬,张超,等. 黄土高原丘陵区坡改梯后的土壤质量效应[J]. 农业工程学报,2011,27(4):310-316. Xue Sha, Liu Guobin, Zhang Chao, et al. Effects of terracing slope cropland on soil quality in Hilly Region of Loess Plateau[J]. Transactions of the Chinese Society of Agricultural Engineering (Transactions of the CSAE), 2011, 27(4): 310-316. (in Chinese with English abstract) [20] 李鑫,曾全超,安韶山,等. 黄土高原纸坊沟流域不同植物叶片及枯落物的生态化学计量学特征研究[J]. 环境科学,2015,36(3):1084-1091. Li Xin, Zeng Quanchao, An Shaoshan, et al. Ecological stoichimetric characteristics in leaf and litter under different vegetation types of Zhifanggou Watershed on the Loess Plateau, China[J]. Environmental Science, 2015, 36(3): 1084-1091. (in Chinese with English abstract) [21] Le Bissonnais Y. Aggregate stability and assessment of soil crustability and erodibility: I. Theory and methodology[J]. European Journal 0f Soil Science, 1996, 47: 425-437. [22] Ma Renming, Cai Chongfa, Li Zhaoxia, et al. Evaluation of soil aggregate microstructure and stability under wetting and drying cycles in two Ultisols using synchrotron-based X-ray micro-computed tomography[J]. Soil and Tillage Research. 2015, 149: 1-11. [23] Doube M, Kłosowski MM, Arganda-Carreras I, et al. BoneJ: Free and extensible bone image analysis in Image J[J]. Bone, 2010, 47(6): 1076-1079. [24] Wadell H. Volume, shape, and roundness of rock particles[J]. The Journal of Geology, 1932: 443-451. [25] Zhou Hu, Peng Xinhua, Peth S, et al. Effects of vegetation restoration on soil aggregate microstructure quantified with synchrotron-based micro-computed tomography[J]. Soil and Tillage Research, 2012, 124: 17-23. [26] Lebron I, Suarez D, Schaap M. Soil pore size and geometry as a result of aggregate-size distribution and chemical composition[J]. Soil Science, 2002, 167(3): 165-172. [27] 刘金福,洪伟. 不同起源格式栲林地的土壤分形特征[J].山地学报,2001,19(6):565-570. Liu Jinfu, Hong Wei. Study on fractal feature of soil fertility under different original Castanopsis Kanakamii stands[J]. Journal of Mountain Research, 2001, 19(6): 565-570. (in Chinese with English abstract) [28] 柳云龙,施振香,尹骏,等. 旱地红壤与红壤性水稻土水分特性分析[J]. 水土保持学报,2009,2(23):232-235. Liu Yunlong, Shi Zhenxiang, Yi Jun, et al. Analysis of soil water characters between upland red soil and paddy soil [J]. Journal of Soil and Water Conservation, 2009, 2(23): 232-235. (in Chinese with English abstract) [29] Udawatta R P, Anderson S H. CT-measured pore characteristics of surface and subsurface soils influenced by agroforestry and grass buffers [J]. Geoderma, 2008, 145(3): 381-389. [30] De Gryze S, Jassogne L, Six J, et al. Pore structure changes during decomposition of fresh residue: X-ray tomography analyses [J]. Geoderma, 2006, 134(1): 82-96. [31] Zhou Hu, Peng Xinhua, Perfect E, et al. Effects of organic and inorganic fertilization on soil aggregation in an Ultisol as characterized by synchrotron based X-ray micro-computed tomography[J]. Geoderma, 2013(195/196): 23-30. Characterization of soil aggregate microstructure under different revegetation types using micro-computed tomography Zhao Dong1,4, Xu Mingxiang1,2, Liu Guobin1※, Zhang Rongrong2, Tuo Dengfeng3 Soil aggregate microstructure is a crucial factor that affects various soil physiochemical and biological processes. Vegetation restoration is expected to improve soil microstructure, yet little is known about the extent of changes in soil aggregate microstructure. X-ray micro-computed tomography (micro-CT), in combination with image analysis techniques, can provide three-dimensional (3D) data of porosity and pore size distribution, and is therefore useful to better investigate the 3D microstructure of soil aggregates. The objective of this study was to evaluate the impacts of different revegetation types (artificial shrubland, natural grassland and slope cropland) on the aggregate microstructure on the Loess Plateau using X-ray micro-CT measurements. The sampling sites were all located close to the top of the loess mounds with little difference in terms of aspect, slope gradient, elevation, and previous farming practices. An area of 100 m ×100 m was randomly selected for each site and within this area 3 20 m × 20 m plots were selected for sampling. Three samples of soil aggregate (3-5 mm) within 0.20 m soil profiles selected from each site were scanned at 3.25 μm voxel resolution with SSRF (Shanghai Synchrotron Radiation Facility). Segmentation of the grayscale slices was performed using automatic Otsu thresholding algorithm, and the threshold values were carefully chosen based on visual observation. To avoid edge effects, the sub-volume of 500 × 500 × 500 voxel (1.625 mm × 1.625 mm × 1.625 mm) was extracted for further analyses, representing an inscribed cube of the aggregate. The 3D pore structure was constructed and quantified using the digital image analysis software ImageJ. Aggregate water stability and other soil properties were also evaluated. Results showed that soil organic carbon and aggregate water stability were significantly increased, while soil bulk density was significantly decreased under both revegetation types (artificial shrubland and natural grassland). The surface soil texture showed no significant difference for different revegetation types. The total porosity of the aggregates was increased by approximately 60% and 20%, but the pore number was decreased by about 62% and 68% respectively in the artificial shrubland and the natural grassland compared to the slope cropland. Vegetation restoration affected the pore distribution of soil aggregates, which on the one hand promoted the proportion of >100 μm large pores and on the other hand decreased that of the pore size classes of <30 and 30-75 μm. Revegetation significantly changed the pore shape of soil aggregates, with a shift from regular and irregular pores to elongated pores. The fraction of elongated pores was dominant in all soil samples (on average 81%), and the order was artificial shrubland > natural grassland > cropland. The 3D fractal dimension and connectivity of soil aggregates showed a higher value in both revegetation types, suggesting pore system was improved after vegetation restoration. The total porosity, macro-porosity (>100 μm), fraction of elongated pores, fractal dimension and pore connectivity were significantly higher in the artificial shrubland aggregates compared to the natural grassland aggregates, indicating that the soil structure of the artificial shrubland was more developed than that of the natural grassland. That may be due to a higher organic carbon content and more developed root system under the artificial shrubland. The 3D fractal dimension of soil aggregates showed a curvilinear positive correlation with total porosity, however, Euler number showed a curvilinear negative correlation with total porosity. The fractal dimension and connectivity showed a high sensitivity to the change of soil structure, and thus could be used for evaluating the soil quality during the revegetation in this region. These results from this study can help understand the soil processes and may be used to quantify the effects of management on environment. With the development of computed tomography, it should be widely used to investigate the soil microstructure in more regions; and moreover the process mechanisms of soil aggregates also require further investigation. soils; aggregates; image processing; micro-CT; microstructure; revegetation; hilly-gully region of Loess Plateau 10.11975/j.issn.1002-6819.2016.09.017 S152.4 A 1002-6819(2016)-09-0123-07 赵 冬,许明祥,刘国彬,张蓉蓉,脱登峰.用显微CT研究不同植被恢复模式的土壤团聚体微结构特征[J]. 农业工程学报,2016,32(9):123-129. 10.11975/j.issn.1002-6819.2016.09.017 http://www.tcsae.org Zhao Dong, Xu Mingxiang, Liu Guobin, Zhang Rongrong, Tuo Dengfeng. Characterization of soil aggregate microstructure under different revegetation types using micro-computed tomography[J]. Transactions of the Chinese Society of Agricultural Engineering (Transactions of the CSAE), 2016, 32(9): 123-129. (in Chinese with English abstract) doi:10.11975/j.issn.1002-6819.2016.09.017 http://www.tcsae.org 2015-12-24 2016-03-07 国家自然科学基金项目(41171422);科技基础性工作专项(2014FY210100);中科院重点部署项目(KJZD-EW-TZ-G10) 赵 冬,男,河南三门峡人,博士生,主要从事流域生态及土壤微结构研究。杨凌 中国科学院水利部水土保持研究所黄土高原土壤侵蚀与旱地农业国家重点实验室,712100。Email:zd518pp@163.com ※通信作者:刘国彬,男,陕西榆林人,研究员,博士生导师,研究方向为流域生态学。杨凌 中国科学院水利部水土保持研究所黄土高原土壤侵蚀与旱地农业国家重点实验室,712100。Email:gbliu@ms.iswc.ac.cn2 结果与分析


3 讨论
4 结论
(1. State Key Laboratory of Soil Erosion and Dryland Farming on the Loess Plateau, Institute of Soil and Water Conservation, Chinese Academy of Sciences and Ministry of Water Resources, Yangling, 712100, China; 2. College of Natural Resources and Environment, Northwest A & F University, Yangling, 712100, China; 3. Institute of Soil and Water Conservation, Northwest A&F University, Yangling, 712100, China; 4. College of Resources and Environment, University of Chinese Academy of Sciences, Beijing 100049, China)