Dynamic simulation on shift process of tractor hydraulic power split continuously variable transmission during acceleration
2016-12-19WangGuangmingZhangXiaohuiZhuSihongZhangHaijunMaRanTaiJianjian
Wang Guangming, Zhang Xiaohui※, Zhu Sihong, Zhang Haijun, Ma Ran, Tai Jianjian
(1. College of Mechanical and Electronic Engineering, Shandong Agricultural University, Tai’an 271018, China; 2. College of Engineering, Nanjing Agricultural University, Nanjing 210031, China; 3. School of Mechanical and Electrical Engineering, Jiangsu Normal University, Xuzhou 221116, China)
Dynamic simulation on shift process of tractor hydraulic power split continuously variable transmission during acceleration
Wang Guangming1, Zhang Xiaohui1※, Zhu Sihong2, Zhang Haijun2, Ma Ran3, Tai Jianjian1
(1. College of Mechanical and Electronic Engineering, Shandong Agricultural University, Tai’an 271018, China; 2. College of Engineering, Nanjing Agricultural University, Nanjing 210031, China; 3. School of Mechanical and Electrical Engineering, Jiangsu Normal University, Xuzhou 221116, China)
The effect of the design parameters of the hydraulic power split continuously variable transmission on the shift process during tractor acceleration was investigated. First, the model of the power train was developed with the software of Simulation X, including the engine, the transmission, the load and the clutch control system, and 8 groups of the experiments were used to validate the correctness of the model. Considering the effect of the rotational inertia on the shift process during acceleration, a complete model of the tractor with the rear axle was built. Then, based on the evaluating index of the tractor peak acceleration and the clutch friction work, five groups of design parameters were simulated and analyzed. According to the simulation results, the trend of the shift process according to the different shift starting time is not monotonous, the shift impact could be reduced by shifting before the designed shift points (about −0.65 s in this study); the maximum slipping time is a function of the flow and pressure of oil, in order to shorten the period of the slipping time and improve the shift quality, long overlap time (0.2 s in this study) and large charge flow (6 L/min in this study) should be used; the large tractor weight can reduce the speed impact of tractor and the friction work of clutch but lead to bad impact on dynamic load, therefore the determination of the tractor weight should fully consider the impact of both the traveling speed and dynamic load of tractor. In addition, the shift impact could also be reduced by using Integrated Hydraulic Pump-Motor and reducing the engine speed during shift, but the effect of the swash plate axial piston units and engine on shift process was not so significant. This study can provide references for the study in continuously variable tractor transmissions and the control system.
tractors; computer simulation; models; shift quality; power split; transmission
Biography:Wang Guangming, Ph.D, majored in vehicle system dynamics and control. Tai’an College of Mechanical and Electronic Engineering, Shandong Agricultural University, 271018, China. Email: gavinwang1986@163.com
※Corresponding author:Zhang Xiaohui, professor, majored in agricultural machinery design. Tai’an College of Mechanical and Electronic Engineering, Shandong Agricultural University, 271018, China. Email: zhangxh@sdau.edu.cn
0 Introduction
The work conditions of tractor are complex, including plough, sowing, ridging, transport, etc[1-3]. In order to reduce fuel consumption of engine under different work conditions, the hydraulic power split CVT (continuously variable transmission) was used in tractor. Because of the hydraulic power split, this kind of CVT usually transmits a large engine power and has a high efficiency between mechanical transmission and hydraulic transmission. Further, this kind of CVT could simplify the shift operation of tractor and change the transmission ratio continuously. “Vario” was the first in series produced power split CVT in the world developed by Fendt in 1996[4-6]. With the technique of 45 degree variable bent axis units, the efficiency of hydraulic system in “Vario” reach 89%-92% in their best points[7], therefore, only 1 or 2 ranges were used in “Vario” families. But for most of manufacturers, 3-6 ranges were used to reduce the level of hydraulic power split and increase the transmission efficiency of CVT[8-11]. With the increase of the number of ranges in transmission design, the ‘shift quality’was still a key problem needing to be considered for designers to optimize the shift process. Shift quality in shift process was used to define the impact level in shift, which could be measured in terms of speed change, power loss, etc.
Currently, researchers tried to reduce the shift impact of the hydraulic power split CVT by optimizing the controller. For example, Coutant[12]proposed the control method to reduce the speed and torque impact by adjusting the output speed of the hydraulic transmission following the control of the clutches; Kuras[13]proposed the method to ensure the range shift completed at the predetermined shift completion ratio to increase the shift smoothness. Actually, another approach to increase the shift quality was to find the relationship between the shift process and the design parameters of the transmission. For example, Kim[14]studied the effect of the transmission design parameters on shift process under the software EASY 5, although the transmission used in this study was a power shuttle transmission, the method was worth reference; Similarly, Wang[15]and Ni[16]optimized design parameters of hydraulic power split CVT through groups of orthogonal test.
For the former research on shift process, some influencing factors were not considered for the limit of test conditions, and most studies neglected the effect of the tractor acceleration. Because of the effect of the inertial mass, extra dynamic load caused by the tractor acceleration could effect the shift process. Therefore, the relationship between shift process and design parameters such as shift starting time, clutch slipping time, swash plate axial piston units, work conditions and tractor weight were studied in this paper with the method of simulation, and the process of acceleration was considered for each factors.
1 Principle of the hydraulic power split CVT
The principle of the hydraulic power split CVT is shown in Fig.1. In order to reduce the level of hydraulic power split, 2 differential planet gears (p1and p2) and 5 ranges (Including a hydraulic range H0and 4 hydro-mechanical ranges HM1-HM4) are used in this transmission. The transmission can reach a top tractor speed of 50 km/h with a maximum hydraulic power split ratio of 44%[17].

Fig.1 Schematic diagram of hydraulic power split continuously variable transmission
Except hydraulic range H0(which is controlled by clutch k0) for tractor starting up, the engine power is split into hydraulic and mechanical part in range HM1-HM4(which are controlled by clutch k0-k4respectively). When the transmission runs at range HM1/HM3, the hydraulic and mechanical power flow into the sun gear and ring gear of p2respectively, and bring together in the planet carrier. Correspondingly, when the transmission runs at range HM2/HM4, the hydraulic and mechanical power flow into the sun gear and planet carrier of p1respectively, and bring together in the ring gear. The relationship between the transmission ratio of the CVT and the displacement ratio of the PV (variable hydraulic pump) and MF (fixed hydraulic motor) are as follows

Where iHMx(x=1,2,3,4) is transmission ratio of CVT at range HMx; ix(x=2,...,12)is transmission ratio of gear pair gx; λx(x=1,2) is transmission ratio of planet gear px; ε is displacement ratio of PV and MF.
Fig.2 shows the hydraulic control system of the wet clutches. Taking the shift process from range HM1to HM2as an example: when the solenoid valve c2is energized first, the hydraulic oil flows into the cylinder of the wet clutch k2to propel the piston of the cylinder, which will compact the steel sheets and friction disks of clutch k2to transmit friction torque. After a period of short delay (i.e. the “overlap time”) to avoid power interruption, the controller cuts off the power of solenoid valve c1, and then, the return spring separates the steel sheets from the friction disks of clutch k1to terminate the power transmission from this clutch.

Fig.2 Schematic diagram of clutches control system
2 Modeling and experimental validation
2.1 Introduction of the power train
The experimental power train consists of a diesel engine, a hydraulic power split CVT, a magnetic powder brake, a speed & torque sensors and a clutches control system, as shown in Fig.3. The diesel engine supplied the driving power, the magnetic powder brake acted as a power absorber, the speed & torque sensors were used to get the speed and torque data of the engine and transmission, and the clutches control system was used to conduct the power shift of the transmission. In order to control the transmission and the magnetic powder brake, a remote control system was developed based on Matlab/GUI and Single Chip Microcomputer system further[18].

Fig.3 Power train for experiments of shift process
2.2 Model of the power train
When clutch engaged at a range, two or more shafts were connected to rotate together. For range HMα(α=1, 2, 3, 4), both shafts “SPTO-Sc1-Sr2” and “Sc2-SOUT*(equivalent shaft of SHS1, SHS2and SOUT)-Sr1” were connected (shown in Fig.1), the dynamic model can be described as follows[19].

Where Iais equivalent rotational inertia of driving shaft, kg·m2; ωais angular velocity of driving shaft, rad/s; Tas, Tarare equivalent torque in the same and opposite direction as the driving shaft, N·m; IPTO, Icx(x=1,2), Irx(x=1,2), IOUT*are equivalent rotational inertia of PTO, carrier shaft of planet gear px, ring shaft of planet gear pxand equivalent output shaft, kg·m2; ωPTO, ωcx(x=1,2), ωrx(x=1,2), ωOUT*are angular velocity of the PTO, carrier shaft of planet gear px, ring shaft of planet gear pxand equivalent output shaft, rad/s; TPTO, Tcx(x=1,2), Trx(x=1,2), TOUT*, TPV, Tkβ(x=1,2,3,4) are torque of PTO, carrier shaft of planet gear px, ring shaft of planet gear px, equivalent output shaft, pump shaft and clutch kx, N·m.
As mentioned above, all of the components were assumed as rigid bodies, so the rotational inertia of each component needs to be calculated, such as the gears, shafts and clutches. When transmission shifted from a range to another, two range clutches enter the stage of slipping, the dynamic model is given as follows[20-21].

Where Ica, Icpare rotational inertia of driving and driven shaft of clutch, kg·m2; ωca, ωcpare angular velocity of driving and driven shaft of clutch, rad/s; Tca, Tcpare torque of driving and driven shaft of clutch, N·m; Tfis friction torque, N·m; τ is number of friction surfaces; ro, riare outer and inner diameter of friction surfaces, mm; Fnis press-on force of clutch, N; μ(ωd) is actual speed-dependent friction coefficient; pcis oil pressure, MPa; Acis equivalent area of piston, mm2; B is stiffness of return spring, N/mm; y is displacement of return spring, mm; y0is initial displacement of return spring, mm; ωdis average angular velocity difference over the friction disc, rad/s; μ0, μ are sticking and slipping friction coefficient; M1-M3are constant value; t is time, s.
According to the friction materials used in the clutch, the parameters of friction discs are shown: Sticking and slipping friction coefficient (μ0and μ) are respectively 0.11 and 0.07. M1-M3are constant value, and they are 0.85, 0.08 and 0.0004[22].

Fig.4 Model of power train with simulation X
Based on the theoretical analysis above, the power train was modeled under the commercial software SimulationX, including engine, hydraulic power split CVT and load, as shown in Fig.4.
In this model, the values of rotational inertia were calculated by the software of Pro/E and converted to adjacent shafts in view of the complex structure of these components; the press-on force Fnwas calculated by the model of clutches control system according to Eq.(11), and the effect of friction and leakage of cylinder were taken into consideration. Other properties of the power train component such as the geometric parameters of gears and wet clutches were obtained from the drawings of transmission or provided by the manufacturer. Part of the parameters the model used are shown in Table 1 and Table 2[19].
In order to verify the reliability of the power train model, 8 groups of testing program were designed. The test conditions with a form of “Supply pressure(MPa)- Flow(L/min) -Displacement ratio - Overlap time(s) - Input speed(r/min) -Load(N·m)” and the simulation results are shown in Fig.5, the results indicate that the transmission speed and oil pressure simulated basically tallies with the results measured.
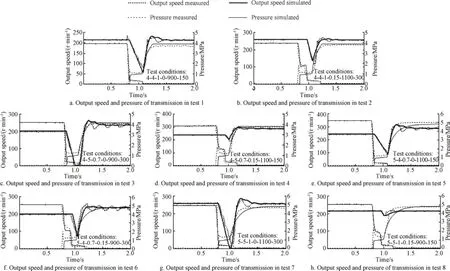
Fig.5 Validation results for transmission speed and shift pressure

Table 1 Equivalent rotational inertia of gears kg·m2

Table 2 Geometric parameters of wet clutches
2.3 Complete model of tractor
Based on the model of power train, a complete model of the tractor with the rear axle was built, including the main decelerator, differential gearbox, wheel reduction gears and wheels[23], as shown in Fig.6. It should be noted that the purpose of this study is to investigate the influence of design parameters on shift process of tractor, as pointed by Kim[14]. Therefore, it is not necessary to consider the absolute true impact values of the power train with the rear axle.

Fig.6 Complete model of tractor
2.4 Evaluating index of shift process
Considering that the speed drop is difficult to be determined when tractor shifts during acceleration, two speed-dependent evaluating indexes were calculated in this model to define the shift quality in shift process, i.e. the peak acceleration of tractor which was denoted by J1and the friction work of clutch which was denoted by J2[24-27].

Where J1is the peak acceleration of tractor, m/s2; J2is the friction work of clutch, kJ; v is the tractor speed, m/s; Plossis the power dissipated in the friction contact, kW; Δω is the angular velocity difference over the friction disc, r/min; ts, tdare the starting and termination time of shift, s.
According to the results reported by Duncan[28], the peak acceleration effects the ‘acceptability’ of ride comfort. Specially, the tractor acceleration would reach their extreme points in two times with opposite direction, the first extreme point was due to the disengagement of clutch, and the second extreme point was due to the engagement of clutch. The friction work affects the service life of clutch, and comparing with peak acceleration, this value reflects the “shift impact” on the system of transmission.
3 Dynamic simulation on shift process
3.1 Effect of shift starting time
Fig.7 shows the transmission ratio of the hydraulic power split CVT with different range and displacement ratio of PV and MF (Which was calculated by Eq.(1)-Eq.(4)). If the effect of the acceleration was omitted when the displacement ratio reached the maximum (i.e. the designed shift point), the transmission ratio pre and post shift would keep invariant. In this case, the starting time of shift has no effect on shift process.

Fig.7 Shift during process of infinite speed variation
In other case, assuming that the hydraulic power split CVT changed its transmission ratio from HM1to HM4along with the curve of transmission ratio, there would be 3 times of shifts during the process of acceleration. As shown in Fig.7, when the tractor shifted from range HM1to HM2at the shift starting time ts12, the displacement ratio of PV and MF had not reached the designed shift point tp12, in this case, the output speed of the tractor would have a steep rise when clutch k2completely engaged at the termination time td12. Then, when the tractor shifted from range HM2to HM3, the tractor did not shift until the displacement ratio of PV and MF turn back from the maximum value. Because of the retracement of displacement ratio, the output speed dropped first before shift and then increased again when clutch k3completely engaged at the termination time td23. Finally, when the tractor shifted from range HM3to HM4at the designed point tp34, the tractor speed also would have a jump when clutch k4completely engaged at the termination time td34because of the time delay in shift. For all of conditions, the transmission ratio of the hydraulic power split CVT between pre and post shift were no longer equal during acceleration.
In order to investigate the effect of the shift starting time on the shift process, the shift starting time was defined as the relative time when the transmission ratio changed from the shift starting point to the designed shift point. Further, the level of the acceleration was also considered in this paper which was defined as the change of the displacement ratio of PV and MF in a second. During the simulation, three levels of the acceleration were used, i.e. 0.1, 0.3 and 0.5. Fig.8 shows the simulation results of the shift process from rang HM1to HM2(same as below) under the different shift starting time. The results indicated that:
1) The change trend of the peak acceleration 1stwith the shift starting time was consistent with the change trend of the friction work of the clutch k1, as mentioned above, this phenomenon is because the first time of peak acceleration was due to the disengagement of clutch. If the shift starting time was 0.25 s, which was later than the designed shift point, both peak acceleration 1stand friction work of k1reached the minimum.
2) For a similar reason, the change trend of peak acceleration 2ndwith the shift starting time was consistent with the change trend of the friction work of the clutch k2, but the best shift starting time corresponding with the minimum peak acceleration 1stand friction work of k1was -0.65 s.

Fig.8 Curve of shift starting time against shift quality in shift process
3) Because both of the variable range of the peak acceleration 1stand the friction work level of the clutch k1was not significant, only the evaluating index of acceleration 2ndand friction work of k2needed to be considered. Therefore, the hydraulic power split CVT should start to shift before the displacement ratio of PV and MF reaching its maximum to reduce the shift impact, the best shift starting time was about -0.65 s.
4) The absolute value of the optimal shift starting time reduced with the increasing of the acceleration level, but the effect of the acceleration level on the optimal shift starting time was less.
3.2 Effect of clutch slipping time
Review the shift results of the first two groups of the validation experiments in section 2.2, as shown in Fig.9, 9 key points which were denoted by t1-t9were used to describe the curve of clutch pressure. For the clutch k1, the pressure dropped at the point t1when shift started. After a delay of ‘overlap time’ from point t1to t2to shorten the time of power interruption, the pressure dropped again from the point t2to t3quickly. Then, the piston of clutch k1started to move with a constant pressure from the point t3to t4, and the pressure dropped to zero finally. For the clutch k2, the pressure started to rise at the point t6, and then, the piston of the clutch k2started to move with a constant pressure from the point t7to t8, and the pressure rose up to the level of the supply pressure immediately. By comparing the two experimental results in Fig.9, it was found that:
1) The output speed dropped when the clutch was disengaged by the piston at t3, and the trend began to reverse when the piston of clutch to be engaged had moved to the end stop of cylinder at t8. In order to reduce the power interruption time to improve the shift quality in shift process, it is necessary to reduce the slipping time between t3and t8(the shadow area in Fig.9).
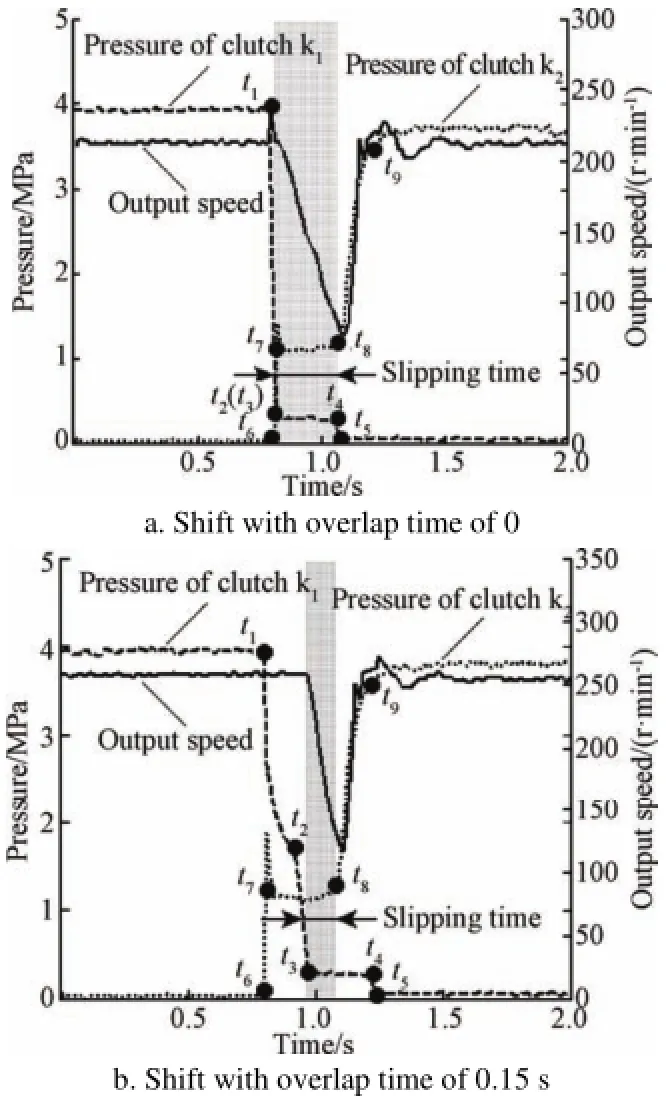
Fig.9 Shift experiments under different overlap time
2) The slipping time reduced with the increasing of the overlap time between t1and t2. However, t2is not allowed to exceed the time of t8, otherwise, both of the two clutch pressure would rise up to the supply pressure immediately, in this case, the clutch are very likely to be damaged and the strong brake toque would stall the engine during the process of tractor acceleration. Therefore, the time difference between t1and t8can be used to describe the maximum slipping time.
3) The maximum slipping time is a function of the flow and pressure of oil. As experimental results shown in Fig.10, the maximum slipping time reduced with the increasing of the flow, and the effect of the flow on the maximum slipping time was greater than that of the supply pressure.

Fig.10 Curve of volume flow and supply pressure against maximum slipping time
According to the analysis above, when the overlap time increased, the pressure would reach the time point t3later, and when the flow increased, the pressure would reach the time point t8in advance, as shown in Fig.9. Therefore, both of the two methods could shorten the period of the slipping time. For this reason, the speed impact of tractor and the friction power loss of clutch would decrease evidently by increasing the overlap time (with a top value of 0.2 s in this study) and the flow (with a top value of 6 L/min in this study), as shown in Fig.11. The rule in Fig.11 would apply to all levels of tractor acceleration according to further simulation results. Specially, Wang[15]had confirmed this conclusion through experiments without considering tractor acceleration.
3.3 Effect of swash plate axial piston units
As mentioned above, the transmission ratio of CVT is depended on the displacement ratio of PV and MF. Because of the compressibility of fluid and the inertia of mechanical system, the output speed is difficult to follow the input signal accurately during the tractor acceleration. Fig.12 shows the effect of the swash plate axial piston units on the shift process, both the hydraulic efficiency and the fluid volume (which was defined by the length of hoseline) were considered. For the factor of hydraulic efficiency, both friction work of the clutch k1and k2reduced slightly with the increasing of the efficiency. The trend of the peak acceleration 1stor 2ndaccording to the different efficiency was not significant. For the factor of the fluid volume, all evaluating indexes (expect for the peak acceleration 1stand the friction work of clutch k1) reduced as the hoseline length increased from 1 to 3 m. In view of the narrow variation range of the peak acceleration 1stand the friction work of clutch k1, it can be concluded that the small volume of this system should be used to improve the shift quality in shift process. Actually, the rule in Fig.12 is insignificant with decreasing of the tractor acceleration level. However, for most work conditions, the acceleration can not be neglected, so the Integrated Hydraulic Pump-Motor should be used in the transmission.

Fig.11 Curve of overlap time and volume flow against shift quality in shift process
3.4 Effect of work conditions
The work conditions include the traveling speed and load of the tractor. For the traveling speed, if the tractor shifted during an acceleration traveling, the transmission ratio of the CVT can not keep constant at pre and post shift, and the angular velocity difference among the friction discs of the clutch was a function of the traveling speed of the tractor. In this case, the power loss would increase with the increasing of the traveling speed of the tractor, which is an adverse effect on the shift quality in shift process. But actually, because the difference of transmission ratio between the pre and post shift is small, there is only a slight increase of power loss with the increasing of tractor traveling speed, as shown in Fig.13. For the load of the tractor, all evaluating indexes increased as the load increased from 10 to 30 kN, which indicated that the heavy load caused about the bad shift quality in shift process. For this reason, only a heavy load should be considered during the calibration of the shift quality. Specially, the effect of the tractor speed on evaluating indexes in Fig.13 would be eliminated when the transmission shifted without accelerating, but the effect of the load on shift process could not be neglected still.

Fig.12 Curve of hydraulic efficiency and volume against shift quality in shift process
3.5 Effect of tractor weight
Fig.14 shows the effect of the tractor weight on the shift process. With the increasing of the tractor weight from 4.5 to 10.5 t, the minimum tractor traveling speed during shift increased from 3.21 to 3.92 km/h, the maximum tractor acceleration during shift reduced from 2.64 to 1.32 m/s2, the peak friction power of the clutch k2during shift reduced from 12.7 to 6.32 kW, and correspondingly, the time integral of the friction power of the clutch k2(i.e. the friction work) during shift reduced from 2.74 to 2.14 kJ. The results indicated that the shift quality in shift process improved by increasing the mass of tractor. However, because the large inertia mass leads to big impact of dynamic load, as shown in Fig.14, especially in the process of acceleration, the tractor weight should be limited. The same as the effect of the overlap time and the flow on shift process, the rule in Fig.14 would apply to all levels of tractor acceleration, according to further simulation results.

Fig.13 Curve of traveling speed and load of tractor against shift quality in shift process

Fig.14 Curve of tractor weight against shift quality in shift process
4 Conclusions
The effect of the design parameters on the shift process of the hydraulic power split CVT(continuously variable transmission) during acceleration was investigated in this paper, and the main conclusions are as follows:
1) In order to reduce the impact, the transmission should start to shift before the displacement ratio of PV(variable hydraulic pump) and MF(fixed hydraulic motor) reached the maximum value. In this study, the best shift time is about −0.65 s.
2) The slipping time of the clutch reduced with the increasing of the overlap time and flow, and the shift quality in shift process was improved correspondingly. The top value of overlap time and flow in this study are 0.2 s and 6 L/min, respectively.
3) The small fluid volume and high efficiency of the swash plate axial piston units would produce a good shift quality in shift process. For this reason, the integrated hydraulic pump-motor should be used in the transmission.
4) With increasing of the traveling speed and load of tractor, the shift impact increased correspondingly. Specially, for the same transmission ratio at the shift point, the traveling speed of the tractor was determined by the engine speed. Therefore, the maximum working speed of the engine should be limited in order to improve the shift quality in shift process.
5) The large tractor weight can reduce the speed impact of tractor and the friction work of clutch but lead to bad impact on dynamic load. Both of the effects on shift process should be considered in tractor design.
[Reference]
[1] Karparvarfard S H, Rahmanian-Koushkaki H. Development of a fuel consumption equation: Test case for a tractor chiselploughing in a clay loam soil[J]. Biosystems Engineering, 2015, 130(2): 23-33.
[2] Patel S K, Mani I, Srivastava A P. The effect of tractor load and trafficking on wheat crop yield[J]. AMA, Agricultural Mechanization in Asia, Africa and Latin America, 2014, 45(2): 70-73.
[3] Xie Bin, Zhang Chao, Chen Shuo, et al. Transmission performance of two-wheel drive electric tractor[J]. Transactions of the Chinese Society for Agricultural Machinery, 2015, 46(6): 8-13.
[4] Brenninger M M. Fendt vario CVT in agricultural tractors[C]//Commercial Vehicle Engineering Congress and Exhibition. Rosemont: SAE International, 2007:1-9.
[5] Geske D M. Bigger, smarter tractors from fendt[J]. Diesel Progress North American Edition, 2004, 70(8): 68-70.
[6] Pfeiffer F, Bork H, Srnik J, et al. Dynamik der fendt vario getriebe[J]. VDI Berichte, 2001, 2001(1592): 469-486.
[7] Renius K T, Resch R. Continuously variable tractor transmissions[C]//2005 Agricultural Equipment Technology Conference. Louisville: ASME, 2005: 1-37.
[8] Kugi A, Schlacher K, Aitzetmuller H, et al. Modeling and simulation of a hydrostatic transmission with variable-displacement pump[J]. Mathematics and Computers in Simulation, 2000, 53(4): 409-414.
[9] Pohlenz J, Gruhle W D. The ECCOM continuously variable hydrostatic-variable power-split transmission for use in tractors[J]. VDI Berichte, 2001, 2001(1592): 451-468.
[10] Meyer H J.Fahrzeuggetriebetechnik getriebe in traktoren[R]. Berlin: TU Berlin, 2009.
[11] Appleton A, Wiles T, Bowman D. The next generation John Deere 8000 series tractor improvements and adaptations[J]. VDI Berichte, 2005, 2005(1895): 77-89.
[12] Coutant A R, Marr J D. Method for controlling shift points in a continuously variable transmission[P]. U. S. Patent: 5624339, 1997-04-29.
[13] Kuras B D. Method and apparatus for adaptively shifting ranges in a continuously variable transmission[P]. U. S. Patent: 6295497, 2001-09-25.
[14] Kim D C, Kim K U, Park Y J, et al. Analysis of shifting performance of power shuttle transmission[J]. Journal of Terramechanics, 2007, 44(2): 111-122.
[15] Wang Guangming, Zhu Sihong, Shi Lixin, et al. Experimental optimization on shift control of hydraulic mechanical continuously variable transmission for tractor[J]. Transactions of the Chinese Society of Agricultural Engineering (Transactions of the CSAE), 2013, 29(18): 51-59. (in Chinese with English abstract)
[16] Ni Xiangdong, Zhu Sihong, Zhang Haijun, et al. Experiment of shift quality factors for hydro-mechanical CVT[J]. Transactions of the Chinese Society for Agricultural Machinery, 2013, 44(6): 29-34.
[17] Ni Xiangdong. Study on Features of Multisession and Double Row Confluence Hydro-mechanical Continuously Variable Transmission of Tractor[D]. Nanjing: Nanjing Agricultural University, 2013. (in Chinese with English abstract)
[18] Wang Guangming, Zhu Sihong, Wang Shenghong, et al. Speed ratio control of tractor hydraulic mechanical CVT[J]. Transactions of the Chinese Society of Agricultural Engineering (Transactions of the CSAE), 2013, 29(7): 17-23 (in Chinese with English abstract)
[19] Chang Yalei. Research on Dynamic Characteristics in Shifting Process of Hydro-mechanical Continuously Variable Transmission Used on the Unroad Vehicle[D]. Nanjing: Nanjing Agricultural University, 2012. (in Chinese with English abstract)
[20] Iqbal S, Ai-Bender F, Ompusunggu A P, et al. Modeling and analysis of wet friction clutch engagement dynamics[J]. Mechanical Systems and Signal Processing, 2015, 60: 420-436.
[21] Hwang H S, Yang D H, Choi H K, et al. Torque control of engine clutch to improve the driving quality of hybrid electric vehicles[J]. International Journal of Automotive Technology, 2011, 12(5): 763-768.
[22] ITI GmbH. ITI SimulationX Help Menue[M]. Dresden: ITI GmbH Headquarters, 2010.
[23] Dworecki Z, Fiszer A, Loboda M, et al. Calculation of tractor and agricultural machines moments of inertia[J]. Journal of Research and Applications in Agricultural Engineering, 2005, 50(3): 20-23.
[24] Gan Haiyun, Zhang Junzhi, Lu Qingchun, et al. The shifting quality control of automotive powertrain system[J]. Automotive Engineering, 2003, 25(5): 487-489.
[25] Duan Jianrui, Yao Jin, Li Hua. The calculation method of lock-up clutch friction work[C]//2013 2nd International Conference on Sensors, Measurement and lntelligent Materials. Guangzhou: Trans Tech Publications Ltd, 2014: 1375-1381.
[26] Xu Liyou, Liu Hailiang, Zhou Zhili, et al. Evaluation indexes of shifting quality for dual clutch transmission for tractor[J]. Transactions of the Chinese Society of Agricultural Engineering (Transactions of the CSAE), 2015, 31(8): 48-53. (in Chinese with English abstract)
[27] Zhao Zhiguo, Chen Haijun, Zheng Zhengxing, et al. Optimal torque coordinating control of the launching with twin clutches simultaneously involved for dry dual-clutch transmission[J]. Vehicle System Dynamics, 2014, 52(6): 776-801.
[28] Duncan J R, Wegscheid E L. Determinants of off-road vehicle transmission ‘shift quality’[J]. Applied Ergonomics, 1985, 16(3): 173-178.
拖拉机液压机械无级变速器加速换段过程动力学仿真
王光明1,张晓辉1※,朱思洪2,张海军2,马 然3,太健健1
(1.山东农业大学机械与电子工程学院,泰安 271018;2.南京农业大学工学院,南京 210031;3.江苏师范大学机电工程学院,徐州 221116)
拖拉机加速行驶时,破坏了严格意义上的液压机械无级变速器等速换段条件,加之惯性负载的影响,需要对拖拉机加速过程中液压机械无级变速器的换段过程及其影响因素进行研究。首先,在Simulation X下构建了现有试验台架的传动系统模型,包括发动机、变速器、负载以及离合器控制油路,并对其进行了试验验证。考虑到拖拉机加速过程中惯性质量对换段过程的影响,在前述模型的基础上,进一步构建了包括后桥在内的完整拖拉机模型。而后,基于换段期间拖拉机的峰值加速度与离合器摩擦损耗2项指标,对5组可能对换段过程构成影响的拖拉机或变速器工作参数进行了仿真分析。结果表明,在变速器理论换段点之前开始换段(该研究取−0.65 s),延迟待分离离合器的卸油时间(该研究取0.2 s),提升待接合离合器的流量水平(该研究取6 L/min),使用一体式泵控液压马达以及限制换段时的发动机最高转速,均可提升拖拉机在加速换段过程中的换段品质。此外,拖拉机的设计质量应当综合考虑速度冲击与动载冲击的影响。该研究可为拖拉机无级变速器及其控制系统的研究提供参考。
拖拉机;计算机仿真;模型;换段品质;功率分流;变速器
10.11975/j.issn.1002-6819.2016.09.005
S219.032.1 Document code: A Article ID: 1002-6819(2016)-09-0030-10
Wang Guangming, Zhang Xiaohui, Zhu Sihong, Zhang Haijun, Ma Ran, Tai Jianjian. Dynamic simulation on shift process of tractor hydraulic power split continuously variable transmission during acceleration[J]. Transactions of the Chinese Society of Agricultural Engineering (Transactions of the CSAE), 2016, 32(9): 30-39. (in English with Chinese abstract)
10.11975/j.issn.1002-6819.2016.09.005 http://www.tcsae.org
王光明,张晓辉,朱思洪,张海军,马 然,太健健. 拖拉机液压机械无级变速器加速换段过程动力学仿真[J]. 农业工程学报,2016,32(9):30-39. doi:10.11975/j.issn.1002-6819.2016.09.005 http://www.tcsae.org
date:2015-07-26 Revised date:2016-02-21
s:“948” Foundation of Ministry of Agriculture of China (2010-Z18); Jiangsu Key Technology Support Program (BE2014134); Jiangsu “Enterprise-Academics-Research” Foundation (BY2014128-04).