Column test-based features analysis of clogging in artificial recharge of groundwater in Beijing
2016-12-12NANTianSHAOJingliCUIYali
NAN Tian, SHAO Jing-li, CUI Ya-li
1School of Water Resources and Environment, China University of Geosciences (Beijing), Beijing 100083, China.
2Department of Earth, Ocean & Atmospheric Science, Florida State University, Tallahassee FL 32303, U.S.A.
Abstract: With the completion of South-North Water Transfer Project in China, plenty of high quality water will be transported to Beijing. To restore the groundwater level in Beijing, part of transferred water is planned to be used for artificial recharge. Clogging is an unavoidable challenge in the artificial recharge process. Therefore, a test is designed to analyse clogging duration and scope of influence and to test the reinjection properties of different recharge media. The test employs the self-designed sand column system with variable spacing and section monitoring, composed of four parts: Sand column, water-supply system, pressure-test system and flow-test system, to simulate the clogging of artificial recharge of sand and gravel pits. The hydraulic conductivity levels of all sand column sections are obtained to analyse the clogging of the injection of different concentrations in media of different particle sizes. In this experiment, two kinds of media are used-round gravel from sand and gravel pit in Xihuang village and the sand from sand and gravel pit by the Yongding River. The concentrations of recharge fluid are respectively 0.5 g/L and 1 g/L. The results show that clogging usually lasts for 20 hrs., and the hydraulic conductivity drops to the original 10%. Clogging usually occurs at 0-12 cm section of the sand column. The scope of influence is 0-60 cm. In column 3 and 4,whose average particle sizes are larger, section 20-50 cm also suffers from clogging, apart from section 0-12 cm. The effective recharge times are respectively 33 hrs. in column 1, 14 hrs. in column 2, 12 hrs. in column 3 and 12 hrs. in column 4. The larger the average particle size is,the quicker the clogging occurs. In media of larger particles, the change in suspension concentration does not have significant influence on the development of clogging. In conclusion,it is suggested that during artificial recharge, the conditions of reinjection medium should be fully considered and effective method of recharge be employed in order to improve effective recharge time.
Keywords: Recharge clogging test; Recharge conditions; Hydraulic conductivity; Clogging scope of influence; Clogging rate
Background
The environmental geological problems caused by groundwater exploitation have become a bottleneck for economic and social development.Over the years, the excessive exploitation of the groundwater resources in Beijing has resulted in the gradual depletion of groundwater, land subsidence and groundwater quality deterioration(SUN Ying and MIAO Li-wen, 2001). With the completion of the South-North Water Transfer Project, the vacated groundwater storage space from over exploitation can be used for artificial recharge, which can not only prevent environmental geological problems, but also address current concerns by alleviating water shortage and improving water security in Beijing.
The surface water infiltration is an important way of artificial recharge (DU Xin-qiang et al.2009). However, suspension clogging will reduce the recharge capacity and affect the lifespan and effectiveness of the recharge projects (REN Fu-yao et al. 1985; PU Chun-sheng et al. 2005). For example, the deep-well artificial recharge that started in1981 had been reduced to 13 units from the initial 64 by the end of 1999. According to the research data by Lindsey et al. (1992), the 207 surface rain flood systems built in Maryland has reached a scrap rate of 50% within 6 years in 1990.Various studies suggest that the mechanism of clogging is complex and that it has the following main forms: Physical clogging during surface water recharge between the suspended solids and the medium (HUANG Xiu-dong et al. 2009a; LU Ying, 2009); gas clogging resulted from the air that cannot be replaced by the recharge water (ZENG Xiao-jia and LI Xiao, 2006); soil compaction clogging from the high waterhead pressure (HE Jiang-tao et al. 2003); chemical clogging caused by calcium and iron ions in recharge water and the biological clogging resulted from breeding(ZHANG Yong-hua, 2005; Nevo Z and Mitchell R,1967). Among these, physical clogging is the most important form that affects recharge efficiency(Iwasaki T et al. 1937; Stein P C, 1940). However,clogging in practical scenarios is usually the result of the interaction among several forms of clogging.
In the early 1980s, Dutch scholars, Schippers et al. (1980) evaluated the physical clogging potential of well recharge, using the MFI (modified Fouling index) method. This method can only be applied to strict physical clogging, and needs to assess the experiment results from both the indoor and outdoor tests. At the end of 1980s, through formula derivation, Harmeson et al. (1968) established the relationship formula between infiltration rate and suspended sediment concentration; Taylor et al.(1990) established the relationship formula between the aquifer hydraulic conductivity and biological organic carbon (BOC); for the physical clogging caused by artificial recharge, Olsthoorn(1982) proposed a semi-empirical model between permeability and TSS. In 1996, based on the experimental data, Osei-Bonsu (1997) put forth a mathematical model for physical blocking, which describes the variation patterns of medium hydraulic conductivity over time under different physical clogging conditions. However, most empirical models derived from formulas are limited by factors such as climate, water source,aquifer and recharge process. HU Cai-zhi et al.(2004) simulated the percolation process of the gravel packed well with physical experiments.They studied the clogging patterns of the gravel packed well by observing the changes in clogging locations and particle size composition in each percolation section. LI Lu et al. (2010) conducted sand tank penetration test to simulate the groundwater artificial recharge process. The test shows that the main type of blocking is physical clogging due to suspended particles absorption, and that the hydraulic conductivity of aquifer tends to decrease from a high to a stable level with recharge time,and that the clogging is increasingly severe from the centre to the border of recharge. LUN Zeng-min (2006) adopted the core flow experiment method and studied the clogging features of the suspended particles injected in water to the reservoir porosity. The test shows that when the concentration of the suspended particles is low and the ratio of particle size to pore size is large, pores tend to form and gradually cause clogging; and that when the concentration of the suspended particles is high or the ratio of particle size to pore size is small, clogging tends to occur quickly.HUANG Xiu-dong et al. (2009b) used the sand column to simulate the sand layer clogging process around the injection well during well recharge in the laboratory. The test shows that the mechanical clogging and the microbial clogging are main types of the sand column blockage, and that the upper portion of the sand column clogging is more severe.In addition, the medium size difference has an obvious impact on the clogging process and severity-the sand columns with smaller average particle size are more prone to be blocked. In experiments, the development patterns of clogging can be clearly observed, but it is greatly restricted by the experiment conditions.
Whether to study the mechanism, or the causes and the development patterns of clogging, indoor or outdoor tests under certain conditions should be conducted. Tank tests and sand column tests are the main methods. This research uses self-designed sand column test system and samples the soil from Yongding River sand pit and Xihuang Village sand pit, to simulate the groundwater recharge process of suspended solids with different concentration levels. After measuring the piezometric waterhead using Darcy's law, the sand column partition coefficient is calculated to examine the clogging causes and patterns during recharge. To a certain extent, the test can help understand the clogging features of different recharge media in planned artificial recharge areas in Beijing. It analyses the feasibility of groundwater artificial recharge in Beijing and offers some thoughts on treating recharge clogging.
1 Testing equipment and method
1.1 Testing equipment introduction
The testing equipment (Fig. 1) consists of sand columns, water supply system, pressure measuring system and the flow-gauging system (Fig. 2).
The sand columns are made of PMMA, 5 mm thick, 120 cm high, inner diameter about 14 cm. At its top and bottom are respectively a 10 cm flow buffer zones. In the middle is a 100 cm percolation zone. Three sections are separated by sieve plates with holes. On the column walls are 31 pressure taps, one on top buffer zone and one on bottom buffer zone. There are 30 pressure taps from top to bottom in the percolation zone, with an intervals of 2 cm from the first to the 10th, 3 cm from the 10thto 20th, and 5 cm from the 20thto 30th.
Water supply system consists of pump,pipeline and waterhead equipment. The pump is used for pumping and stirring, so as to ensure the concentration stability of the recharge turbid fluid;the height of the waterhead can be adjusted to keep the waterhead at a stable position.
Pressure measuring system consists of observation plate and coordinate paper. The pressure measuring pipes on the observation plate is set up independently and connected to the pressure tap on the sand columns; the coordinate paper is tiled on the observation plate so that the waterhead value can be easily read.
Flow-gauging system consists of stopwatch,measuring cylinder and beaker. The flow rate is calculated by measuring the water yield in a certain period (generally 2 minutes). See Fig. 2 for sketch graph of simulation test.
In order to ensure similar porosity of the disturbed soil sample and the natural soil, the soil sample filling follows these steps: (1) Sample filling and saturating: put nylon net on sieve plate before sample filling in order to prevent soil leakage; (2) Put dry and loose testing medium into columns layer by layer according to the testing density. Filling of the sample soil is done in dry piling method and is calculated with the testing dry volume weight γ. The weight of the 3-5 cm soil body is calculated according to the soil height,inner diameter of the organic glass columns and the testing dry volume weight. The soil is then put into the organic glass columns after being weighed(accurate to 0.1 g ) and then pressed layer by layer;(3) At the same time, fill the soil columns with water from the bottom upward until the water level reaches the surface of the soil sample, and then continue sample filling until the total soil height reaches 92 cm. Finally, tile the nylon net on the top of the columns and pave 5 cm silica sand, and the filling is completed.
The calculation formula for the weight of mediums in each layer is:

where: V-volume of soil in each filling (cm3);γ-dry volume weight of natural soil body (g/cm3);r-inner diameter of organic glass column (cm);h-height of filling per layer (cm).

Fig. 1 Testing equipment

Fig. 2 Sketch map of clogging test
In order to compare the recharge clogging features in different areas with different particle size composition sand suspended solids of different concentration levels, the media from two planned artificial recharge areas-gravel sand from the sand and gravel pit by the Yongding River and round sand from the sand and gravel pit in Xihuang Village are selected. After filling, the unit weight of the testing soil columns is respectively 1.9 g/cm3and 2.3 g/cm3. See Fig. 1 for soil sample compositions. It shows that the recharge medium of the Yongding River consists mainly of gravel and sand gravel, and that the medium of Xihuang Village has a higher content of rocks. Compared to the media from the Yongding River gravel pit, the medium particles of Xihuang Village are concentrated in the rocksand gravel stones with larger pores. The suspended solids of 1 g/L and 0.5 g/L disposition concentration are divided into 4 groups and put into recharge clogging tests. The 4 sand columns are numbered as 1, 2, 3, 4. For group 1 and 2, the medium is gravel sand from the Yongding River sand and gravel pit, and the percolation suspended solid concentrations are respectively 0.5 g/L and 1 g/L; for group 3 and 4,the medium is round gravel from Xihuang Village and the percolation suspended solid concentrations are respectively 0.5 g/ and 1 g/L. See Table 1 for detailed group conditions.

Table 1 The particle size composition of medium and the concentration level of suspension fluids in the artificial recharge test
1.2 Test method
The clogging is caused by the infiltration of water flow in the medium. Its features and effects are mainly demonstrated by the hydraulic conductivity of the medium. The inflow and outflow waterheads are kept stable during the experiment, in order to measure the flow rate and waterhead values of pressure measuring pipes in all sections of the sand column at certain time intervals. Sand column hydraulic conductivity is calculated according to the Darcy's law:

where: Q-flow rate (m3/d); Δx-interval between any two pressure measuring pipe (m);Δh-waterhead difference of the two pressure tubes(m); r-inner diameter of sand columns (m).
Four groups of test are carried out according to medium types and the difference of the recharge suspension fluid concentration. The external conditions in each group stay consistent, and the recharge suspension fluid is put into the sand column from the top down. By adjusting the water level device, the waterhead difference at the bottom of the sand column is kept around 1.2 m.The waterhead value of the pressure measuring pipe is taken at certain intervals (10 min, 20 min,30 min, 1 hr., 2 hrs., 3 hrs., 5 hrs., etc.). At the same time, the measuring cylinder and the stopwatch are used to calculate the flow rate. Each group of tests lasts 180 hrs. and produces 324 sets of data.
It is worth noting that, in order to ensure the reliability of the results, prior to the recharge test,clean water is put into the sand column continuously to calculate the hydraulic conductivity of the water-bearing medium. Once the hydraulic conductivity of the sand column gets stable,peristaltic pump is used to extract the recharge water to supply the sand column at given rates.
2 Result analysis and discussion
2.1 Analysis of change of hydraulic conductivity coefficient
In order to compare the difference of the levels of clogging at different locations of the sand column, the change of hydraulic conductivity of the top (0-12 cm) and other parts (12 cm-100 cm)of the sand columns during the recharge process is respectively analysed. The hydraulic conductivity rate of changing is Vk:

where: Vk-rate of changing of the hydraulic conductivity; Ke-hydraulic conductivity at the end of the period (m/d); Ki-hydraulic conductivity at the start of the period (m/d).
According to the measurement and calculation,the hydraulic conductivity of the 4 sand column groups in the 0-12 cm section is respectively 2.07 m/d, 3.30 m/d, 7.28 m/d and 12.41 m/d. As is shown in Fig. 3, the hydraulic conductivity is higher for group 3 and 4 sand columns (round gravel medium from Xihuang Village), where particle sizes are larger. The hydraulic conductivity of the 4 groups all experiences a slight fluctuation or a slow rising about 5-20 hrs. before the test; the range of fluctuation is smaller where the particle size is smaller, and correspondingly, the slowing rising continues longer. This phenomenon is mainly caused by the air dissolving into water in the medium. During 10-35 hrs., as the suspended solids in recharge water accumulate in the sand columns, pores in the medium are filled and the hydraulic conductivity of the 4 sand column groups decreases quickly in succession. After 30 hrs. in the test, as the clogging medium composition and structure stabilizes, so does the hydraulic conductivity in each sand column. In the end, the hydraulic conductivity of the 4 sand column groups stabilizes around 0.75 m/d, 0.14 m/d, 0.56 m/d and 1.25 m/d. Table 2 shows that the hydraulic conductivity variation of the sand column group 1 is relatively small, and its hydraulic conductivity stabilizes at 36.23% of the initial level in the end;the hydraulic conductivity of other sand column groups decreases at a larger range, and stabilizes at 10% of the initial level in the end.
As Table 3 shows, the hydraulic conductivity of the 4 sand column groups in the 12-100 cm section changes at a smaller range and slightly rises. The main reason for rising conductivity is that the clogging in 0-12 cm section lowers the suspension concentration and the number of suspended solids. When clogging stabilizes in the 0-12 cm section, the suspended solids entering the 12-100 cm section also become stable, thus the hydraulic conductivity of this section stabilizes too.
In conclusion, the clogging mainly occurs at the 0-12 cm section. Except the clogging in sand column group 1, which starts from the 20thhour,clogging starts from the 10thhour in other sand columns. The clogging usually continues for about 20 hours and then its hydraulic conductivity tends to stabilize.

Table 2 Changes of hydraulic conductivity in 0-12 cm section
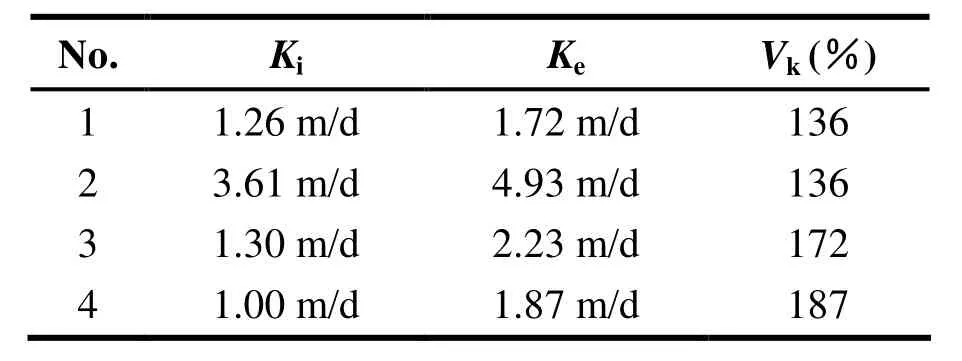
Table 3 Changes of hydraulic conductivity in 12-100 cm section
2.2 Clogging rate analysis
As the conditions in the sand columns may vary during the process of filling and testing, the horizontal comparison of hydraulic conductivity is affected. The parameter λ used to represent the development rate of the clogging can help reduce the deviation, and help identify the influence of the concentration and particle size to the clogging development rate.
The clogging rate is one of the important parameters to demonstrate the speed of clogging development. In 1978, Bianchi put forth a general formula to describe multiple clogging problems:

where: K0-initial hydraulic conductivity (m/d);K∞-hydraulic conductivity in the end (m/d); λ-rate of clogging (d-1); t-time (h). In calculation, the hydraulic conductivity is from the decreasing stage in the test, and the initial hydraulic conductivity is the maximum Kmaxin the test process.
According to the regression analysis theory,discrete values of hydraulic conductivity at different times are adopted, and the formula of λ can be derived from formula (4):

From Table 4, the clogging rate of the group 3 and 4 sand columns (round gravel from Xihuang village sand and gravel pit) with larger average particle sizes is higher than that of group 1 and 2 sand columns (gravel sand from Yongding River sand and gravel pit). This is mainly because that the recharge water flows more quickly in the media with larger particle sizes, and the physical clogging processes such as infiltration, sediment and compaction are accelerated. Comparing group 1 and 2 sand columns, the clogging rate of the group 2 sand column, which has a higher suspension concentration, is quicker. However, in the group 3 and 4 sand columns, with bigger particle sizes, the suspension concentration has little impact on the clogging rate.
From the study of the clogging rate and the change of the hydraulic conductivity, the effective recharge time can be deducted. In this test, the effective recharge time is defined as the time for hydraulic conductivity in the 0-12 cm section to reduce from the initial value to half. Combining the section 3.1 of this paper, the effective recharge time of the 4 sand column groups respectively are:Group 1, 33 hrs.; group 2, 14 hrs.; group 3, 12 hrs.;and group 4, 12 hrs.
2.3 Analysis of clogging's scope of influence
In order to further analyse the vertical changes in clogging's development, this study analyses the influence scope of the clogging. Name the ratio of hydraulic conductivity at the end of the clogging and the maximum hydraulic conductivity in each section as K', and define the depth of K'<1 as the influence scope of clogging. According to sections 3.1 and 3.2, the clogging of the 4 sand column groups stabilizes after 30 hrs. in the test. Therefore,the vertical distribution of K' at the 30thhr. is chosen for analysis.
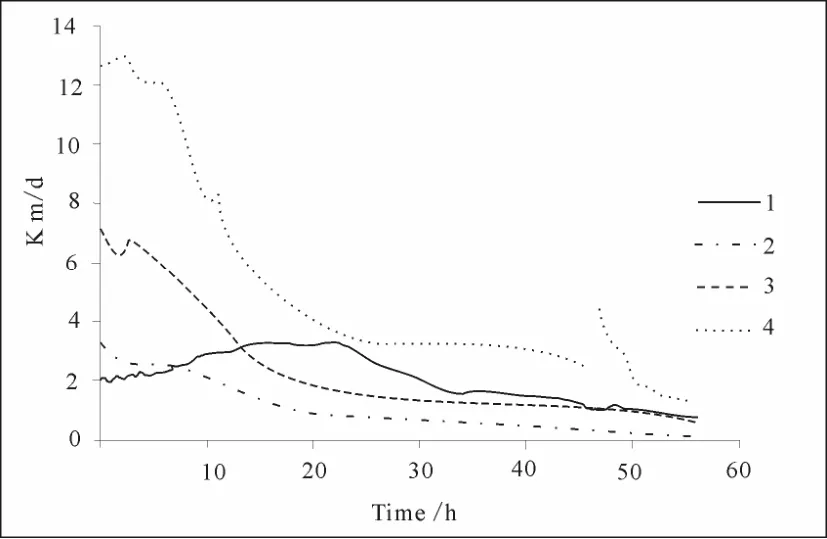
Fig. 3 The changing curve of hydraulic conductivity to time in 0-12 cm section

Table 4 Clogging rate and parameters related to hydraulic conductivity
Fig. 4 shows that K' is smaller than 1 at sections above 60 cm in the 4 groups of sand columns. Particularly, it is smaller in the 0-12 cm section; at the part above 12 cm, K' fluctuates,indicating that the clogging in parts above 12 cm of the sand column is unevenly distributed. K'variation curve of the No.1 and No.2 sand columns show that K' in sections deeper than 10 cm of the No.2 sand column, which has higher suspension concentration, fluctuates more intensively; while the No.1 sand column has smaller fluctuation. In the 10-20 cm section of No.3 and No.4 sand columns, where the medium is round gravel, K' is larger and clogging is less severe; but in 20-50 cm section, K' reduces as the depth increases, and gradually rises below 50 cm.
To sum up, the clogging influence scope is 0-60 cm. The 0-10 cm sections of the No.1 and No.2 sand columns are strongly influenced; the higher suspension concentration is, the more clogging distribution fluctuates. 0-10 cm and 40-50 cm sections of No.3 and No.4 sand columns are strongly influenced; and at the 20-40 cm section, hydraulic conductivity reduces as depth increases. Overall, in the sections below 10 cm, the clogging is relatively mild and it is less sensitive to the changes of suspension concentration.
2.4 Discussion
(1) In this study, the definition and judgment of effective recharge time and the influence scope of clogging are subject to human influence. The concept of effective recharge time and the influence scope of clogging should be clearly defined in the future research and should draw from latest studies from home and abroad.
(2) The artificial recharge clogging is a complex physical, biological and chemical process,influenced by many other factors in practice, such as the depth of the groundwater level, the chemical and biological properties of artificial recharge water, the biochemical properties of the groundwater, the local climatic conditions, etc. Due to limits of conditions, this experiment fails to analyse the potential chemical and biological clogging processes in the sand column. The duration, impacts on the physical, chemical,biological clogging and other clogging should be further studied.
(3) In the process of the practical surface percolation and recharge, the recharge process is intermittent, but the recharge is continuous in this experiment. The difference between the two methods needs to be studied through comparative test sand analysis. The clogging treatment and its effect also need to be verified by further tests.
3 Conclusions
(1) The self-designed sand column system consists of sand column, water supply system,pressure measurement system and the flow measurement system. The test selected gravel sand from the Yongding River sand and gravel pit and round gravel from Xihuang Village sand and gravel pit as media; by observing the waterhead changes in each section during the recharge process, the changes of hydraulic conductivity K in different periods is calculated. And the result truthfully reflects the development process and the degree of clogging.
(2) The experiment finds that the influence scope of clogging to the sand column is generally in the 0-60 cm section; the severe clogging usually occurs in the 0-12 cm section; in the No.3 and No.4 sand columns with larger particle sizes,severe clogging occurs at the sections 0-12 cm and 20-50 cm. The effective recharge time of the 4 groups sand columns respectively are: group 1,33 hrs.; group 2, 14 hrs.; group 3, 12 hrs.; and group 4, 12 hrs. It can be concluded that clogging occurs faster in the mediums with larger particle size. In conclusion, it is advisable that when selecting a recharge place, one should consider the recharge volume, recharge water quality and economic benefits to balance the recharge rate and the clogging development rate.

Fig. 4 The variation curve of K'
Acknowledgements
This study is supported by public welfare geological investigation and scientific project of Beijing (2010): The key technology on clogging features analysis of groundwater artificial recharge.
杂志排行

地下水科学与工程(英文版)的其它文章
- Characteristics analysis and model prediction of sea-salt water intrusion in lower reaches of the Weihe River,Shandong Province, China
- Features and evaluation of sea/saltwater intrusion in southern Laizhou Bay
- Distribution characteristics of tritium in the soil in Beishan area of Gansu Province
- Evaluation of the water resources carrying capacity of Shandong peninsula, China
- Study on ecological and economic effects of land and water resources allocation in Sanjiang Plain
- Research on Pisha-sandstone's anti-erodibility based on grey multi-level comprehensive evaluation method