Dynamic assessment of pollution risk of groundwater source area in Northern China
2016-11-25LIUShuyuanWANGHongqi
LIU Shu-yuan, WANG Hong-qi
College of Water Sciences, Beijing Normal University; Key Laboratory of Water and Sediment Sciences,Ministry of Education, Beijing 100875, China.
Abstract: Based on the dynamic analysis and research of pollution risk of groundwater sources,this paper creates the dynamic assessment method of pollution risk of groundwater source area under the theory of “source-pathway-receptor”, and applies this method to one typical fissure karst groundwater source area in northern China. Following the 30-year petroleum pollutant migration simulation and pollution risk assessment of groundwater source area, this study finds that the very high risk zone is mainly located in Q Petrochemical Company and the surrounding area and the area adjacent to River Z. Within this period of thirty years, the pollution risk of groundwater source area has showed a dynamic trend that features an inverted “V” shape. The ratio of very high risk zone to the total area will be 18.1%, 17.47%and 16.62% during the tenth year, the twentieth year and the thirtieth year separately, and will reach the highest level of 19.45% during the fifteenth year. Meanwhile, the vertical migration distance of pollutant centre concentration changed from the surface soil at the outset to the deepest point of about 250 meters underground during the tenth year. The results of this risk assessment indicate the dynamic feature of pollution risk. The dilution, degradation and migration of petroleum pollutants in groundwater system contribute to an ultimate decline in pollution risk.
Keywords: Dynamic; Groundwater pollution risk assessment; Groundwater source area
Introduction
As an essential source of fresh water,groundwater resources play a significant role in the economy, society, production and life. Due to the chemical and biological properties of groundwater,it has been widely applied to industrial, agricultural and everyday life (Majandang J et al. 2013).In China, more than 1/3 of the total population use groundwater as the source of drinking water. The exploitation of groundwater results in a series of problems as well. In fact, the groundwater pollution has become one of the most widely found environment problems (Fatta D et al. 2002;Dimitriou E et al. 2008). According to the Report on the State of the Environment in China 2015, the shallow groundwater quality as a whole is poor,but the deep groundwater quality is better; the groundwater with small exploitation is of better quality than the groundwater with excessive exploitation; the groundwater in most cities suffers the pollution to point source pollution and diffused pollution to some degree; the deterioration of groundwater quality mainly happens in North China, Northeast China and Northwest China.Human activities exert a strong pollution pressure over groundwater quality and quantity. Once groundwater resources are polluted, it takes huge time and financial resources to control the groundwater pollution. Therefore, to guarantee human beings’ long-term effective use of groundwater, we must tighten the management over groundwater.
The groundwater pollution risk is the extended version of groundwater vulnerability, the possibility that the pollution to groundwater in aquifer because of human activities has reached an unacceptable level, and the joint operation of groundwater pollution probability and consequence (Morris B and Foster S, 2006). The results of groundwater risk assessment may reveal the target area which needs our key monitoring and protection, and provide the basic information when the reasonable protection plan of groundwater resources is designed. In this sense, these results serve as an effective management tool of groundwater resources. Based on different hydrogeological conditions, researchers have suggested different approaches to pollution risk assessment,but there has not been a uniform assessment method yet. Currently, the groundwater pollution assessment methods can be primarily divided into three types (National Research Council, 1993;Burkart M R et al. 1999). Different assessment methods depend on different methodologies. The index and overlay method involves overlaying of different hydrogeological parameters to generate a comprehensive index that is indicative of groundwater pollution risk (Majandang J and Sarapirome S, 2013). The most common method is DRASTIC method mainly applied to porous aquifers (Aller L T et al. 1987), and other methods also include GOD (Foster S S D, 1987), SINTACS(Civita M and De Maio M, 1997), AVI(Stempvoort D V et al. 1993). Such methods as COP (Zwahlen F, 2004; Vías J M et al. 2003),RISKE (Pételet-Giraud E et al. 2000), REKS Malik P and Svasta J, 1995) and EPIK (Doerfliger N and Zwahlen F, 1998) are all applied to karst aquifers. The process simulation method mainly simulates groundwater flow and pollutant migration process to forecast pollution risk (Kumar P et al. 2015). The statistical method performs the mathematical statistics method of the existing groundwater pollution information and materials and determines the spatial variables of pollution risk within the similar hydrogeological parameter area. However, the defects of these methods are that the results of pollution risk assessment cannot reflect the dynamic nature of groundwater pollution risk.
Therefore, this study uses the dynamic assessment method, a more common method that can reflect the dynamic nature of groundwater pollution risk, and applies this method to one groundwater source area in which is polluted by industrial activities in northern China.
1 Dynamic assessment method of groundwater pollution risk
1.1 Conceptual model of dynamic assessment method of groundwater pollution risk
The “source-pathway-receptor” model is an assessment method proposed by European Union based on the groundwater pollution process. In other words, it is a physically-based model. This theory has been put into global use. “Source” is defined as “damage given that a trigger or failure event has in fact occurred” (Kaplan S, 1981;Enzenhoefer R, 2015). “Pathway” means the pollutant migration and transformation process in the groundwater systems. “Receptor” means “the target affected by the pollution”. In this study,“receptor” specifically refers to the groundwater source, i.e. pumping wells or a single well. The groundwater pollution process is changeable. The industrial, agricultural and domestic pollutions,which are the groundwater pollution source,demonstrate the dynamic changes due to the influences of different factors. Because of the dilution, degradation and migration of pollutants in groundwater system and the influence of pumping process on groundwater flow field, the pollution risk shows the dynamic features. The dynamic assessment method of groundwater pollution risk can give a quantitative description of this dynamic change. Thus, we need to quantify the assessment of three factors including pollution source, pathway and receptor (water-supply pump wells or groundwater resources). So we create the conceptual model of dynamic assessment method of groundwater pollution risk. This model mainly consists of three modules (Fig. 1).
1.2 Classification of groundwater pollution risk grade
The groundwater pollution risk is the function of time and space. Therefore, the groundwater pollution risk changes along with time and space.To some degree, the dynamic nature of groundwater pollution risk is achieved by the significant time and spatial changes of pollutant concentration. In this study, the dynamic assessment results of pollution risk can be quantified through the diffusion scope and concentration of pollutants, and simulated through numerical model. The pollution risk can be measured according to the limit of pollutant as defined in the Standards for Drinking Water Quality in China (GB5749-2006). In this study, we define the capture zone of well as the environment-sensitive area, and classify the dynamic pollution risk into five grades based on the diffusion scope of pollution source and concentration of pollutants (Table 1).
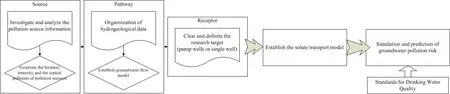
Fig. 1 Conceptual model of dynamic assessment method of groundwater pollution risk
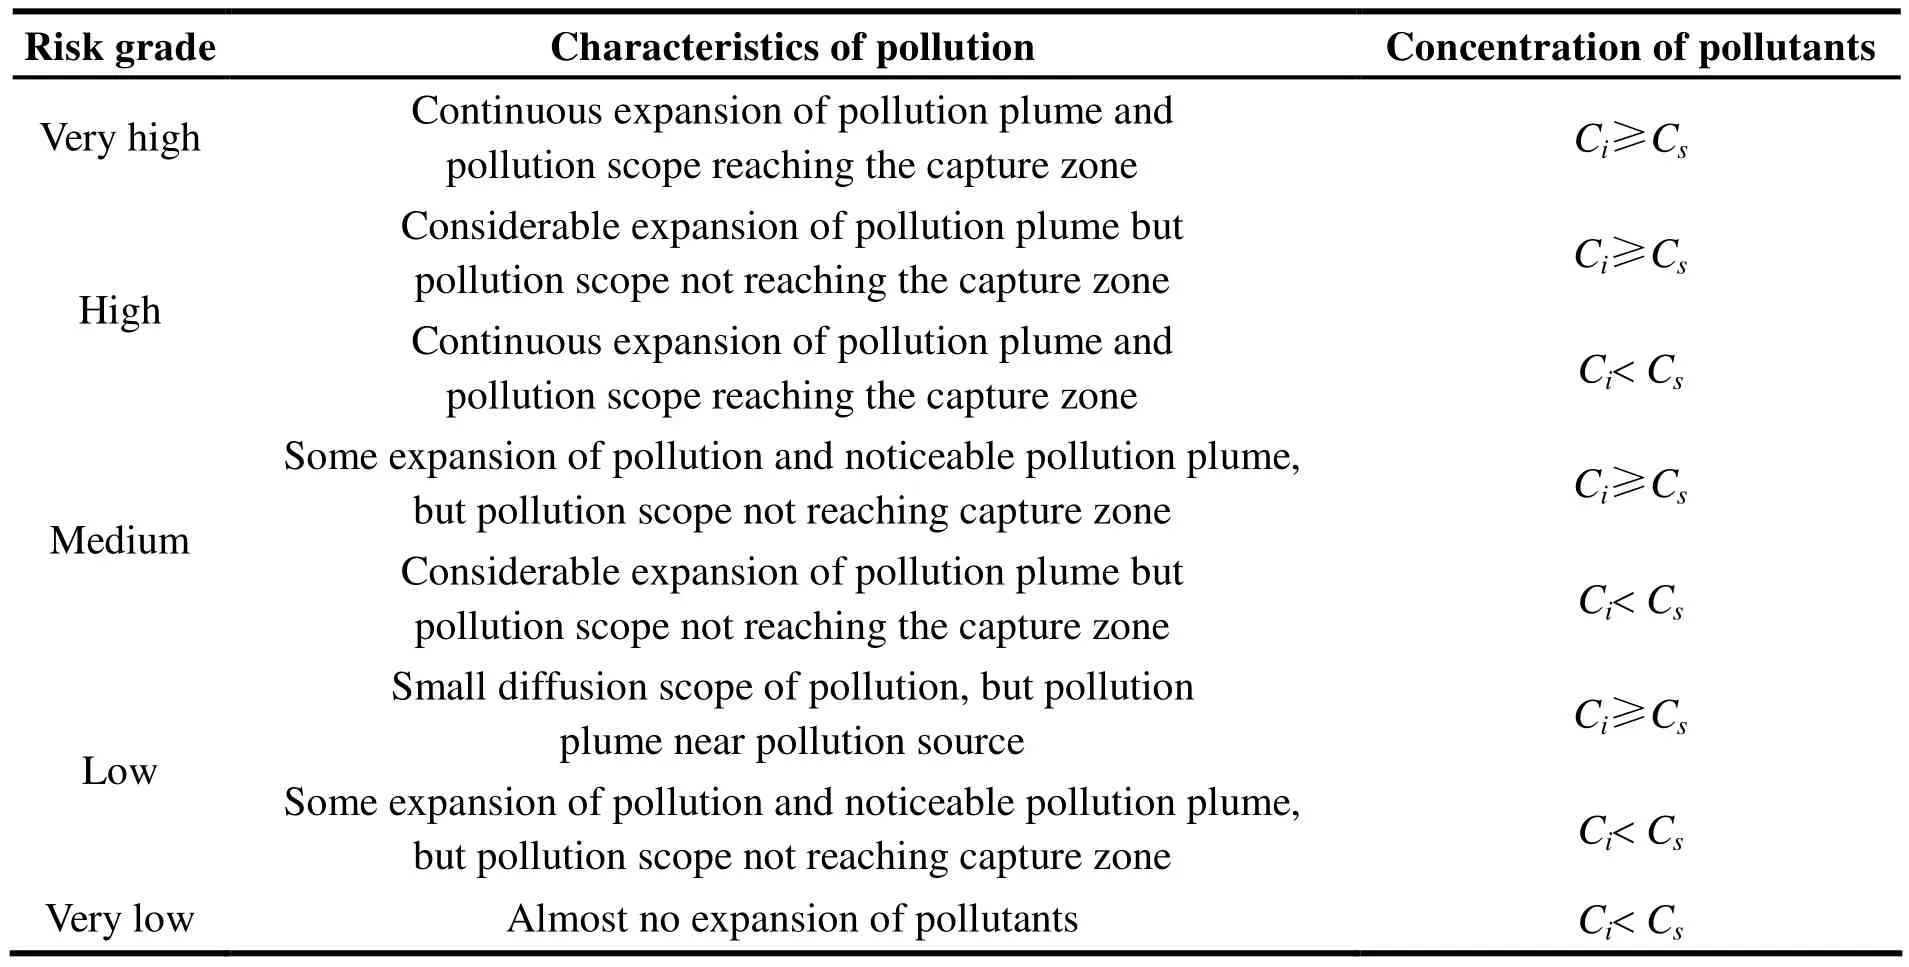
Table 1 Classification of pollution risk grade of groundwater source area
2 Overview of the study area
The study area, which is located in the northeast of a city in the north of China, is the typical fissure karst groundwater source area with the total area of about 150 km2(Fig. 2). With temperate continental monsoon climate, the study area has an average temperature of 12.2 ℃ and an average precipitation of 623.0 mm, which mainly happens in summer, and an average evaporation of 1 792.5 mm each year. The water system in the study zone includes River W and River Z, which are both located within the eastern part of groundwater source area. However, these rivers have dried up due to the declining groundwater level. For River Z, the river bed is primarily made of sand gravels with strong permeability, so the diffusion and migration of pollutants can become quite easy. The groundwater source has a general terrain which is high in the south but low in the north. The low hills and river valleys are found in the south, but the piedmont clinoplain is found in the north. As a result, groundwater flows from the south to the north. Inside the groundwater source area are two water-bearing formations. In the upper part is the porous water-bearing rock formation in the Quaternary loose rocks, and in the lower part is the karst-fissure water-bearing rock formation in the Ordovician middle carbonate rocks. There are three water-rich zones within the study area, where the main forms of groundwater recharge are atmospheric precipitation, lateral recharge and surface runoff, and the main forms of discharge include manual exploitation (including water for industrial production, domestic use and agricultural irrigation). There are the fracture structures of different sizes within the study area.Since the study area is the groundwater source area,we can find lots of exploitation wells, and groundwater is utilized in large quantities for industrial, agricultural and everyday purposes, and especially drinking water. The industrial development has exerted a huge pressure on local environment. Within the study zone, Q Petrochemical Company poses a tremendous challenge for groundwater environment. The land use methods like the discharge of industrial wastewater, agricultural activities and urban sewage have exacerbated the groundwater pollution. What’s more, the irrational design and layout of sewage pipeline enables the direct access of pollutants to groundwater system. The related researches indicate that the organic pollutants within the study zone and petroleum pollutant even have the detection rate of as much as 100%.
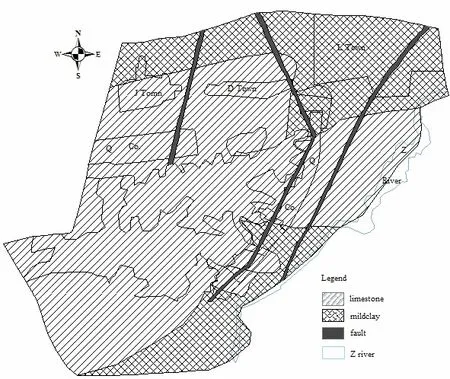
Fig. 2 Location of the study area
3 Construction of hydrogeological concept model of the study area
3.1 Generalization of aquifer and boundary condition
3.1.1 Generalization of aquifer structure
According to the hydrogeological condition of study area, the groundwater system consists of multiple aquifers and aquitards. Vertically, we can generalize the groundwater system of this study area into six layers. The first layer is a discontinuous aquitard layer with the thickness of 6-96 m, whose lithology can be defined as clay,mild clay and sand gravels. This layer is the shallow aquifer without human exploitation on most occasions. The third, fourth and fifth layers are aquifers with limestone, whose total thickness is 50-150 m and the maximum thickness can be more than 300 m. These three layers are the main exploitation layer of the study area. So the groundwater system inside study area can be generalized as the multiple aquifers of 3D non-steady groundwater flow in the loose media.
3.1.2 Generalization of boundary condition
The boundary of the study area is mainly composed of different faults. The northern part,which is Road X, can be defined as the northern boundary of the model. It is the zero-flux boundary.The southern part, which is Fault B, can be defined as the southern boundary of the model. The eastern boundary is River Z’s river bed. The western boundary is the Fault J. They are all the flux boundary. The upper boundary of the model is the aquifer’s phreatic surface. Through this boundary,the groundwater system can have the vertical exchange of groundwater quantity with external sources. The lower boundary of the model is the zero-flux boundary.
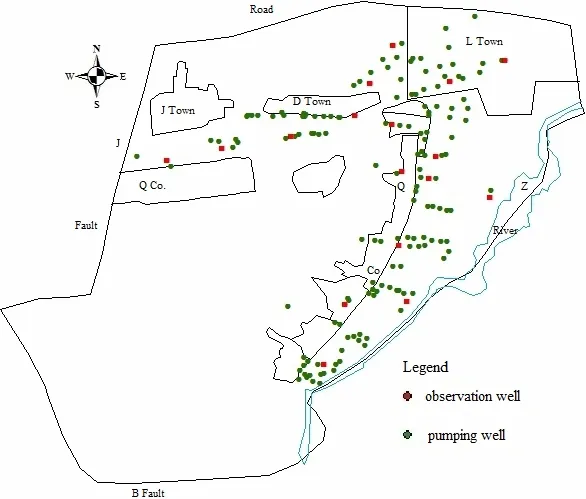
Fig. 3 Boundary and exploitation wells of study area
3.2 Mathematical model of groundwater flow and pollution solute transport
3.2.1 Mathematical model of groundwater flow
The study area is an independent hydrogeological unit. Given different geomorphological features, lithology and compositions, aquifers in different areas differ in permeability, so aquifers are heterogeneous. This heterogeneity can be expressed by the parameters of different aquifers.Based on an analysis of aquifer permeability of study area and the hydraulic connection with external sources, the groundwater flow enjoys the continuous distribution, which is consistent with Darcy’s law. Because there are many exploitation wells inside the study area, the groundwater level is subject to substantial influences. The aquifer within study zone has the spatial heterogeneity.Hence, the model parameter is finalized by adjusting and verifying parameters.
After the aquifer’s characteristics, boundary conditions, and dynamic groundwater flow are taken into consideration, and the groundwater flow within study zone can be generalized into 3D,heterogeneous, anisotropic and non-steady groundwater flow system. The following formula is used:

where, µsis the storativity (1/m); h is water table(m); Kx, Ky, Kzare permeability of the aquifer along the direction x, y and z respectively (m/d); t is time (d); W is the sources and sinks term (1/d);h0(x ,y, z) is the initial water table; Ω is the simulated area of model; τ1is the type I boundary;h(x, y, z, t) is the known water table function on the type I boundary; τ2is the type II boundary; k is 3D permeability tensor;is the direction of exterior normal of the boundary τ2and τ3; q(x, y, z, t) is the function of known flow on the type II boundary; α is the known function; τ3is the type III boundary;q(x, y, z) is the function of known flow on the type III boundary.
3.2.2 Mathematical model of solute transport
The previous investigation of pollution source reveals that the primary pollution source of groundwater source area is Q Petrochemical Company and its peripheral area. It can be generalized into point source, line source and diffused pollution. The findings show that different organic matters, like petroleum, trichloromethane and tetrachloromethane can be found in soil and groundwater. Specifically, the detection rate of petroleum pollutants is 100%. According to the toxicity, migration and degradability of pollutants,the petroleum pollutants can be used the typical pollutants of this study. The model of solute transport uses MT3DMS transport model of Visual MODFLOW. The following formula is used:
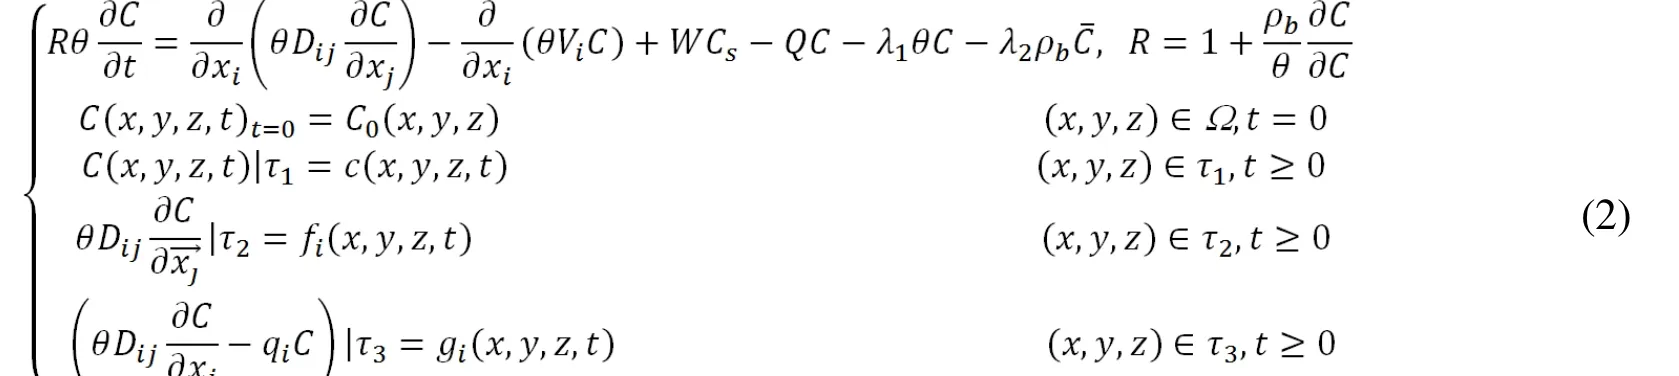
where: R is hysteresis coefficient, non-dimensional;ρbis the medium density (kg/(dm)3); θ is the medium porosity, non-dimensional; C is the concentration of component (g/L);is he component concentration of solid absorbent (g/kg);t is time (d); Dijis hydrodynamic dispersion coefficient tensor (m2/d); Viis groundwater diffusion speed tensor (m/d); W is source and sink of groundwater flow (1/d); Csis the component concentration of source and sink (g/L); Q is the variation rate of groundwater reserve (1/d); λ1is the primary response rate of solution phase (1/d);λ2is the primary response rate of absorbing phase(1/d); C0(x, y, z) is the initial concentration distribution; Ω is the simulated area of model; τ1is the given concentration boundary; c(x, y, z, t) is the concentration distribution on the given concentration boundary; τ2is flux boundary; fi(x, y, z, t) is the known dispersion flux function on the boundary τ2;τ3is the mixed boundary; gi(x, y, z, t) is the total flux function of convection-dispersion on τ3.
The absorption function of soil particles is the most important reaction that can affect the concentration of petroleum pollutants. The absorption model in this study zone is Langmuir isotherm adsorption model. The formula goes as follows:
3.2.3 Check and validation of model
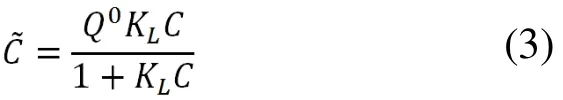
In this study, the study zone is classified into 150 rows and 180 columns, thus generating 27 000 grids, which includes 15 909 valid grids. The size of each grid is 100 m×100 m. Based on flow model, the observation groundwater head is fitted from August 1996 to December 2004 at all the observation wells. Finally, we can get the fitting curve between simulated groundwater head and actual groundwater level at all the observation wells (as indicated in Fig. 4). The green cube and the red cube represent the actual value and the simulated water head value at all the observation wells. According to Fig. 4, the changes to simulated water head at observation wells are roughly the same as the trend of actual water head.This reveals something about the characteristics of groundwater flow field to simulate and forecast the pollution risk.
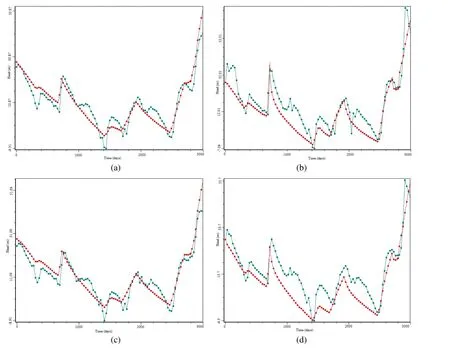
Fig. 4 Fitting diagram of water head at typical observation wells within the study zone(a-d stand for four different observation wells)
4 Model simulation and pollution risk prediction
Having considered the available research materials, the previous investigations of pollution source, the water flow simulation and the pollution solute transport simulation, we have conducted an analysis and assessment of the migration and transformation scope of petroleum pollutants and the pollution risks concerned within the next ten,twenty and thirty years according to the statistics of groundwater exploitation from 1996 to 2004 when the discharge components and quantity of main pollution sources remain constant (2007).
According to the Standards for Drinking Water Quality in China (GB5749-2006), it is imperative to refer to indeed and threshold value when it comes to drinking water. The contents of petroleum pollutants in all kinds of groundwater source area (total contents) shall not exceed 0.3 mg/L. In this study, the threshold value shall be used as the benchmark value for judging the petroleum pollution risks of the study area. Based on the dynamic risk assessment and grading standard of groundwater, the pollution risk of groundwater source area can be defined as Very High if the concentration of petroleum pollutants in the aquifer of the study area (Ci) is more than 0.3 mg/L, and the pollution risk of groundwater source area can be defined as High if the concentration of petroleum pollutants falls within the scope of 0.05<Ci<0.3 mg/L.
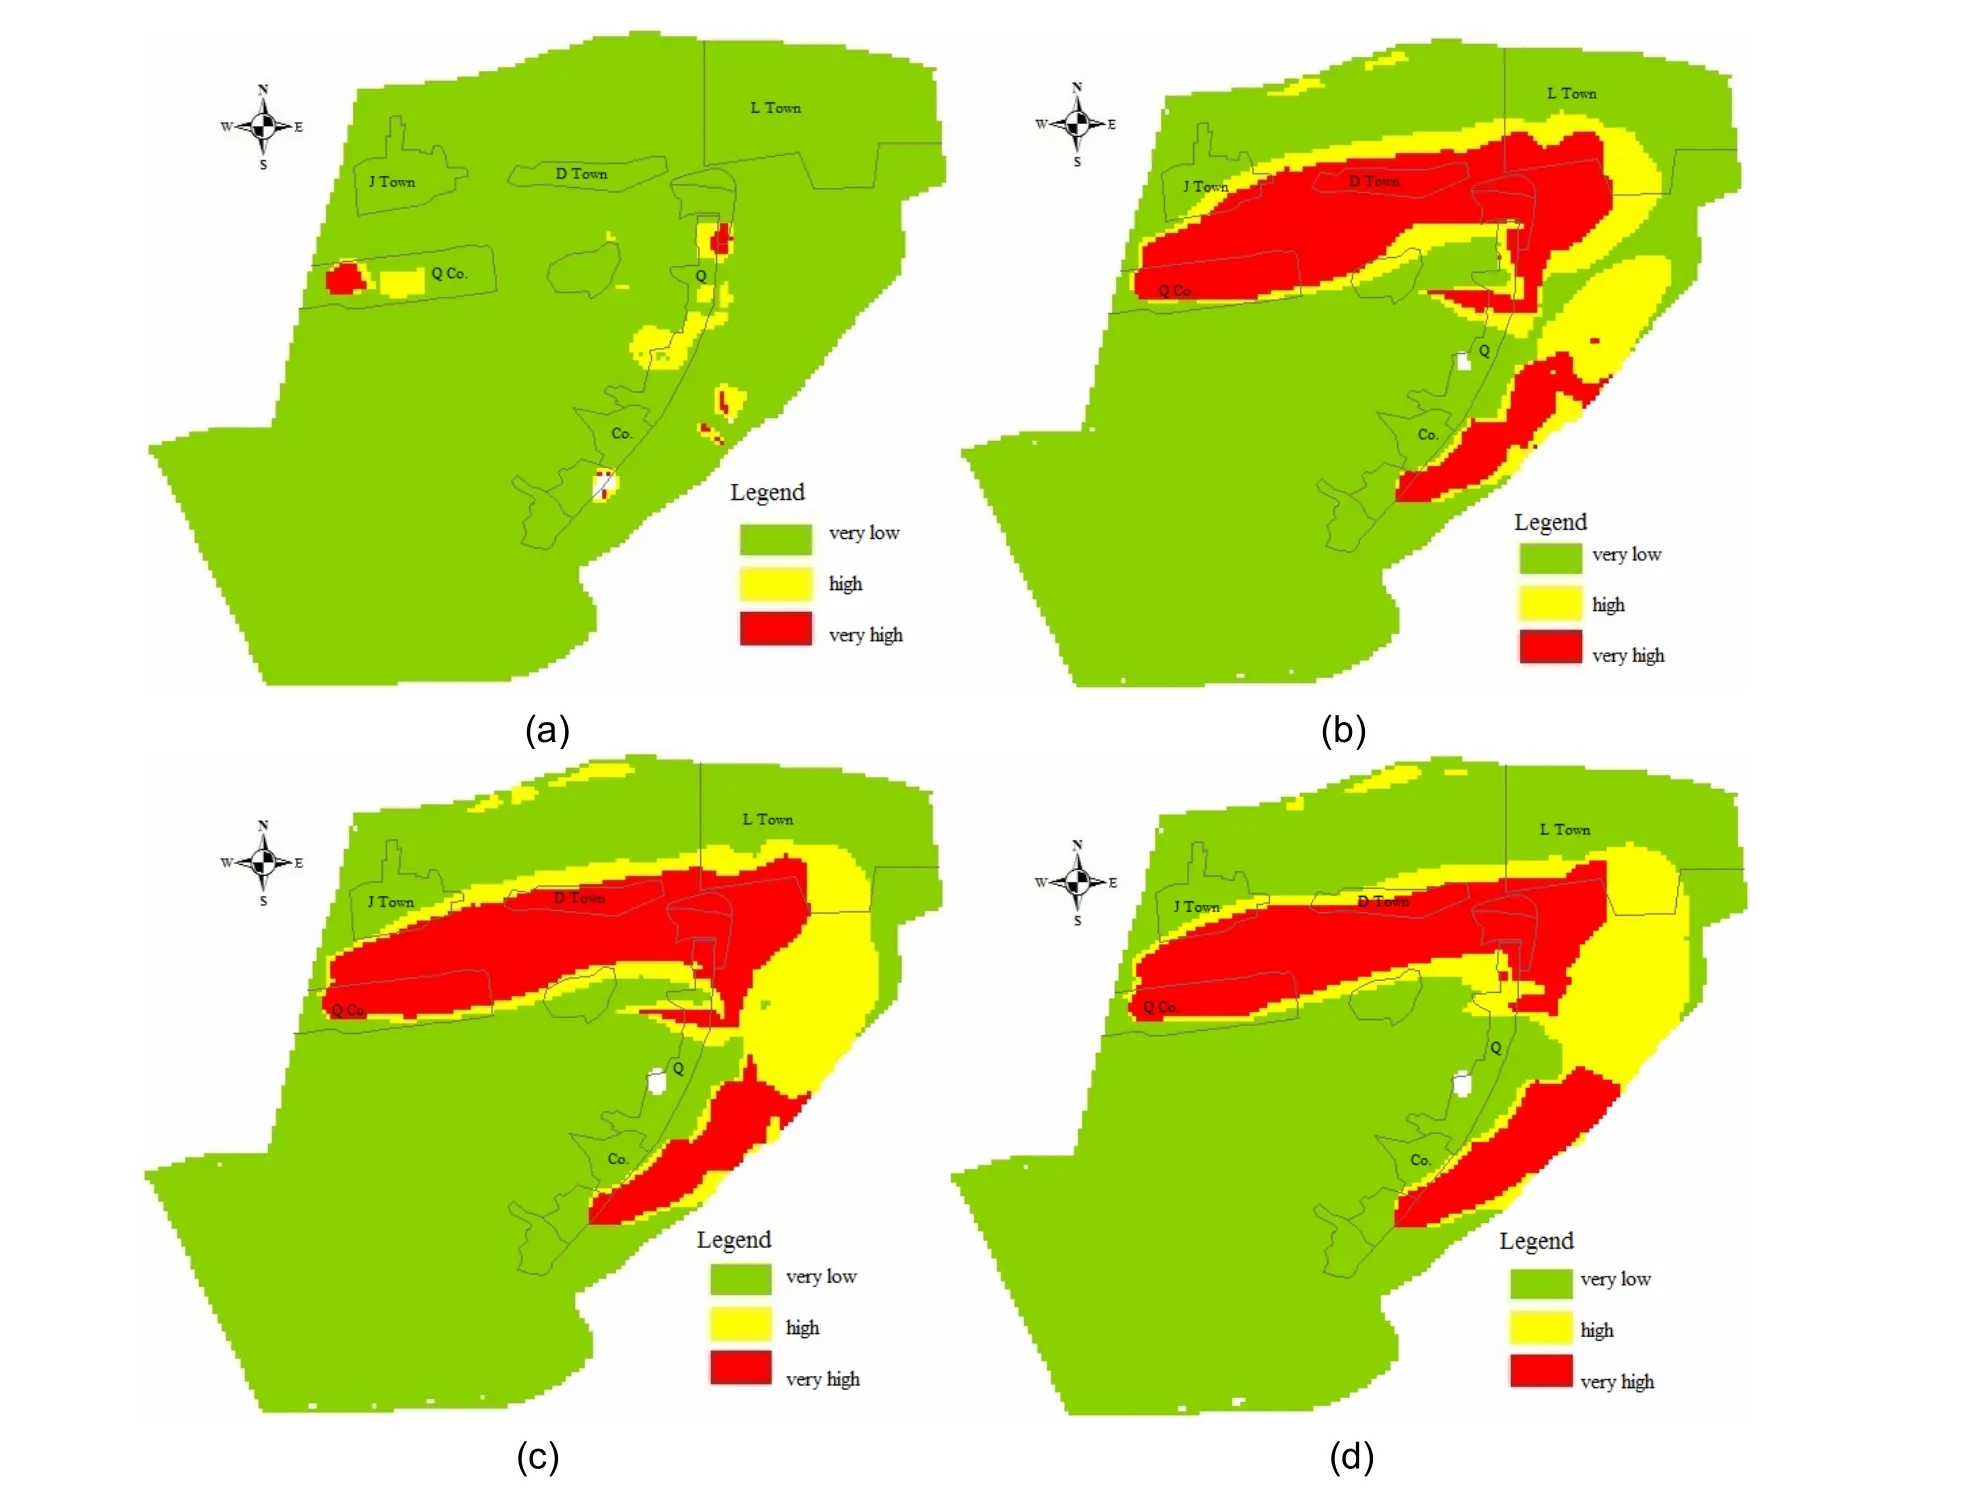
Fig. 5 Planes of pollution risks in study zone during different periods (a) 30 days;(b) 10 years; (c) 20 years; (d) 30 years
Because some petroleum pollutants were found in the previous investigations, some oil pollutions were mainly found in the aquifer near Q and Z during the first thirty days (Fig. 5a). As indicated in Fig. 5b-5d, the pollution plume of oil pollutants in groundwater assumes a narrow and long ellipse.The long axis is on the same direction as groundwater flow. As the pollution plume diffuse in the northeast, the central concentration of pollution also migrates. As the groundwater exploitation increases, the scope and migration distance of pollution will expand as well (TONG Xiao-xia et al. 2012). As exploitation is bigger than recharge within the study area, the groundwater depression is generated along HG. Meanwhile, because HG is the worst polluted area during the initial investigation of pollution source, the oil pollutants do not tend to degrade. As a result, this area is still the heavily polluted area in thirty years (Fig. 5d).Since groundwater depression mainly happens in dry season, the oil pollutants will diffuse within this area. After the migration and transformation of oil pollutants in groundwater for thirty years, the heavily polluted area has gradually come close to Town D. The migration of pollution centre along with pollution plume contributes to the difference in the influence area of pollution risk and the pollution hazards. So the pollution risk will have dynamic changes in different time and space.When it comes to the changes in pollution plume of comprehensive aquifer, very high pollution risk areas, under the influence of groundwater flow field, migrate in the northeast along the direction of groundwater flow, and this is also true of the high pollution risk areas. In the study zone, the very high pollution risk areas are mainly located around Q Petrochemical Company and River Z.
The area ratio of very high or high pollution risk zones to the total study area is easy to identify the scope and degree of pollution (Fig. 6). In the groundwater source area, the ratio of very high risk zone to the total area will be 18.1%, 17.47% and 16.62% during the tenth year, the twentieth year and the thirtieth year separately, and will reach the highest level of 19.45% during the fifteenth year.As time goes by, the area of very high pollution risk zone in groundwater source area climbs up and then declines. During the early phase of 0-5 years, the expansion scope of pollution plume will increase significantly. In the next period of 5-15 years, the expansion scope of pollution plume will increase slowly. In the last period of 15-30 years,the expansion will decrease gradually. As time passes, the oil pollutants in groundwater source area have seen their scope expanding due to the accumulation of pollutants. Yet, along with the dilution, degradation and migration of pollutants,the groundwater pollution risk gradually declines.But at the same time, the area of high pollution risk zone in groundwater source area gradually increases. This implies that the passage of time and considerable exploitation will disturb the groundwater flow field and the pollutants will gradually get degraded and diluted in groundwater system.
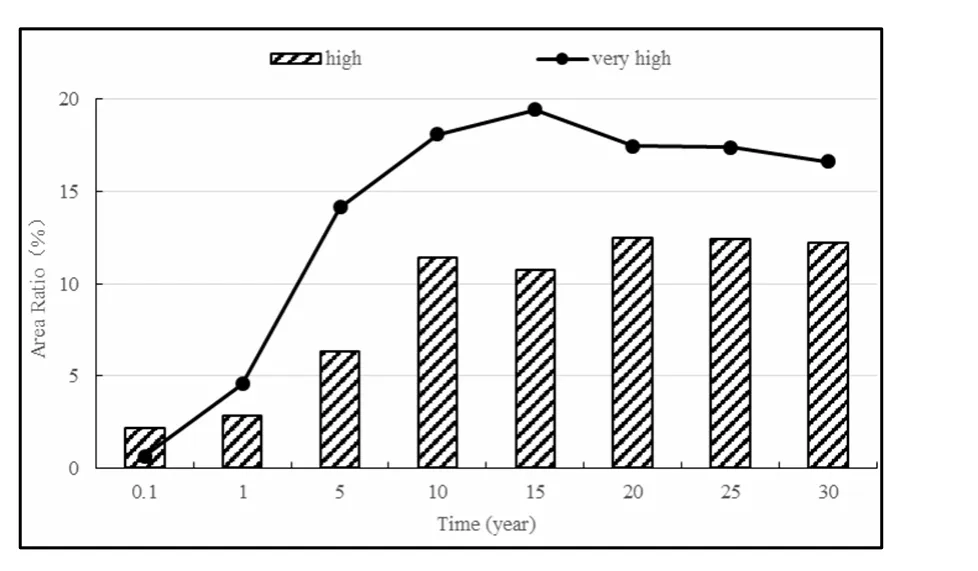
Fig. 6 Ratio of very high or high pollution risk zones in study zone during different periods
Because most of the initial pollutants come from the disclosure of pollutants or the sinking of polluted wastewater in the production process, the first victim to pollution is the topsoil. The groundwater flow field cannot just cause the horizontal migration of polluted matters, but make their vertical movement possible (CONG Ai-seng,1997). The oil pollutants gradually migrate downward the topsoil, and some pollutants of this kind can migrate downward to the groundwater aquifer. There is the risk that pollutants may gain a direct access to water supply wells of groundwater,so the pollution risk of groundwater source area increases. Like the horizontal migration of pollutants, the vertical migration of pollutants will increase and then decrease as time goes by. The vertical migration distance of pollutants will experience a rise and then a fall as time goes by.It’s quite similar to YU’s research findings (YU Jia et al. 2014). Within the period of 10-30 years, the vertical migration distance of pollution plume shows the smearing phenomenon (Fig. 7b-7d).This is because different fracture structures and permeability coefficients of groundwater in this zone result in different vertical migration distances of pollutants, thus implying that fracture structures have imposed an important influence on the migration of pollutants in groundwater.
The concentration classification of oil pollutants in groundwater samples (2012) can be used to validate the pollution risk assessment results of groundwater source area. As Fig. 8 shows, the scope and concentration classification of oil pollutants is the same as the forecast result of pollution. The worst pollution zone is HG, whose distribution law is roughly consistent with the forecast result. It means that this method is reliable.
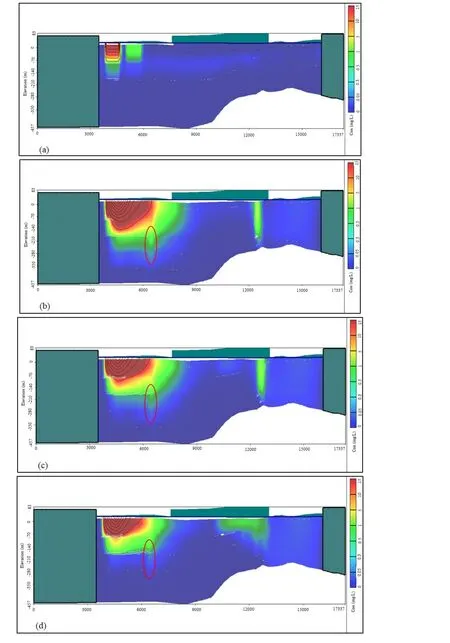
Fig. 7 Profiles of the vertical migration distance of concentration in pollutant centre of the study area during different periods (a) 30 days; (b) 10 years; (c) 20 years; (d) 30 years

Fig. 8 Concentration classification of oil pollutants in groundwater source area (2012)
5 Conclusions
There are many pollution risk assessment methods of groundwater, but these assessments are all focused on the status quo and the assessment results can’t reflect the characteristics of dynamic pollution risks. Based on the theory of“source-pathway- receptor”, this study creates the dynamic assessment method of pollution risk of groundwater source area and applies this method to one groundwater sources area in northern China for the purpose of validation. This groundwater source area has the oil pollution to some degree.The very high risk zone is mainly located in Q Petrochemical Company and the surrounding area and the area adjacent to River Z. Because of the influences from physical and chemical changes of pollutants and groundwater flow field, the pollution plume of oil pollutants in groundwater assumes a narrow and long ellipse. The long axis is on the same direction as groundwater flow.Specifically, it diffuses in the northeast along the direction of groundwater flow, and the central concentration of pollution will migrate as well.The ratio of very high risk zone to the total area will be 18.1%, 19.45%, 17.47% and 16.62%during the tenth year, the fifteenth year, the twentieth year and the thirtieth year separately.The change features an inverted “V” shape.Meanwhile, the area of high pollution risk zone in groundwater source area gradually increases. This implies that the passage of time and considerable exploitation will disturb the groundwater flow field and the pollutants will gradually get degraded and diluted in groundwater system. Like the horizontal migration of pollutants, the vertical migration distance of pollutants will also increase and then decrease. In other words, the pollution risk is dynamic. This assessment result can give a vivid account of dynamic risk changes. The smearing phenomenon of vertical migration distance shows that fracture structure will contribute to the migration and diffusion of pollution.
Acknowledgements
Foundation project: the Specific Research on Public Service of Environmental Protection in China (201009009).
杂志排行
地下水科学与工程(英文版)的其它文章
- Dynamics of fluid and heat flow in a CO2-based injection-production geothermal system
- Numerical simulation of groundwater and early warnings from the simulated dynamic evolution trend in the plain area of Shenyang, Liaoning Province (P.R. China)
- Applications of hydrogeophysics in characterization of subsurface architecture and contaminant plumes
- Simulation of groundwater level recovery in abandoned mines, Fengfeng coalfield, China
- Interactions between benzotriazole and corncob biochars pyrolyzed at different temperature
- Study on engineering-hydrogeological problems of hydroelectric project