Applications of hydrogeophysics in characterization of subsurface architecture and contaminant plumes
2016-11-25DENGYapingSHIXiaoqingWUJichun
DENG Ya-ping, SHI Xiao-qing, WU Ji-chun
Key Laboratory of Surficial Geochemistry of Ministry of Education, School of Earth Sciences and Engineering,Nanjing University, Nanjing 210023, China.
Abstract: Geophysical methods have been applied to a wide range of hydrogeological problems.With improvement in geophysical inversion algorithms and measurement tools, significant achievements have been made in the characterization of subsurface architecture, time-lapse monitoring of hydrogeological process and contaminant plumes delineation. In this paper, we summarize the geophysical methods that are most widely used in hydrogeology including Electrical Resistivity Tomography (ERT), Induced Polarization (IP), Ground Penetrating Radar (GPR) and Electromagnetic Induction (EMI). Three examples including lab and field works are used to demonstrate current application of geophysical methods for characterizing subsurface architecture and contaminant plumes. Though great progress has been made in hydrogeohysics over the last few decades at home and abroad, challenges still remain in practical applications. More recently, hydrogeophysics continues to develop in the areas of establishment of hydrogeophysical models, large-scale architecture characterization,uncertainty analysis, biogeochemical process monitoring and ecosystem science.
Keywords: Geophysical methods; Hydrogeophysics; Groundwater; Hydrogeological properties
Introduction
Over the past decades, growing attention has been focused on the characterization and remediation of sites contaminated by hazardous chemicals which pose a long-term threat to the groundwater quality and human health. It is therefore necessary to conduct detailed hydrogeological studies associated with subsurface environmental problems.Geophysical techniques, such as electrical resistivity tomography (ERT), ground-penetrating radar(GPR), induced polarization (IP), can play an important role in this domain. These methods have been widely applied in characterizing and monitoring hydrogeological architecture and transport of contaminants in shallow subsurface(see reviews in Revil A et al. 2012; Binley A, 2015;Binley A et al. 2015), which gave birth to“hydrogeophysics”. Hydrogeophysics is defined as a research field that uses the geophysical methods to characterize subsurface features, estimate hydrological parameters and monitor dynamical processes (Rubin Y and Hubbard S S, 2006).
Conventional approaches for hydrogeological investigations, like pumping tests, slug tests, core sampling, have mainly been dependent on a sparse network of intrusive drilling cores (Stienstra P and Van Deen J K, 1994; Jim Yeh T C et al. 1995;Sánchez-Vila X et al. 1999). Although these methods do provide detailed information about the subsurface, data obtained through such methods are limited by several discrete vertical profiles,which are not sufficient for characterizing geological heterogeneity. Generally, these measurements are time-consuming and costly. Furthermore, in some cases, such invasive methods are restricted due to the obstruction of buildings or roads and environmental protection constraints (Binley A et al. 2015). Recently, geophysical methods have been increasingly applied in hydrogeology because they can provide non-intrusive and continuous profiles at an acceptably high resolution (Hubbard S, 2011). Significant improvements have been made in data acquisition tools, inversion approaches, hydrogeophysical relationships that link hydrological properties and geophysical parameters, coupled and uncoupled hydrological as well as geophysical modeling and thus the characterization of subsurface properties and processes (Slater L, 2007; Revil A et al. 2012;Knight R et al. 2013; Singha K et al. 2015).
The geophysical techniques used for hydrogeological investigations include ERT (e.g., CHEN Ye-xun et al. 2004; Naudet V et al. 2004), IP (e.g.,Cassiani G et al. 2009), ground penetrating GPR(e.g., Huisman J A et al. 2003; GUO Gao-xuan and WU Ji-chun, 2005), electromagnetic induction(EMI) (e.g., Mohamed A K et al. 2002), selfpotential (SP), seismic and so on. Among these methods, ERT, IP, GPR and EMI are probably the most widely used geophysical techniques in hydrogeophysics. ERT and IP methods are assumed to originate from petroleum and mining explorations in the early twentieth century. During the late 1970s, development of instruments and inversion methods accelerated application of electrical methods in a wide range of fields (Binley A, 2015). Over years, significant improvement has been made in resistivity and IP methods where both three-dimensional and four-dimensional surveys are available in areas with complex hydrogeological conditions. The use of GPR methods for groundwater started from the work of El-said M A H (1956). There have been revolutionary advancements of GPR since the 1970s. As the instruments evolve and designs get better, the amplitude of GPR data is becoming more stable and reliable (Annan A P, 2002). In recent years,application of GPR in hydrogeological investigations has increased due to a better understanding of correlations between GPR responses and water content (Annan A P, 2005). EMI method for subsurface investigations started in the 1950s and 1960s. Because of development of instruments,EMI was applied to groundwater prospecting later and has experienced a rapid growth in use for environmental problems in the recent two decades(Everett M E and Meju M A, 2005).
The application of geophysical methods in hydrogeology started late in China compared to developed countries, but there have been numerous successful cases in natural resources exploration,protection and management. For contamination problems, CHENG Ye-xun et al. (2004), used ERT,GPR and TEM (transient electromagnetic method)to detect the diffusion range of landfill leachate.YAN Y Y et al. (2007) successfully delineated the status of groundwater pollution on Asuwei refuse sanitary landfill through magnetotelluric method.Despite landfill leachate, an alternative realm of studies associated with contamination problems is oil contamination. ZHOU Xun (2007) evaluated the efficiency of GPR for detecting the leakage of underground oil storage tank in south Jiangsu province. CHEN Fu-xin et al. (2016) used timedomain reflectometry (TDR) to study the relationship between the contents of non-aqueous phase liquids (NAPLs), dielectric properties and electrical conductivity of soil. PAN Y et al. (2015) and GUO Xiu-jun et al. (2005) studied the resistivity characteristics of oil contaminated soil through ERT method. Geophysical methods have also been utilized ingroundwater resource exploration. WAN Le and PAN Yu-ling (1999) illustrated availability of nuclear magnetic resonance (NMR) method for detecting karst water. JI Yan-jun et al. (2005)conducted groundwater prospecting through TEM in Neimeng. A large number of studies described use of geophysical methods in the exploration of seawater intrusion (SU Yong-jun et al. 2014),delineation of aquifer architecture (SUN Yin-hang and GAI Li-ya, 2014), and estimation of hydrogeological parameters (LI Zhen-yu et al. 2003; YU Yong-xiang and WU Ji-chun, 2006). Recently,biogeophysics has emerged as a new sub-discipline of hydrogeophysics focusing on the characterization of biogeochemical process (ZHANG C et al. 2013;ZHANG C et al. 2014).
The primary objective of this paper is to introduce some practical applications of hydrogeophysics. This study focuses more on the geophysical methods which are the most commonly used in hydrogeological investigations. The paper first briefly describes the basic principles of geophysical methods. Then it is followed by some benchand field-scale examples combined with our present work to illustrate the current applications of the geophysical methods. Finally, the paper provides a few views on future development of this growing area of research.
1 Geophysical methods
While there are a number of geophysical methods showing potential in hydrogeology, here we restrict our discussions on the selected four techniques including ERT, IP, GPR and EMI,which are most commonly used in hydrogeological studies. Table 1 displays the geophysical properties and hydrogeological applications of these geophysical methods.
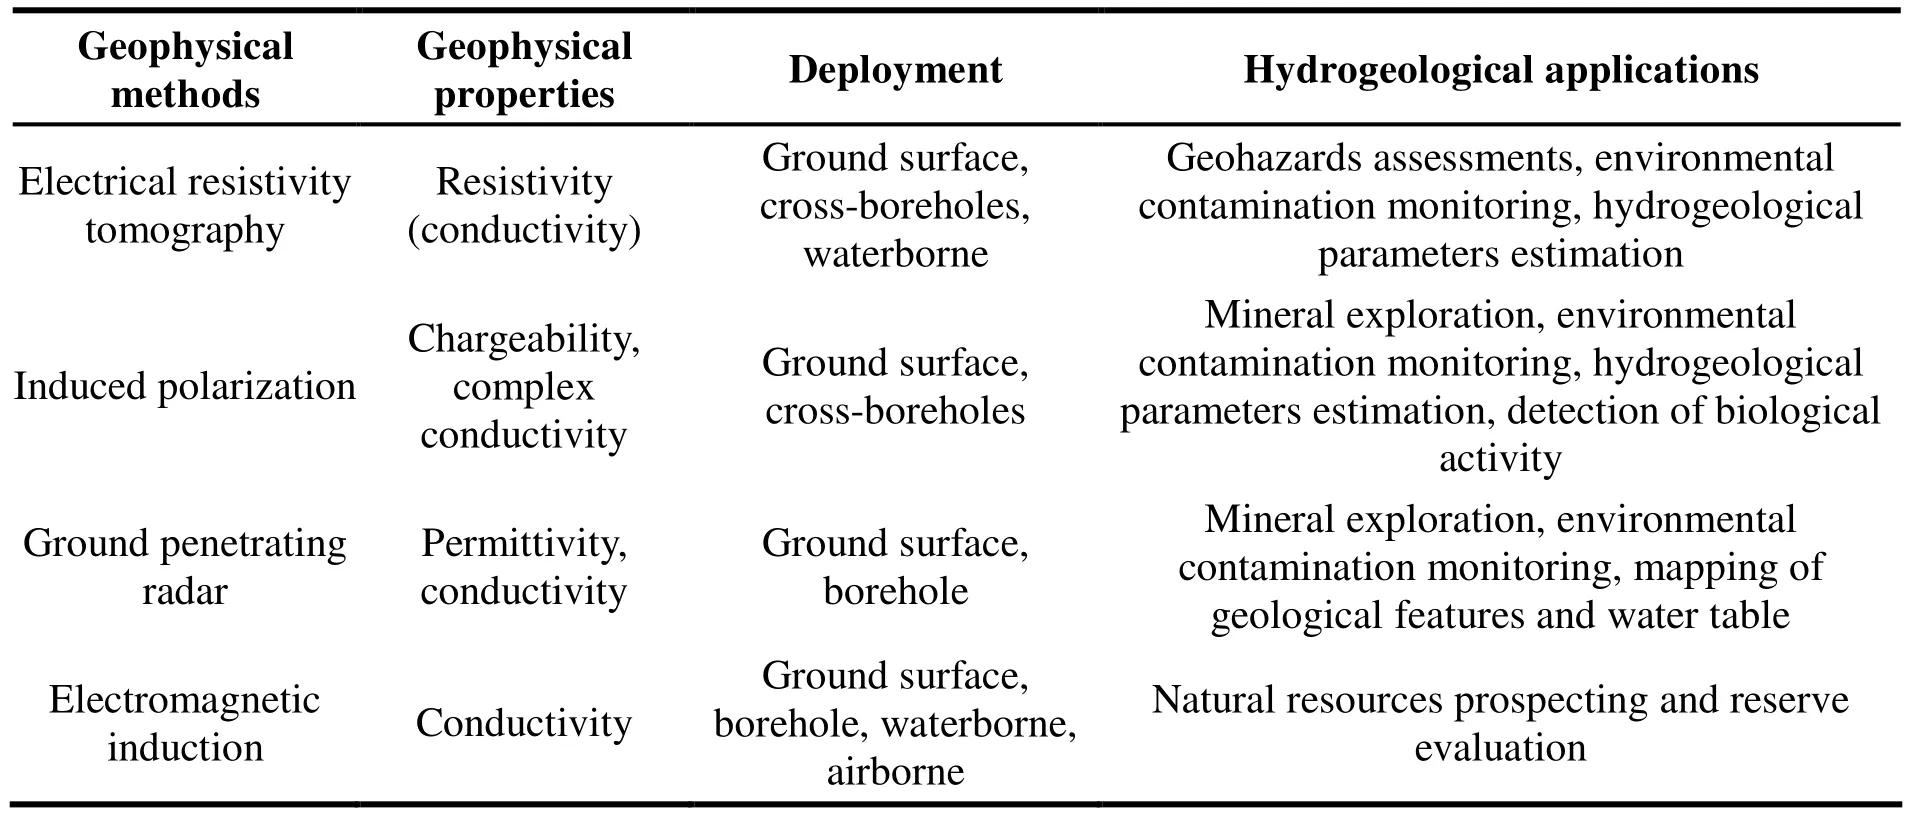
Table 1 List of most commonly used geophysical methods in hydrogeology(modified from Binley A et al. 2015)
1.1 Electrical resistivity tomography
ERT calculates the electrical resistivity of the subsurface by introducing a current into the ground through two current electrodes and measuring the difference of voltage at the other two potential electrodes. A typical multi-electrode system has at least four electrodes connected to the resistivity meter by cables. To obtain a continuous profile of the subsurface, measurements should be made with different spacing at different locations along the cables. Traditional two-dimensional and threedimensional resistivity surveys are based on the surface-based electrode configurations. Recent developed novel configurations include crossboreholes (Slater Let al.2000; Wilkinson P Bet al.2010), surface-tunnel (Power Cet al.2015;Simyrdanis Ket al.2015), surface-borehole (Bevc D and Morrison H F, 1991; Kirkou Set al.2015)and other optimized arrays for specific field problems (Wilkinson P Bet al.2006; Loke M Het al.2014; Loke M Het al.2015).
In order to retrieve the intrinsic distribution of resistivity of ERT measurements, an inverse modeling is usually performed based on the measured data. Before conducting the inverse modeling, a forward modeling is performed, which is done by solving the Poisson equation (Binley A and Kemna A, 2005). Finite-difference and finiteelement methods are commonly used to solve the Poisson equation (Coggon J, 1971; Park S K and Fitterman D V, 1990). Then inverse methods are used to back calculate the resistivity using the potential valuespreviously obtained from the forward modeling. Since inverse modeling of geophysical problems is not inherently unique,i.e.,there are probably a number of different geophysical models that can fit the measured data, it’s necessary to impose additional constraints on inversion(Marquardt D W, 1963; Constable S Cet al.1987).
1.2 Induced polarization
Compared to ERT, IP is able to provide both resistive and capacitive characteristics of subsurface materials. IP measurements can be also conducted by the four-electrode geometry the same way as ERT surveys used, but the former require much higher input current and more stacks of measurements due to relatively low overvoltage(Binley A, 2015). Surveys can be performed in the time domain or in the frequency domain. For the time domain, a current is injected first. Then the transient voltage decay over a period of time is recorded when the current is cut-off. The measured voltage decay is a result of polarization at the fluid-mineral interface as well as the electrical conduction within the pore water and along the grain boundaries. The IP effect is generally represented as partial chargeability.
Frequency domain methods measure phaseshifted voltage relative to an injected current(Binley A and Kemna A, 2005). In frequency domain IP survey, the injected current is harmonic and the corresponding voltage is measured at a sampling frequency which should be high enough to capture the small phase lag between the voltage and the current. Measurements can be made either at a single frequency or over a range of frequencies(referred to as spectral IP, SIP). However, the frequency range is limited in field measurements.Low frequency measurements result in a long data acquisition time and high frequency measurements are suffered fromcoupling effects. In frequency domain measurements, the result is usually described in terms of complex conductivity which consists of phase component (real part) and out-of-phase or quadrature conductivity (imaginary part) (Revil A et al. 2012).
1.3 Ground penetrating radar
GPR is a geophysical method which uses electromagnetic energy at high frequencies (10-1 000 MHz) to map subsurface features (Davis J L and Annan A P, 1989). Commonly used GPR system consists of two antennas. One antenna is used as the transmitter which produces electromagnetic waves downward into the soil, and the other is served as the receiver that measures the reflected signal from the transmitter (Huisman J A et al. 2003). Generally, GPR has an advantage in shallow coarse-grained materials which are transparent to radiowave signals, but it has its limitation in fine-grained soils. GPR signal strength is attenuated quickly in highly conductive environment. The resolution and depth penetration of GPR measurements depend largely on the frequency bandwidth used and the surrounding soil electrical conductivity (Huisman J A et al. 2003).
GPR measurements can be divided into two categories: Reflections (including common-offset reflection and multi-offset reflection) and transillumination methods (Annan A P, 2005). Among these, common-offset reflection method is the most commonly used in GPR surveys. Generally,common-offset surveys involve a single transmitter and receiver, which have a specific polarization character for the field generated and detected. In this mode, GPR antennas can be pulled along a survey line at walking speed. When the electromagnetic waves into the soil reach the interface with different dielectric constants, part of the energy is transmitted deeper into the ground and the other part is reflected and displayed in the form of two-dimensional profiles.
1.4 Electromagnetic induction
EMI uses a transmitter, typically operating with a frequency range from 1-15 kHz, to introduce timeor frequency varying currents into the ground.Measurements can be taken on the ground surface,in boreholes, in a waterborneor airborne manner.EMI has been an effective tool for large-scale hydrological investigations (Cook P G and Kilty S,1992; Kirkegaard C et al. 2011). Compared to GPR and ERT, EMI can provide greater penetration and better resolution. The EMI method performs well in highly conductive environments, areas with high radar reflectivity and electrically resistive zones(Everett M E and Meju M A, 2005). Since the coils of EMI system do not need to contact with ground surface directly, EMI method also performs well with the presence of highly resistive or paved ground while good electrode contact with ground is required for ERT methods.
The EMI data can be collected in profile or sounding model. In frequency domain systems, a high resolution investigation of subsurface at shallow depth is completed with high transmitter frequencies.Lower transmitter frequencies are able to detect deeper but at a loss in resolution. The secondary magnetic field measured in time domain systems is a function of time: early-time measurements provide information about shallow depth while later-time measurements reflect the electrical properties at a deeper depth. The resolution and penetration depth of EMI are determined by the distribution of subsurface conductivity and separation of coils as well as the source configuration.
2 Practical applications
This section presents several cases to illustrate application of geophysical methods in hydrogeo-logical studies. These cases are mainly based on our present wok that are conducted to characterize the subsurface architecture of aquifer, monitor the dense non-aqueous liquids (DNAPLs) infiltration process and map the extension of plumes in a contaminated site.
2.1 Characterization of subsurface architecture
Geophysical methods have been used for different aspects of application in subsurface architecture delineation. For example, in the assessments of geohazards, Jardani A et al. (2007)used both ERT and SP methods and successfully detected the sinkholes in a karstic area. LIU Si-xin et al. (2005) utilized borehole radar to detect the subsurface fractures. Compared to the traditional hydrogeological methods, geophysical methods also have an advantage in geological structure delineation. Davis J L and Annan A P (1989)illustrated application of GPR in soil and rock characterization. Van Overmeeren R A (1998)summarized several examples of characteristic radar signatures for different sedimentary environments in the Netherlands helping identify different types of sedimentary sequences. Geophysical methods have also been used to characterize aquifer geometry. Schütze C et al. (2012) located a potential fault zone through both seismic refraction and electrical resistivity tomography investigations.Hirsch M et al. (2008) delineated a resistive gravel layer overlying mudstone bedrock through multiple geophysical methods.
In order to illustrate the efficiency of geophysical methods for mapping hydrogeological heterogeneity in subsurface, we conducted both GPR and ERT measurements and hydrogeological surveys, including single-well and multi-well pumping tests and dispersion tests, in a field site.The target area is located on the middle and lower reaches of the Yangtze River mainly with sandy aquifer. The regional geology comprises a 20 to 30 m thick layer of quaternary silty clay and fine sand.A loam and sandy loam layer of variable thickness(80-100 m) overlies the aquifer. The aquifer is present at a depth varying between 120 to 200 m.The deployment of geophysical lines and wells can be seen in Fig. 1.
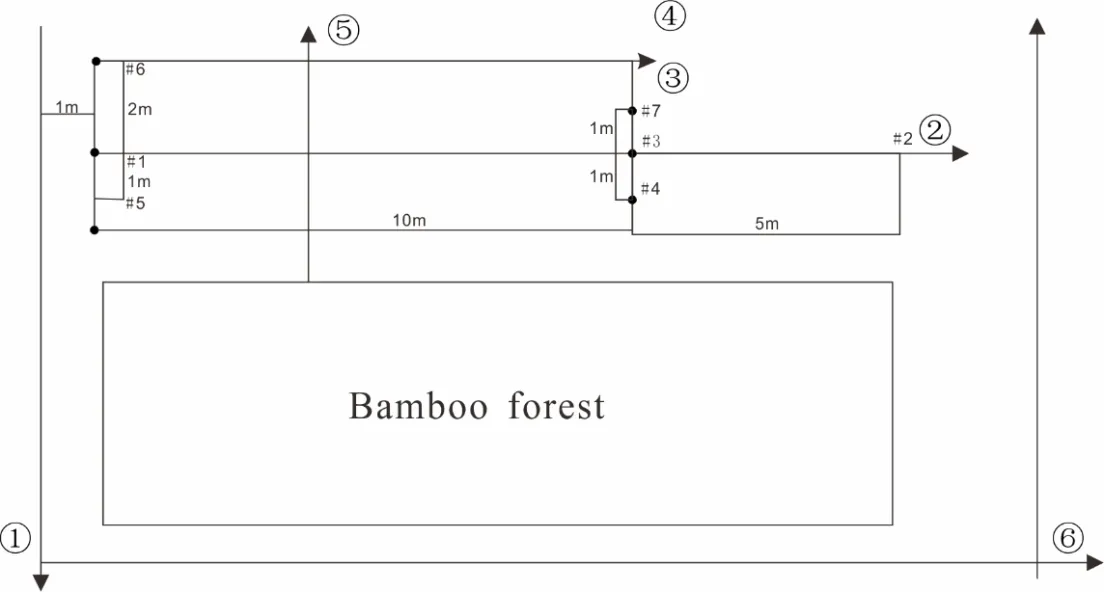
Fig. 1 Deployment of wells and GPR and ERT survey lines. (Note: Arrow stands for the direction of survey lines (Modified from Wu Ji-Chun, 2006)
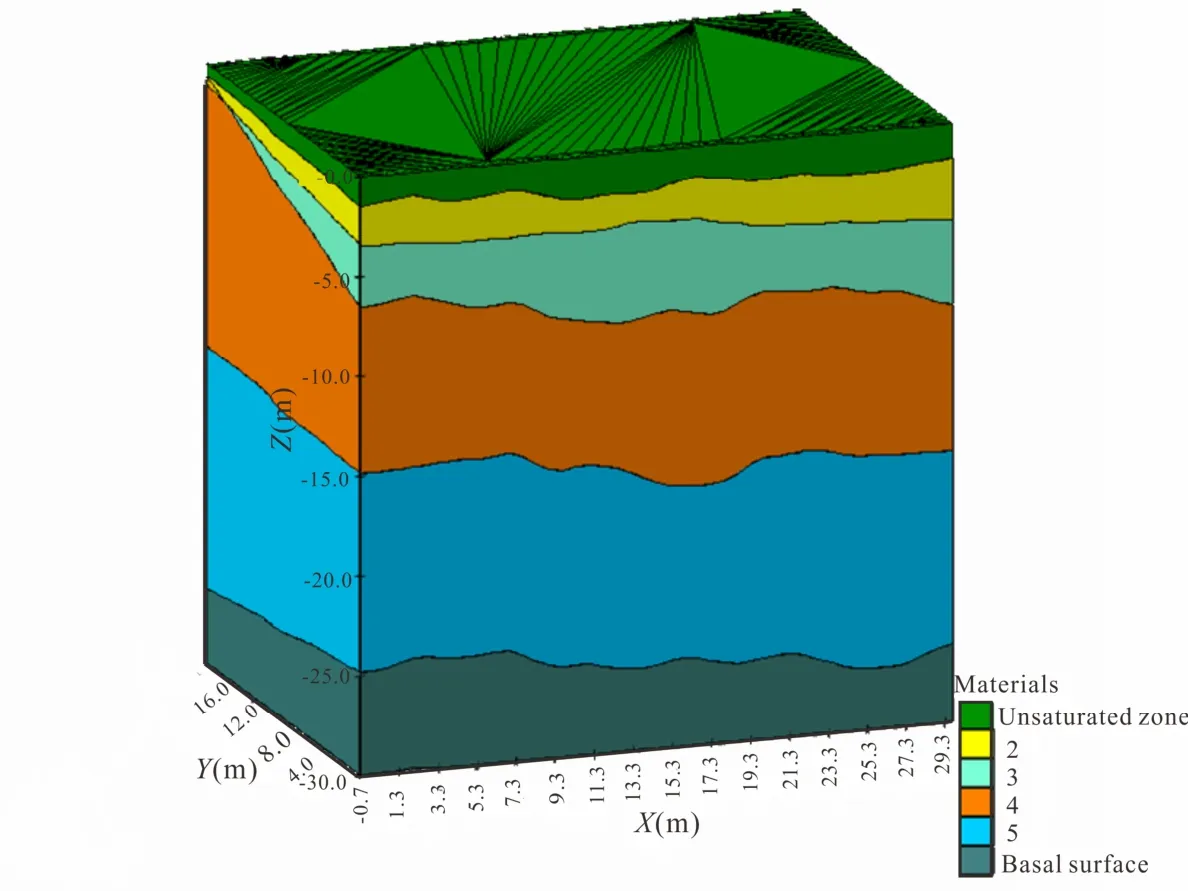
Fig. 2 Three dimensional structure of the study area (Modified from Wu Ji-Chun, 2006)
The results of GPR and ERT detections are compared with the hydrogeological surveys. Fig. 2 shows the three dimensional structure of the subsurface. The data used to construct this structure were collected from the GPR and ERT measurements and geological borehole information.Based on the established hydrogeophysical relationship between hydrogeological properties and geophysical parameters, GUO Gao-xuan and WU Ji-chun (2005) and YU Yong-Xiang and WU Ji-Chun (2006) used GPR and ERT datarespectively to estimate the hydrogeological parameters of studied aquifer. Fig. 3 and Fig. 4 display the distribution of hydraulic conductivity estimated from the GPR and ERT measurement section with a depth below 16 m. It can be seen that both geophysical methods are able to map the distribution of hydraulic conductivity and reflect the heterogeneity in the subsurface. The mean values of hydraulic conductivity for the upper and lower part of the aquifer were 4.12 and 2.57 m/d respectively, according to the GPR data. ERT method and fitting curve method of pumping test provided mean values of 5.94 and 5.23 m/d respectively for the study area. Though there is an inconsistence among these three methods, such results are reasonable because of the difference of support volumes among them.
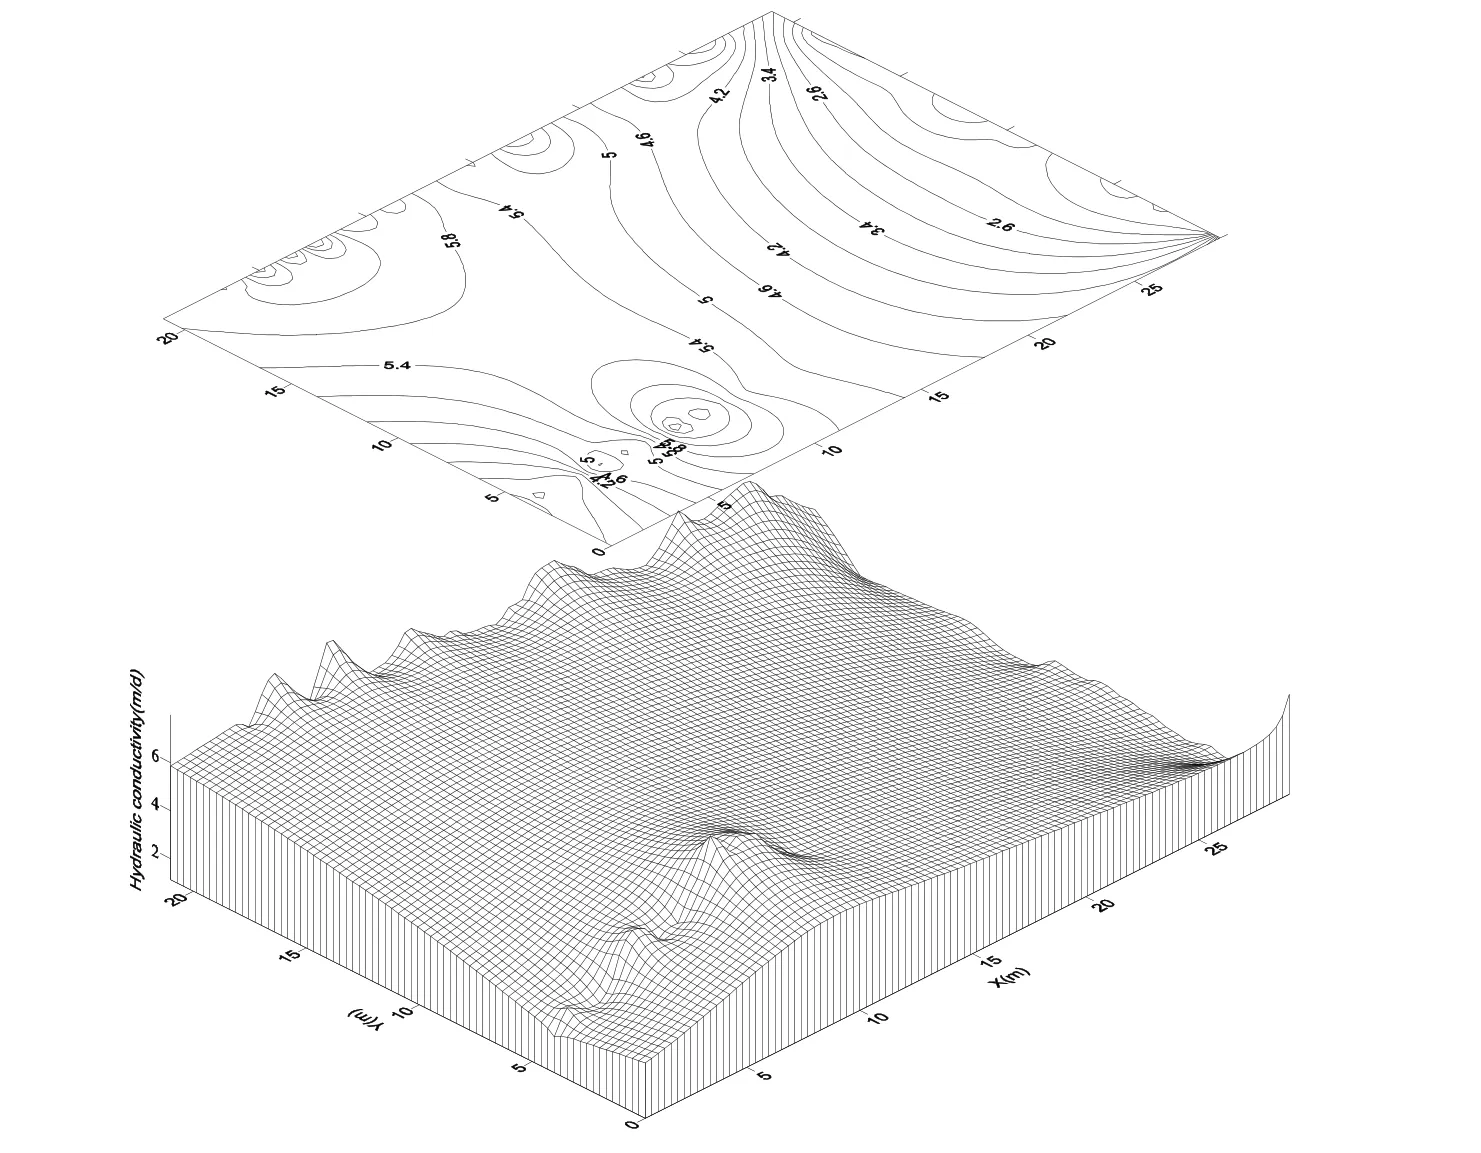
Fig. 3 The distribution of hydraulic conductivity obtained from GPR methods in the study area (the depth is less than 16 m) (Modified from Wu Ji-Chun (2006))

Fig. 4 The distribution of hydraulic conductivity obtained from ERT survey line in the study area (the depth is less than 16 m) (Modified from YU Yong-Xiang and WU Ji-Chun (2006))
2.2 Time-lapse monitoring of Dense Non-aqueous Phase Liquids (DNAPLs)infiltration process
With the development of time-lapse algorithm,geophysical methods have been powerful techniques for monitoring hydrological processes,including water flow in vadose zone (Daily W et al.1992; Arora T and Ahmed S, 2011; Johnson T C et al. 2012), contaminants transportation (Chambers J E et al. 2010; Revil A et al. 2013), environmental remediation (Johnson T et al. 2010; Flores Orozco A et al. 2011). DNAPLs trapped in subsurface pose a potential threat to soil and groundwater system.Recently, time-lapse geophysical methods have been used to monitor DNAPLs migration and remediation process. Chambers J E et al. (2004)used ERT to monitor the movement of DNAPLs in saturated porous media within a column. Orlando L and Renzi B (2015) conducted a controlled sandbox experiment to study the effects of DNAPLs release on geophysical signals through both GPR and ERT methods. Mao D et al. (2015)used ERT and SP methods to observe the trichloroethylene (TCE) remediation process in a laboratory experiment.
Though there are some achievements in the investigations associated with DNAPLs, a direct comparison between geophysical methods and accurate laboratory methods within an experiment is still lacking. In order to quantitatively evaluate the efficiency of ERT for monitoring DNAPLs migration, ERT and high-resolution light transmission visualization (LTV) methods were used to simultaneously monitor the infiltration process in a controlled laboratory experiment. The sandbox was filled with sands of various grain sizes to construct a heterogeneous porous media. We used sands of 40/50 mesh size as back ground media and sands of 100/140 meshsize to create the low-permeability layered lenses. The ERT measurement consisted of 13 parallel lines at a distance of 3 cm. AGI EarthImager was then used to combine these parallel lines to obtain an overall view of the resistivity distribution in the whole sandbox.
Fig. 5 shows the time-lapse images of DNAPLs migration with both LTV and ERT methods. The results show that the resistivity images well match the saturation images. ERT successfully shows the DNAPLs transport in the slightly heterogeneous porous media. It resolves the evolution of general shape of plume. Pooling and bypassing flow phenomenon are observed through ERT when DANPLs encounters the low-permeability lenses.Though pure DNAPLs is highly resistive (106Ω·m),the positive anomalies caused by the presence of DNAPLs is not significant under low-saturation.For example, the plume with a saturation of 0.3 only causes around a 40% increase of resistivity.Such small change of resistivity is likely to be ignored by investigators or covered by complex hydrogeological conditions, especially with the presence of biological activity.
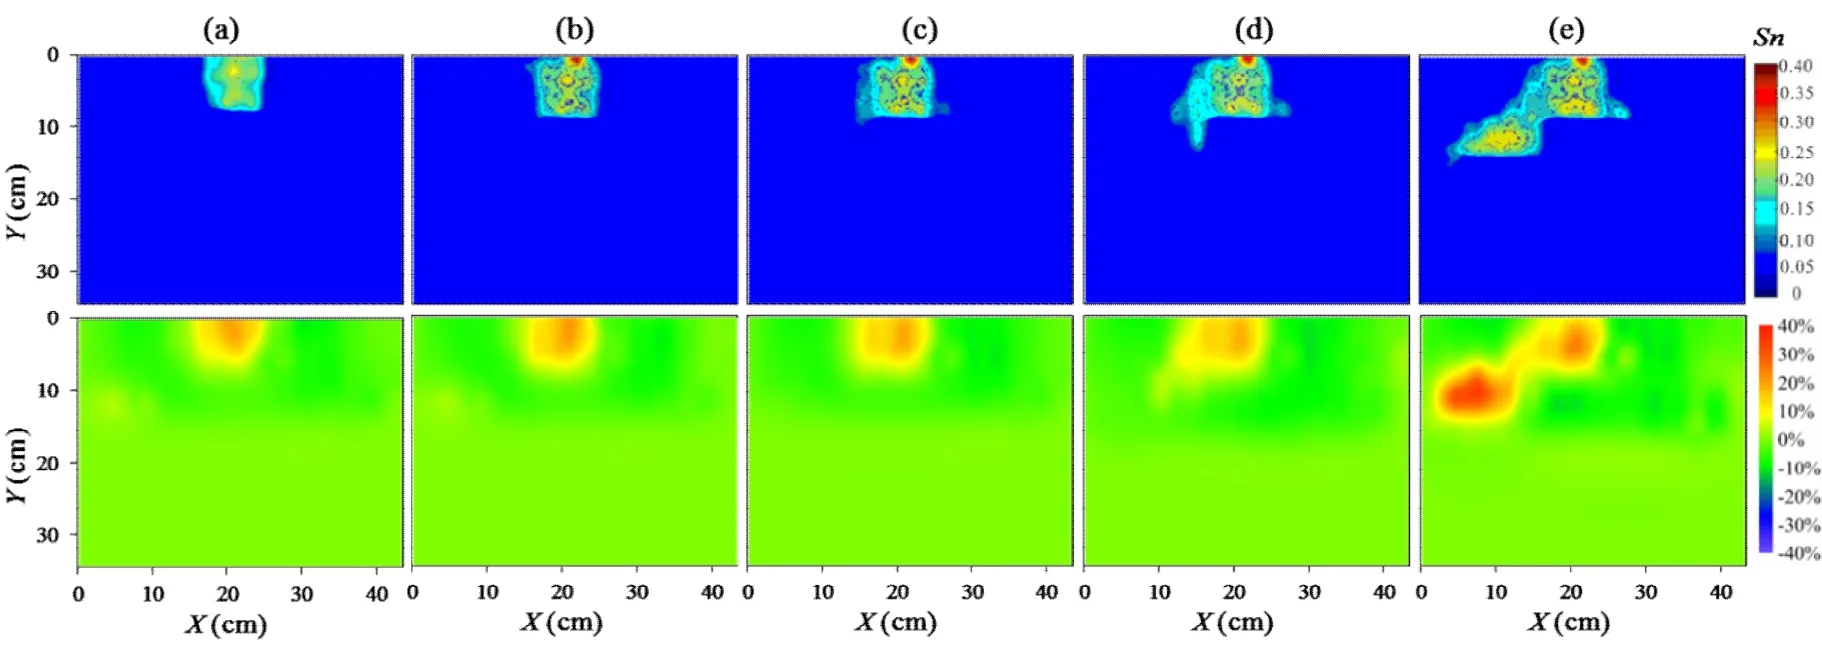
Fig. 5 Comparison between LTV (upper) and ERT (bottom) images at the same time. Data acquired after TCE injection: (a) 20 min; (b) 40 min; (c) 60 min; (d) 80 min; (e) 110 min. LTV images show the distribution of TCE saturation. Sn stands for the TCE saturation. ERT images show the percentage difference between sequential data and base data
2.3 Mapping of plumes in contaminated sites
Geophysical methods have been increasingly used to solve contamination problems. Naudet V et al. (2004b) and Rucker D F and Fink J B (2007)mapped the extension of inorganic plumes through high-resolution ERT method. Goes B J M et al.(2004) and Cardarelli E and Filippo G D (2009)used ERT and IP and correctly identified the plume of non-aqueous phase liquids (NAPLs). The examples above illustrate the application of geophysical methods in unplanned release caused by landfill leachate or oil pipeline leakage. There are also a number of researches associated with planned release of contaminants in controlled laboratory experiments to study the efficiency of geophysical methods for mapping electrically anomalous plumes. Slater L et al. (2002) and Lekmine G et al. (2012) conducted an ERT monitoring of solute transport and dispersion in porous media to quantify solute transport processes.Sentenac P et al. (2010) and LIU Han-le and ZHANG Sha (2014) used ERT to study the NAPLs plume migration in a simulated unconfined aquifer.
Here we give an example of the use of ERT method to delineate the extension of contaminant plume with high total dissolved solids (TDS)formed by leachate movement from a chemical plant. Geological data from well cores show that the site is composed of four stratigraphic layers including artificial fill, silty clay, silt and silty clay within the depth of 16 m. As a result, the hydraulic conductivity of this local area is rather weak. The regional groundwater flows from southwest to northeast with a hydraulic gradient of 1‰-2‰.The groundwater level was measured between 2.55-4.92 m underground in this area. Based on the previous analysis of soil and water samples,inorganic salts like Fe and Na make up the main contaminants in the study area. The ERT surveys at the site involved 43 lines and the data were collected by using Wenner electrode arrays. The apparent resistivity data were then inverted using a least-squares method which is commonly used in 2D profile inversion. A curve which describes the relationship between resistivity and total dissolved solids (TDS) within the chemical plant is presented based on the ERT inversion results and corresponding hydrochemical data from boreholes(Fig. 6). This curve is thus used as the basis for the determination of plume range outside the chemical plant.
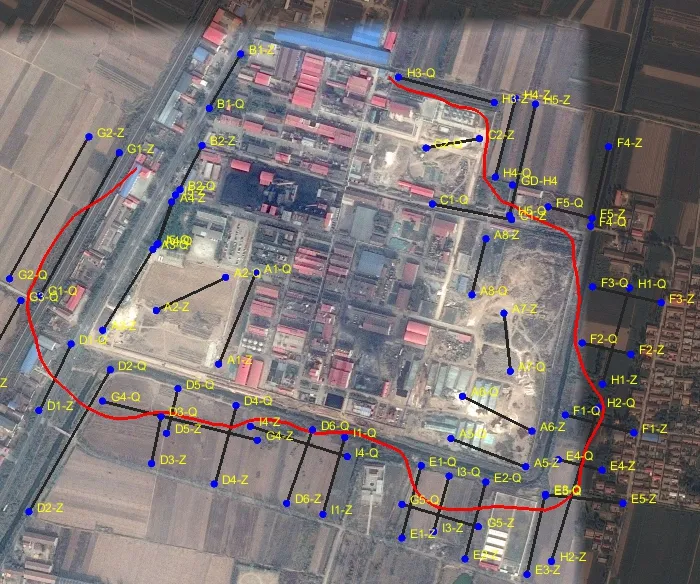
Fig. 8 The area of contaminant plume estimated from ERT surveys (Note: Black lines indicate ERT survey lines and red line shows the plume range)
Fig. 7 shows that the inversion resulted from 5 of 43 ERT lines, one of which was measured directly at the source zone which situated in the southwest of site labeled as line A-1. The other four lines were measured from the south, east,north and west of the source zone, labeled as line B-1, C-1, D-1 and E-1, respectively. In the source zone, the low resistivity, with values less than 1.0 Ω·m, is consistent with the high TDS measured by previous chemical analysis (Fig. 7a). In line B-1,low resistivity values are found between 15 and 80 m along the survey line. The range of low resistivity anomalies shown in line C-1 is similar to that of line B-1. The results for the resistivity tomography of line D-1 indicate that the contaminant plumes have not reached that far. As can be seen in Fig. 7e, the resistivity value and plume area shown in line E-1 are smaller compared to lines B-1 and C-1. As a result, a2D map showing the extension of contaminants plume is obtained by jointly analyzing all the 43 lines(Fig. 8).
3 Future challenges and directions
Significant achievements have been made in the applications of geophysical methods in hydrogeological field over last few decades. Geophysical methods have been widely used in mineral exploration, assessment of geohazards, subsurface architecture delineation, solving environmental problems and hydrogeological processes. Despite these advances, challenges still exist in the field of hydrogeophysics and deserve further research.
(1) Hydrogeophysical relationship
First of all, it is necessary to establish universally used petrophysical models that incorporate hydrogeological properties with geophysical properties. As is known, geophysical methods can not directly provide hydrogeological information and their effectiveness is dependent on the strength of relationship between obtained geophysical properties and properties of interest.
(2) Uncertainty analysis
Secondly, assessment of uncertainty in the derived inverted image is generally ignored, which would lead to the misinterpretation of subsurface.For most applications, adopting an inversion scheme and obtaining a model consistent with the data is the common approach. However, generally,there is more than one model that is consistent with the data due to the imposed regularization.
(3) Large-scale architecture characterization
Thirdly, most early hydrogeophysical surveys have focused on the bench- and plot- scale hydrogeological investigations. With the improvement of geophysical data acquisition system, we can see more applications of waterborne or airborne geophysical approaches in hydrogeology to help with thelarge- scale hydrological resource exploration, management and protection managements. In particular, they have the potential for characterizing the hydrogeochemical and biogeochemical processes occurring at the interface of groundwater and surface water.
(4) Biogeophysics and ecosystem science
In addition, we can see an increasing trend in using geophysical methods to help with hydrogeological surveys involving biogeochemical processes and study the ecosystem. Existing studies have shown that electrical polarization measurement has greater potential in the characterization of complex hydrogeochemical process which includes the physical, chemical and biological transformations. Recently, geophysical dataset and geochemical data have been integrated to the estimation of hydrogeochemical processes.Hydrogeophysical methods will play a more important role in ecosystem studies for food production and resources exploration.
In the near future, we will see further advances in inversion schemes and instrumentation to tackle present constraints. Also, fusion of multiple types of data, including both traditional hydrogeological information and geophysical data, will become increasingly popular in hydrogeological parameters estimation.
Acknowledgements
This work is funded by the National Natural Science Fund of China (NSFC)-Xinjiang No. U1503282 and by the NSFC No. 41030746,41672229 and 41172206.
杂志排行
地下水科学与工程(英文版)的其它文章
- Building a scientific and ecological earth-on an important field of geo-science: Geo-environment and construction engineering effect
- A discussion of up-flow springs
- Statistical characteristics of heavy metals content in groundwater and their interrelationships in a certain antimony mine area
- Thermal stresses analysis of casing string used in enhanced geothermal systems wells
- Groundwater resources in karst area in Southern China and sustainable utilization pattern
- Study on engineering-hydrogeological problems of hydroelectric project
