Evolution and phylogenetic application of the MC1R gene in the Cobitoidea (Teleostei: Cypriniformes)
2016-11-15QiongYingTANGLiXiaSHIFeiLIUDanYUHuanZhangLIU
Qiong-Ying TANG, Li-Xia SHI, Fei LIU, Dan YU, Huan-Zhang LIU
1The Key Laboratory of Aquatic Biodiversity and Conservation of Chinese Academy of Sciences, Institute of Hydrobiology, Chinese Academy of Sciences, Wuhan 430072, China
2University of Chinese Academy of Sciences, Beijing 100049, China
Evolution and phylogenetic application of the MC1R gene in the Cobitoidea (Teleostei: Cypriniformes)
Qiong-Ying TANG1,*, Li-Xia SHI1,2, Fei LIU1, Dan YU1, Huan-Zhang LIU1,*
1The Key Laboratory of Aquatic Biodiversity and Conservation of Chinese Academy of Sciences, Institute of Hydrobiology, Chinese Academy of Sciences, Wuhan 430072, China
2University of Chinese Academy of Sciences, Beijing 100049, China
Fish of the superfamily Cobitoidea sensu stricto(namely loaches) exhibit extremely high diversity of color patterns, but so far little is known about their evolutionary mechanism. Melanocortin 1 receptor gene (MC1R) plays an important role during the synthesis of melanin and formation of animal body color patterns. In this study, we amplified and sequenced the partial MC1R gene for 44 loach individuals representing 31 species of four families. Phylogenetic analyses yielded a topology congruent with previous studies using multiple nuclear loci,showing that each of the four families was monophyletic with sister relationships of Botiidae+(Cobitidae+(Balitoridae+Nemacheilidae)). Gene evolutionary analyses indicated that MC1R in loaches was under purifying selection pressure, with various sites having different dN/dSvalues. Both Botiidae and Cobitidae had lower dN/dSvalues than those of background lineages, suggesting their evolution might be strongly affected by purifying selection pressure. For Balitoridae and Nemacheilidae, both had larger dN/dSvalues than those of background lineages, suggesting they had a faster evolutionary rate under more relaxed selection pressure. Consequently, we inferred that the relatively stable color patterns in Botiidae and Cobitidae might result from the strong purifying selection pressure on the MC1R gene, whereas the complicated and diverse color patterns in Balitoridae and Nemacheilidae might be associated with the relaxed selection pressure. Given the easy experimental procedure for the partial MC1R gene and its excellent performance in reconstructing phylogeny, we suggest this gene could be used as a good molecular marker for the phylogenetic study of fish species.
Gene evolution; Molecular phylogeny;Cobitoidea; Melanocortin 1 receptor gene
lNTRODUCTlON
The superfamily Cobitoidea is a group of small- to mediumsized benthic fish, composed of approximately 28% of species of the order Cypriniformes, which is the largest group of freshwater fish in the world (Nelson et al., 2016). Depending on different authors, Cobitoidea includes variable families. Bohlen & Šlechtová (2009) and Chen et al. (2009) congruently recognized the genus Ellopostoma as a distinct new family Ellopostomatidae, and proposed that Cobitoidea is composed of eight families (Catostomidae, Gyrinocheilidae, Botiidae,Vaillantellidae, Cobitidae, Ellopostomatidae, Nemacheilidae and Balitoridae). Kottelat (2012) raised genera Serpenticobitis and Barbucca to family rank, and established Serpenticobitidae and Barbuccidae. Both Serpenticobitis and Barbucca have been formerly included in Balitoridae (Bohlen & Šlechtová, 2009;Šlechtová et al., 2007), and consist of three and two species,respectively. While the most recent version of Fishes of the World (Nelson et al., 2016) follows Kottelat (2012), without more convincing evidence, we herein adopt the classification of Cobitoidea suggested by Šlechtová et al. (2007), Bohlen & Šlechtová (2009), and Chen et al. (2009).1
Cobitoidea sensu stricto, which excludes Gyrinocheilidae(algae eaters) and Catostomidae (suckers), is commonly known as the loaches (Nelson et al., 2016). This group of fish exhibit extremely high color pattern diversity, resulting in the observed abundant biodiversity of loaches. This makes them ideal subjects for studying adaptive evolution to environments,camouflage, kin recognition, and mate choice. Their beautiful color patterns also attract numerous fish enthusiasts, making them one of the most important groups of aquarium fish. A number of community websites about loaches have beenestablished by fish hobbyists, with the most detailed site(Loaches Online, http: //www.loaches.com/) containing comprehensive knowledge on their taxonomy, form, disease,and care. Additionally, some loach species are considered as important economic fish, including Misgurnus anguillicaudatus(mud loach), which is widely farmed in China (Zhang et al.,2012). Therefore, loaches play significant roles in both evolutionary biology and social economy. To date, however, the phylogenetic relationships of loaches still remain controversial(Liu et al., 2012; Mayden et al., 2009; Šlechtová et al., 2007;Tang et al., 2006). As for their color patterns, almost no investigations have been performed, and little is known about their evolutionary mechanisms.
Among the many genes related to color patterns,melanocortin 1 receptor gene (MC1R) is one of the most widely studied, belonging to a family of G-protein-coupled receptors involved in various physiological processes in vertebrates and playing an important role in the synthesis of melanin and formation of animal body color patterns (Selz et al., 2007). The MC1R gene has been extensively investigated in numerous animal species, including reptiles (Corso et al., 2012; Cox et al.,2013; Herczeg et al., 2010; Nunes et al., 2011; Rosenblum et al., 2004), birds (Baiao & Parker, 2012; Mundy, 2005),mammals (Ayoub et al., 2009; Lu & Zhang, 2001; Pérez et al.,2013), and fish (Bar et al., 2013; Gross et al., 2009; Henning et al., 2010; Selz et al., 2007). Almost all fish species studied thus far have shown that the MC1R gene is conserved as a single copy and single exon protein-coding gene with a 966 bp long open reading frame (ORF), including seven transmembrane domains (Bar et al., 2013; Braasch et al., 2008; Henning et al.,2010; Hofreiter & Schöneberg, 2010; Nunes et al., 2011),suggesting that this gene should be a good molecular marker for reconstructing fish phylogeny. So far, however, only a few studies have applied this gene to mammal phylogenies (Ayoub et al., 2009; Pérez et al., 2013), and no report exists for fish phylogenies. The color patterns of loaches are highly diverse,which make them good subjects to study the evolution of the MC1R gene. In the present study, we amplified and sequenced the partial sequence of the MC1R gene in loaches, and analyzed their characteristics. Using this gene as a molecular marker, the phylogeny of loaches was reconstructed, and the evolution of the MC1R gene was then analyzed.
MATERlALS AND METHODS
Sample collection
Because species of the families Ellopostomatidae and Vaillantellidae are distributed in Borneo, Sumatra, and Thailand,and only consist of two and three species, respectively,samples can be difficult to obtain. In this study, four families of loaches were involved. In total, 52 individuals representing 34 species in Cypriniformes were selected for analyses of MC1R gene evolution, which included 44 individuals belonging to 31 loach species and several outgroups, including one Gyrinocheilus aymonieri, one Hypophthalmichthys molitrix, and six Danio rerio individuals. To guarantee the accuracy of the targeted sequences, the cDNA sequences of four D. rerio individuals were downloaded from GenBank. In addition, we sequenced two D. rerio individuals, and all 46 other sequences in the present study. All samples were collected from the main drainages in China and aquarium markets, preserved in 95% ethanol, and deposited in the Institute of Hydrobiology, Chinese Academy of Sciences. Detailed information of all samples is listed in Table 1, with GenBank accession numbers included.
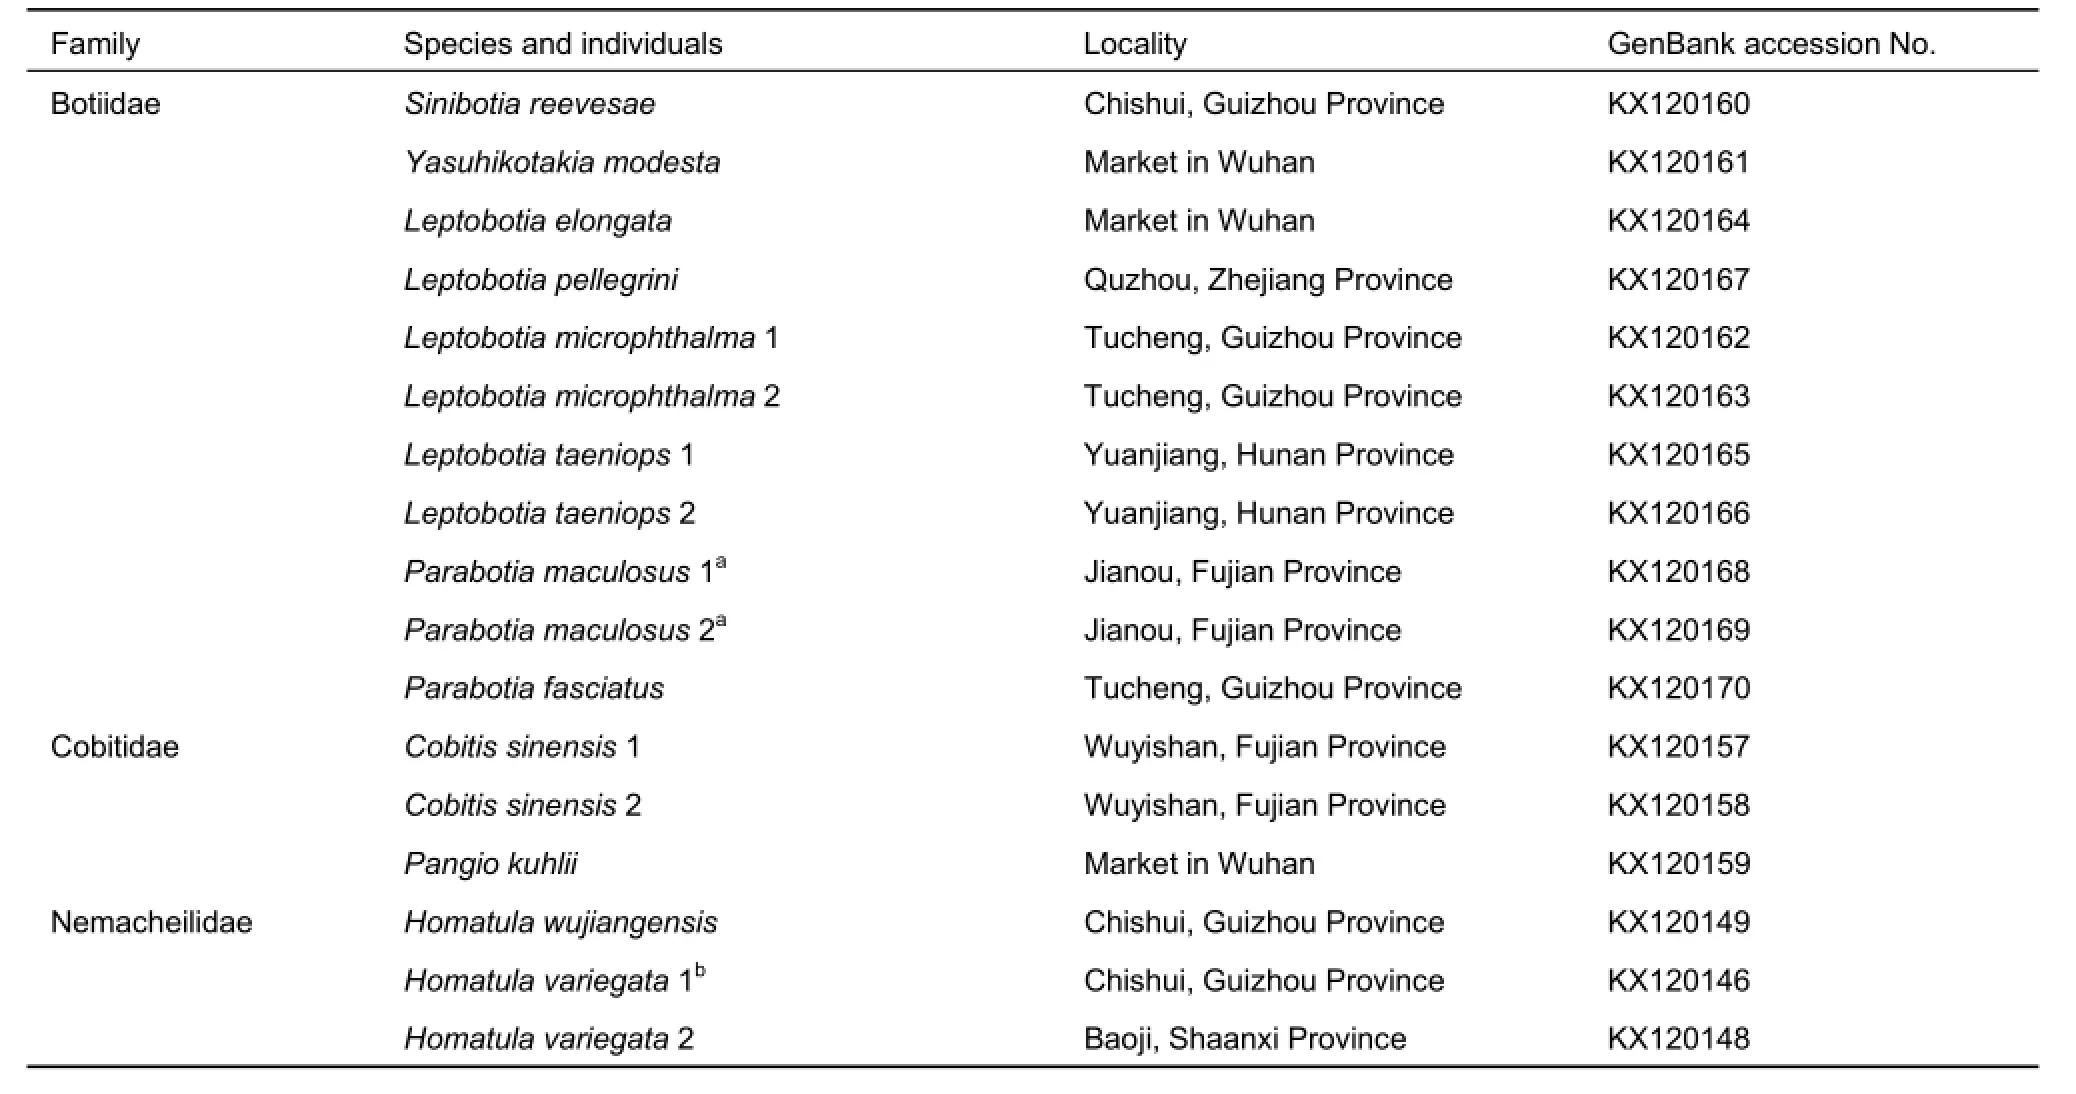
Table 1 Samples used in the present study

Continued
DNA extraction, PCR amplification, and sequencing
Total DNA was extracted from muscles following the saltextraction procedure of Aljanabi & Martinez (1997), with some modification as per Tang et al. (2008). Five pairs of primers were newly designed according to the conserved regions of the aligned teleost MC1R gene sequences, and the lengths of the target segments ranged from 650 bp to 850 bp. However, only by using the primer set for the shortest target segment could we successfully obtain sequences for all samples. Thus, the primer set used was inMC1RF (5'-AGCGTCAGYAAYGTGGTGGAGA-3') and inMC1RH (5'-CGGTTCTGTACCTGCACAT-3').
The polymerase chain reaction (PCR) mixtures contained 3 μL of 10× taq Buffer, 0.9 μL of dNTPs (10 mmol/L), 0.75 μL of eachprimer (10 mmol/L), 0.15 μL of Taq polymerase, 1 μL of DNA template, and sterile distilled H2O to a final volume of 30 μL. The PCR thermal cycle profile was as follows: initial denaturation step at 94 °C for 5 min, followed by 35 cycles at 94 °C for 30 sec,56 °C for 45 sec, 72 °C for 1 min, and a final extension at 72 °C for 8 min. The amplified fragments were purified and sequenced by Sangon Biotech (Shanghai) Co., Ltd. To confirm the accuracy of sequencing, sequencing reactions were performed from both ends of each fragment using the same primers as PCR amplification.
Sequence variation and phylogenetic analyses
Multiple alignments of sequences were performed using ClustalX 2.1 (Larkin et al., 2007; Thompson et al., 1997)alignment editor with the default settings, with all aligned sequences then translated into amino acid residues in MEGA 6.0 (Tamura et al., 2013) to test for sequencing mistakes. The alignments were verified by eye in SEAVIEW (Galtier et al.,1996). Saturation of genes and codon positions were assessed using the ‘transitions and transversions vs. divergence' graphic function in DAMBE 5 (Xia, 2013). Nucleotide compositions and pairwise genetic distances were calculated based on the Kimura 2-parameter model with standard errors estimated using 1 000 bootstrap replicates. Molecular phylogenetic relationships were estimated using Bayesian inference (BI) and maximum likelihood (ML) methods. The optimal model of nucleotide evolution for BI analyses was identified using the Bayesian Information Criterion (BIC) as estimated in jModelTest 2.1.7 (Darriba et al., 2012; Guindon & Gascuel, 2002). The TPM1uf+G model was selected as the best model, so we set the parameter nst=6 with rates=gamma when running the BI analyses.
Bayesian inference (BI) was carried out using MrBayes 3.1.2(Ronquist & Huelsenbeck, 2003). Two independent analyses with four simultaneous Markov chains were run for 4 000 000 generations, sampling every 1 000 generations, with a total of 4 001 trees each. We discarded all samples obtained during the first 1 000 000 generations as ‘‘burn-in”, and a 50% majorityrule consensus tree with posterior probability values for each node was obtained from the remaining 3 001 trees (Figure 1).
Maximum likelihood (ML) analysis was conducted using RAxML 8.1.13 (Stamatakis, 2014). We searched for the best scoring ML tree using a general time-reversible nucleotide model (GTR) with gamma-distributed rate variation among sites(G) and invariable sites (I). A rapid bootstrap analysis with 1 000 replicates was used to assess the relative robustness of node support.
Analyses of MC1R gene evolution
The ω ratio (defined as the ratio of non-synonymous vs. synonymous substitution rates, i.e., ω=dN/dS) is a measure of natural selection acting on a protein. Simplistically, values of ω<1, =1, and >1 means negative purifying selection, neutral evolution, and positive selection, respectively (Yang, 2007). Site models and branch models were separately adopted to estimate whether the MC1R gene in the present study had experienced different selection pressures along different sites and different lineages. The CODEML program within the PAML package was used to assess parameters in models of sequence evolution and to test relevant hypotheses (Yang,2007). In the following analyses, the outgroups were excluded, and the input tree was an unrooted tree with trifurcation at the root.
For site models, we examined three pairwise codon-based substitution models to assess ω values for all codon sites: M0(one-ratio) vs. M3 (discrete ω), M1a (nearly neutral) vs. M2a(positive selection), and M7 (β distribution) vs. M8 (β distribution and a fraction of sites with ω>1). Likelihood ratio tests (LRTs)were performed to compare the fit of two pairwise models. It is assumed that twice the log likelihood difference between nested models (2ΔlnL) follows a χ2distribution with the number of degrees of freedom equal to the difference in the number of free parameters (Whelan & Goldman, 1999). When LRTs indicate positive selection, the Bayesian empirical Bayesian(BEB) method (Yang et al., 2005) can be used to calculate the posterior probabilities of positively selected codons.
For branch models, based on the phylogenetic tree yielded in the present study (Figure 1), we divided loaches into four lineages corresponding to four families (Balitoridae,Nemacheilidae, Cobitidae, and Botiidae). The following steps were performed: (1) ω values of the MC1R gene dataset were estimated for all lineages using a one-ratio model (all lineages share a common ω value); (2) each lineage was separately treated as a foreground lineage compared with the remaining lineages (background lineages), and two-ratio models(foreground lineage and background lineages have different ω values) were independently conducted for each lineage; (3) four pairs of LRTs were examined between the one-ratio and tworatio models for four lineages.
RESULTS
Characteristics of MC1R gene sequences
After alignment, 591 bp of the MC1R gene sequences was used for analysis. No indels or deletions were detected. In total,43 haplotypes were identified from 52 individuals. For the 44 loach individuals, 38 haplotypes were recognized. Except for Jinshaia abbreviata and J. sinensis sharing the same haplotype,all other shared haplotypes occurred among different individuals of the same species. The average nucleotide composition for all species was A=19.5%, T=28.5%, G=22.1%,and C=29.9%. The content of A+T (48.0%) was lower than that of C+G (52.0%). Strong compositional biases against A existed at the third position (only 7.6%). For the 591 bp sequences, 226 sites were variable, of which 194 were parsimony informative. The average ratio of transitions/transversions (Ti/Tv) was 2.084. Plots of the absolute transitions and transversions versus TrN distance showed that the transitions and transversions for all three codon positions did not reach saturation (not shown).
Phylogenetic relationships of Cobitoidea
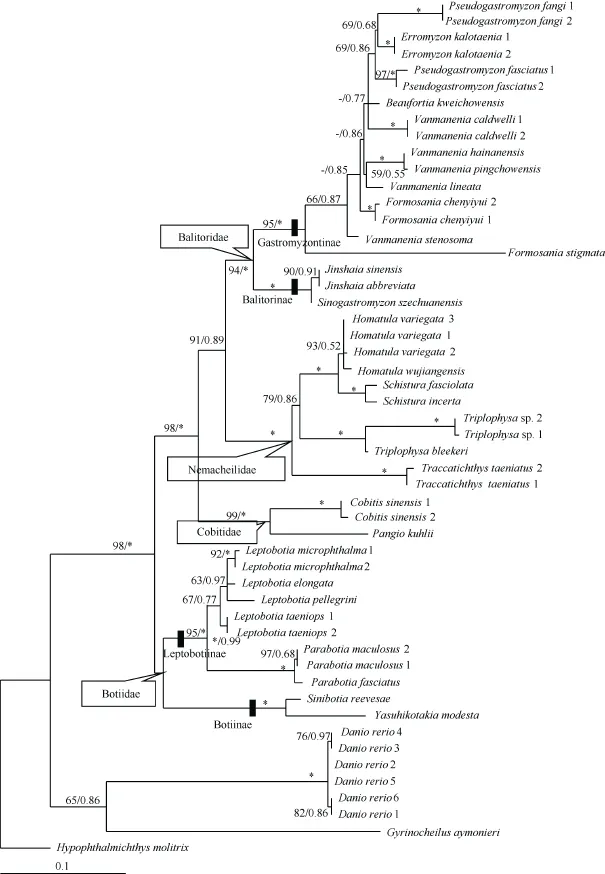
Figure 1 ML tree estimated using RaxML for all individuals based on partial MC1R gene sequencesValues at the nodes correspond to support values for ML/BI methods (only values >50 or 0.50 shown). *: a support value of 100 or 1.00; -: values of <50 or 0.50. Species names are followed by individual codes as in Table 1.
Maximum likelihood and BI analyses yielded almost the same topologies, except that the lineage (representing one botiid subfamily, Botiinae) formed by Sinibotia reevesae andYasuhikotakia modesta had a different position. In the ML tree,this lineage clustered with botiid subfamily Leptobotiinae,formed by Leptobotia and Parabotia species, and together they formed the family Botiidae. Whereas in the BI tree, Botiinae was located in the basal position of all loaches, but with a very low posterior probability (only 0.44). The ML tree with node support values of both methods labeled is shown in Figure 1.
The phylogenetic tree indicated that each of the four loach families was monophyletic and had high support values(bootstrap value (BP) higher than 94 in ML, and all posterior probability (PP)=1.00 in BI), except for Botiidae. The sister relationships among the four families was Botiidae+ (Cobitidae+(Balitoridae+Nemacheilidae)). Balitoridae and Nemacheilidae formed a sister group with medium support values (BP=91 in ML,and PP=0.89 in BI), located at the crown of the phylogenetic tree. The family Cobitidae was at an intermediate position. Within Botiidae, Botiinae was distantly related to the Leptobotiinae with a genetic distance of 0.092±0.013. For balitorid species, subfamilies Balitorinae and Gastromyzontinae were both monophyletic and formed monophyletic Balitoridae. Within Gastromyzontinae, however, the species of genera Vanmanenia, Formosania, and Pseudogastromyzon were not monophyletic. The genetic distance between these two subfamilies was not very high (0.073±0.010). The pairwise mean genetic distances of the MC1R gene among the loach groups are listed in Table 2.
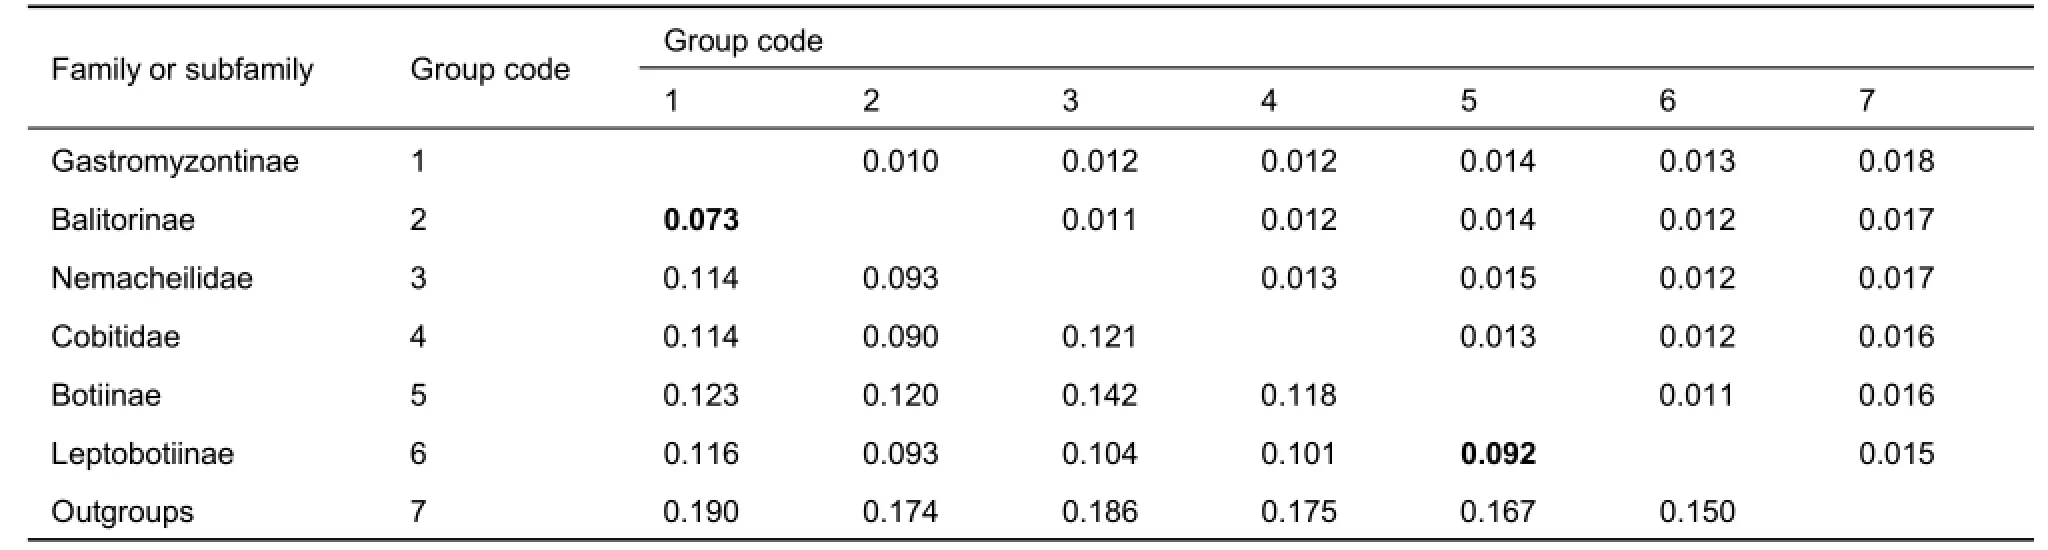
Table 2 Pairwise mean genetic distance (lower triangle) and standard error (upper triangle) based on the Kimura 2-parameter model for loach groups and outgroups
Evolution of the MC1R gene in Cobitoidea
Using the topology yielded by the ML method, we analyzed the evolution of MC1R in Cobitoidea. Analysis based on the oneratio model M0 showed that the average ω value of the MC1R gene in all loaches was 0.034 9, much less than 1, suggesting that the average selection pressure on this gene was negative or purifying. Using LRT analyses, comparisons of the pairwise models indicated that the M3 model (having discrete ω values among sites; -lnL=3 295.024 728) was significantly better than the M0 model (having the same ω value of all sites; -lnL=3 366.540 405) (P=0.000) at estimating ω values among sites; however, there was no obvious difference between M1a(nearly neutral; -lnL=3 301.622 991) and M2a (positive selection; -lnL=3 301.622 991) models (P=1.000), suggesting that no amino acid site was obviously under positive selection, although different sites had variable evolutionary rates. However, comparison also indicated that the M8 model (-lnL=3 297.026 100) was significantly better than the M7 model (-lnL=3 304.204 399) (P=0.001),and the BEB procedure identified amino acid sites 12Q, 20Q,and 176H as possibly being under positive selection, though each posterior probability (Pr) was less than 95% (59.2%,73.0%, and 87.3%, respectively) (Table 3).
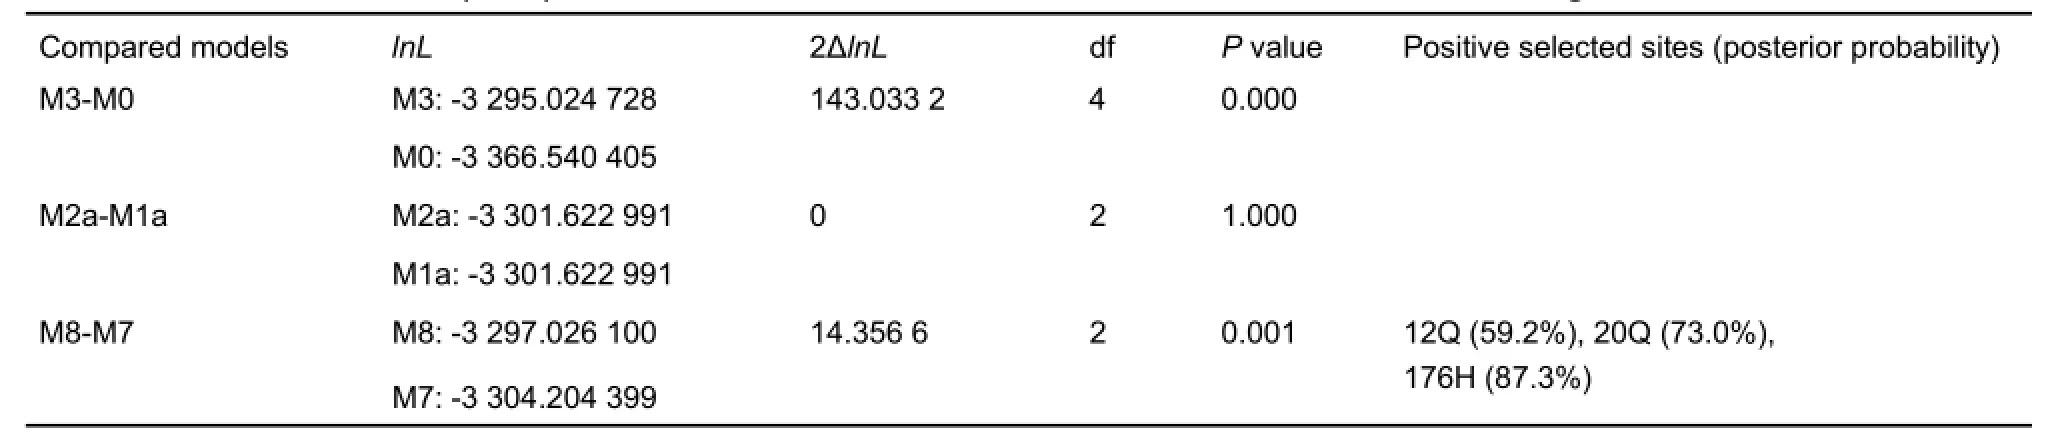
Table 3 Likelihood ratio tests (LRTs) between selected CODEML codon substitution models for the MC1R gene of Cobitoidea
For variation of the ω values among the loach lineages,pairwise comparisons of LRTs between so called “foreground”and “background” lineages showed that two pairs were detected with significant variations. The mean ω value of Balitoridae (0.055 1) was significantly higher than that of the other three families (denoted as non-balitorids, 0.026 0)(P=0.006), whereas the mean ω value of Cobitidae (0.002 8)was significantly lower than that of the non-cobitids (0.040 5)(P=0.00). For Botiidae, its mean ω value was lower (0.025 2)than that of the non-botiids (0.039 8) (P=0.096). The mean ω value of the nemacheilids (0.046 0) was slightly higher than that of the non-nemacheilids (0.032 1) (P=0.211). The pairwise comparison results for the four lineages are listed in Table 4.

Table 4 LRTs performed to detect heterogeneous selection regimes among lineages for the MC1R gene
DlSCUSSlON
Evolutionary variation of MC1R among sites and loach lineages
Presently, dozens of studies have indicated that the MC1R gene is highly conserved among vertebrates, and variations are closely associated with pigmentation differences (Hubbard et al.,2010; Mundy, 2005; Nunes et al., 2011; Rosenblum et al., 2004),with only a few exceptions (Cheviron et al., 2006; Dorn et al.,2011). Such findings are important in clarifying the origin of new species or local adaptation within species (Hubbard et al.,2010). Compared with other vertebrates, teleost fish have more diverse color patterns (Parichy, 2003). Among numerous cypriniform fish, loaches are one of the most important groups with colorful pigment patterns.
The present results showed that in loaches the MC1R gene was under negative selection pressure overall (average value of ω=0.034 9<1). Analyses based on site models indicated that the M3 model was significantly better than the M0 model(P=0.000), suggesting that various sites of the MC1R gene had disparate selection pressure. However, no amino acid site was obviously under positive selection since no significant difference existed between the M1a (nearly neutral) and M2a (positive selection) models (P=1.000). In contrast to the M1a-M2a comparison, the results of the M7-M8 comparison were significant and model M8 detected three positive amino acid sites, though with low posterior probabilities. Yang (2007)determined that the ω estimate under M8 might often produce false positives and the M1a-M2a comparison could be more robust. Therefore, given the results of the M1a-M2a comparison,evolution of the MC1R gene in loaches does not appear to be affected by positive selection.
As for different loach lineages, analyses based on branch models showed that both Cobitidae and Botiidae had much lower ω values than the background lineages, with Cobitidae reaching a level of significant difference and Botiidae showing no significant difference. Since differences in ω values reflect differences in the level of constraint (Rosenblum et al., 2004),the lower ω values suggest that MC1R gene evolution in both Cobitidae and Botiidae might be strongly affected by purifying selection pressure. For Balitoridae and Nemacheilidae,however, both have higher ω values than those of the background lineages, with the former at a significant level. This suggests that both families might have experienced a more relaxed selection pressure and relatively faster evolutionary rate than that of the background lineages. Among the four loach families, the botiid species exhibit the most regular color pattern,commonly with black vertical bars on the body sides. Species of Cobitidae have several types of color patterns, though typically show Gambetta pigment lines, as displayed in the genus Cobitis, which are defined as five color zones from the dorsal to lateral sides (Chen & Chen, 2005; Chen et al., 2015). For balitorid and nemacheilid species, the color patterns are extremely complicated and diverse, and include vertical bars,horizontal bands, spherical blotches, scattered spots, and irregular cloud-like patches. Consequently, we inferred that the relatively stable color pattern in Botiidae and Cobitidae might partially result from strong purifying selection pressure on the MC1R gene, whereas the diverse color patterns in Balitoridae and Nemacheilidae might be associated with relaxed selection pressure on this gene.
Phylogenetic application of the MC1R gene
As mentioned above, in the fish species analyzed so far, the MC1R gene is reported to be a conserved single copy and single exon protein-coding gene with a total length of more than 800 bp, making it a good molecular marker for phylogenetic research (Li et al., 2007). Until this study, however, no phylogenetic application of this gene has been reported for fish.In our research, partial MC1R gene sequences (591 bp) were adopted for establishing the phylogeny of Cobitoidea, which yielded a well-supported phylogenetic tree, except for Botiidae with low support value. The present topology was consistent with previous studies using multiple nuclear loci (Chen et al.,2009; Liu et al., 2012; Mayden et al., 2009), and showed that Botiidae included two distantly related clades, corresponding to the two subfamilies Leptobotiinae and Botiinae proposed by Šlechtová et al. (2006). The genetic distance between these two subfamilies was 0.092±0.013, higher than that between the two subfamilies of Balitoridae (0.073±0.010). Therefore, it is reasonable to divide Botiidae into these two subfamilies. Within Balitoridae, the three genera, Vanmanenia, Formosania and Pseudogastromyzon, were not monophyletic. In our previous study (Liu et al., 2012), the monophyly of Vanmanenia and Formosania could not be supported either. Further study is needed to confirm the phylogeny of these three genera using more species samples, molecular markers, and morphological characters.
It is worth noting that the partial segment of the MC1R gene used in this study was easy to amplify using genomic DNA as a template with general PCR procedures, and easy to sequence. Therefore, this gene segment could be used as a good molecular marker for the phylogenetic study of fish species in the future.
ACKNOWLEDGEMENTS
We are very grateful to two anonymous reviewers for their valuable advice and careful revision on our manuscript. We thank Zhuocheng Zhou, Siqing Liu,Xue Wang, and Xiaobing Li for their kind help in collecting samples. Thanks are also given to Weifeng Chen, Yinping Wang, and Sen He for their help with laboratory experiments.
Aljanabi SM, Martinez I. 1997. Universal and rapid salt-extraction of high quality genomic DNA for PCR-based techniques. Nucleic Acids Research,25(22): 4692-4693.
Ayoub NA, Mcgowen MR, Clark C, Springer MS, Gatesy J. 2009. Evolution and phylogenetic utility of the melanocortin-1 receptor gene (MC1R) in Cetartiodactyla. Molecular Phylogenetics and Evolution, 52(2): 550-557.
Baiao PC, Parker PG. 2012. Evolution of the melanocortin-1 receptor(MC1R) in boobies and gannets (aves, suliformes). Journal of Heredity,103(3): 322-329.
Bar I, Kaddar E, Velan A, David L. 2013. Melanocortin receptor 1 and black pigmentation in the Japanese ornamental carp (Cyprinus carpio var. Koi). Frontiers in Genetics, 4: 6.
Bohlen J, Šlechtová V. 2009. Phylogenetic position of the fish genus Ellopostoma (Teleostei: Cypriniformes) using molecular genetic data. Ichthyological Exploration of Freshwaters, 20(2): 157-162.
Braasch I, Volff JN, Schartl M. 2008. The evolution of teleost pigmentation and the fish-specific genome duplication. Journal of Fish Biology, 73(8):1891-1918.
Chen WJ, Lheknim V, Mayden RL. 2009. Molecular phylogeny of the Cobitoidea (Teleostei: Cypriniformes) revisited: position of enigmatic loach Ellopostoma resolved with six nuclear genes. Journal of Fish Biology, 75(9):2197-2208.
Chen YF, Chen YX. 2005. Secondary sexual characters, pigmentary zones of Gambetta and taxonomical revision the genus Cobitis from China(Pisces, Cobitidae, Cobitinae). Acta Zootaxonomica Sinica, 30(4): 647-658.(in Chinese)
Chen YX, Sui XY, He DK, Chen YF. 2015. Three new species of cobitid fish genus Cobitis (Teleostei, Cobitidae) from the River Pearl basin of China. Folia Zoologica, 64(1): 1-16.
Cheviron ZA, Hackett SJ, Brumfield RT. 2006. Sequence variation in the coding region of the melanocortin-1 receptor gene (MC1R) is not associated with plumage variation in the blue-crowned manakin(Lepidothrix coronata). Proceedings of the Royal Society B-Biological Sciences, 273(1594): 1613-1618.
Corso J, Gonçalves GL, De Freitas TRO. 2012. Sequence variation in the melanocortin-1 receptor (MC1R) pigmentation gene and its role in the cryptic coloration of two South American sand lizards. Genetics and Molecular Biology, 35(1): 81-87.
Cox CL, Rabosky ARD, Chippindale PT. 2013. Sequence variation in the Mc1r gene for a group of polymorphic snakes. Gene, 513(2): 282-286.
Darriba D, Taboada GL, Doallo R, Posada D. 2012. jModelTest 2: more models, new heuristics and parallel computing. Nature Methods, 9(8): 772. Dorn A, Ng'oma E, Janko K, Reichwald K, Polačik M, Platzer M, Cellerino A,Reichard M. 2011. Phylogeny, genetic variability and colour polymorphism of an emerging animal model: The short-lived annual Nothobranchius fishes from southern Mozambique. Molecular Phylogenetics and Evolution,61(3): 739-749.
Galtier N, Gouy M, Gautier C. 1996. SEAVIEW and PHYLO_WIN: two graphic tools for sequence alignment and molecular phylogeny. Bioinformatics, 12(6): 543-548.
Gross JB, Borowsky R, Tabin CJ. 2009. A novel role for Mc1r in the parallel evolution of depigmentation in independent populations of the cavefish Astyanax mexicanus. PLoS Genetics, 5(1): e1000326.
Guindon S, Gascuel O. 2002. A simple, fast and accurate method to estimate large phylogenies by maximum likelihood. Systematic Biology,52(5): 696-704..
Henning F, Renz AJ, Fukamachi S, Meyer A. 2010. Genetic, comparative genomic, and expression analyses of the Mc1r locus in the polychromatic Midas cichlid fish (Teleostei, Cichlidae Amphilophus sp.) species group. Journal of Molecular Evolution, 70(5): 405-412.
Herczeg G, Matsuba C, Merilä J. 2010. Sequence variation in the melanocortin-1 receptor gene (Mc1r) does not explain variation in the degree of melanism in a widespread amphibian. Annales Zoologici Fennici,47(1): 37-45.
Hofreiter M, Schöneberg T. 2010. The genetic and evolutionary basis of colour variation in vertebrates. Cellular and Molecular Life Sciences, 67(15):2591-2603.
Hubbard JK, Uy JAC, Hauber ME, Hoekstra HE, Safran RJ. 2010. Vertebrate pigmentation: from underlying genes to adaptive function. Trends in Genetics, 26(5): 231-239.
Kottelat M. 2012. Conspectus Cobitidum: an inventory of the loaches of the world (Teleostei: Cypriniformes: Cobitoidei). The Raffles Bulletin of Zoology,26: 1-199.
Larkin MA, Blackshields G, Brown NP, Chenna R, Mcgettigan PA, McwilliamH, Valentin F, Wallace IM, Wilm A, Lopez R, Thompson JD, Gibson TJ,Higgins DG. 2007. Clustal W and Clustal X version 2.0. Bioinformatics,23(21): 2947-2948.
Li C, Orti G, Zhang G, Lu G. 2007. A practical approach to phylogenomics:the phylogeny of ray-finned fish (Actinopterygii) as a case study. BMC Evolutionary Biology, 7: 44.
Liu SQ, Mayden RL, Zhang JB, Yu D, Tang QY, Deng X, Liu HZ. 2012. Phylogenetic relationships of the Cobitoidea (Teleostei: Cypriniformes)inferred from mitochondrial and nuclear genes with analyses of gene evolution. Gene, 508(1): 60-72.
Lu XM, Zhang YP. 2001. Molecular evolution of MC1R gene in human and non-human primates. American Journal of Human Genetics, 69(4): 355-355.
Mayden RL, Chen WJ, Bart HL, Doosey MH, Simons AM, Tang KL, Wood RM, Agnew MK, Yang L, Hirt MV, Clements MD, Saitoh K, Sado T, Miya M,Nishida M. 2009. Reconstructing the phylogenetic relationships of the earth's most diverse clade of freshwater fishes-order Cypriniformes(Actinopterygii: Ostariophysi): A case study using multiple nuclear loci and the mitochondrial genome. Molecular Phylogenetics and Evolution, 51(3):500-514.
Mundy NI. 2005. A window on the genetics of evolution: MC1R and plumage colouration in birds. Proceedings of the Royal Society B-Biological Sciences, 272(1573): 1633-1640.
Nelson JS, Grande TC, Wilson MVH. 2016. Fishes of the World. 5thed. New Jersey: John Wiley & Sons, Inc.
Nunes VL, Miraldo A, Beaumont MA, Butlin RK, Paulo OS. 2011. Association of Mc1r variants with ecologically relevant phenotypes in the European ocellated lizard, Lacerta lepida. Journal of Evolutionary Biology,24(10): 2289-2298.
Parichy DM. 2003. Pigment patterns: fish in stripes and spots. Current Biology, 13(24): R947-R950.
Pérez T, Essler S, Palacios B, Albornoz J, Domínguez A. 2013. Evolution of the melanocortin-1 receptor gene (MC1R) in chamois (Rupicapra spp.). Molecular Phylogenetics and Evolution, 67(3): 621-625.
Ronquist F, Huelsenbeck JP. 2003. MrBayes 3: Bayesian phylogenetic inference under mixed models. Bioinformatics, 19(12): 1572-1574.
Rosenblum EB, Hoekstra HE, Nachman MW. 2004. Adaptive reptile color variation and the evolution of the Mc1r gene. Evolution, 58(8): 1794-1808. Selz Y, Braasch I, Hoffmann C, Schmidt C, Schultheis C, Schartl M, Volff JN. 2007. Evolution of melanocortin receptors in teleost fish: the melanocortin type 1 receptor. Gene, 401(1-2): 114-122.
Šlechtová V, Bohlen J, Freyhof J, Ráb P. 2006. Molecular phylogeny of the Southeast Asian freshwater fish family Botiidae (Teleostei: Cobitoidea) and the origin of polyploidy in their evolution. Molecular Phylogenetics and Evolution, 39(2): 529-541.
Šlechtová V, Bohlen J, Tan HH. 2007. Families of Cobitoidea (Teleostei;Cypriniformes) as revealed from nuclear genetic data and the position of the mysterious genera Barbucca, Psilorhynchus, Serpenticobitis and Vaillantella. Molecular Phylogenetics and Evolution, 44(3): 1358-1365.
Stamatakis A. 2014. RAxML Version 8: a tool for phylogenetic analysis and post-analysis of large phylogenies. Bioinformatics, 30(9): 1312-1313.
Tamura K, Stecher G, Peterson D, Filipski A, Kumar S. 2013. MEGA6:molecular evolutionary genetics analysis version 6. 0. Molecular Biology and Evolution, 30(12): 2725-2729.
Tang QY, Freyhof J, Xiong BX, Liu HZ. 2008. Multiple invasions of europe by east asian cobitid loaches (Teleostei: Cobitidae). Hydrobiologia, 605(1):17-28.
Tang QY, Liu HZ, Mayden R, Xiong BX. 2006. Comparison of evolutionary rates in the mitochondrial DNA cytochrome b gene and control region and their implications for phylogeny of the Cobitoidea (Teleostei: Cypriniformes). Molecular Phylogenetics and Evolution, 39(2): 347-357.
Thompson JD, Gibson TJ, Plewniak F, Jeanmougin F, Higgins DG. 1997. The CLUSTAL_X windows interface: flexible strategies for multiple sequence alignment aided by quality analysis tools. Nucleic Acids Research, 25(24): 4876-4882.
Whelan S, Goldman N. 1999. Distributions of statistics used for the comparison of models of sequence evolution in phylogenetics. Molecular Biology and Evolution, 16(9): 1292-1299.
Xia XH. 2013. DAMBE5: A comprehensive software package for data analysis in molecular biology and evolution. Molecular Biology and Evolution, 30(7): 1720-1728.
Yang ZH. 2007. PAML 4: phylogenetic analysis by maximum likelihood. Molecular Biology and Evolution, 24(8): 1586-1591.
Yang ZH, Wong WSW, Nielsen R. 2005. Bayes empirical Bayes inference of amino acid sites under positive selection. Molecular Biology and Evolution, 22(4): 1107-1118.
Zhang XJ, Yao DR, Yan BL, Bi KR, Liang LG, Qin GM. 2012. Identification of Vibrio cholerae as a causative bacterium for an ulcer disease of cultured loach Misgurnus anguillicaudatus in China. African Journal of Microbiology Research, 6(9): 2060-2070.
01 April 2016; Accepted: 15 August 2016
s: This study was supported by the National Natural Science Foundation of China (NSFC 31272306, 31400359, 31401968)
s, E-mail: tangqy@ihb.ac.cn; hzliu@ihb.ac.cn
10.13918/j.issn.2095-8137.2016.5.281
杂志排行

Zoological Research的其它文章
- Lamprey: a model for vertebrate evolutionary research
- What is the destiny of a threatened fish, Ptychobarbus chungtienensis, now that non-native weatherfishes have been introduced into Bita Lake, Shangri-La?
- A new species of the genus Triplophysa (Cypriniformes:Nemacheilidae), Triplophysa daochengensis, from Sichuan Province, China
- A new cave species of the Genus Triplophysa from Yunnan, China
- Identification of candidate piRNAs in the gonads of Paralichthys olivaceus (Japanese flounder)
- Identification of Sphaeroma terebrans via morphology and the mitochondrial cytochrome c oxidase subunit I(COI) gene