Laser Linewidth and Spectral Resolution in Infrared Scanning Sum Frequency Generation Vibrational Spectroscopy System
2016-09-13FengWeiWenxiuXiZhongjinHuWenhuiLiJiyingZhngWnqunZhengInstituteforInterdisciplinryReserchKeyLortoryofOptoelectronicChemiclMterilsndDevicesofMinistryofEductionJinghnUniversityWuhn430056ChinCollegeofLifeScienceJinghn
Feng Wei,Wen-xiu Xi,Zhong-jin Hu,Wen-hui Li,Ji-ying Zhng,Wn-qun Zheng,c.Institute for Interdisciplinry Reserch,&Key Lortory of Optoelectronic Chemicl Mterils nd Devices of Ministry of Eduction,Jinghn University,Wuhn 430056,Chin .College of Life Science,Jinghn University,Wuhn 430056,Chin c.Institute des Sciences Mol´eculires d’Orsy,Universit´e de Pris-Sud,91405 Orsy Cedex,Frnce(Dted:Received on Jnury 1,2016;Accepted on Mrch 22,2016)
Laser Linewidth and Spectral Resolution in Infrared Scanning Sum Frequency Generation Vibrational Spectroscopy System
Feng Weia∗,Wen-xiu Xiab,Zhong-jin Hub,Wen-hui Lia,Ji-ying Zhanga,Wan-quan Zhenga,c
a.Institute for Interdisciplinary Research,&Key Laboratory of Optoelectronic Chemical Materials and Devices of Ministry of Education,Jianghan University,Wuhan 430056,China b.College of Life Science,Jianghan University,Wuhan 430056,China c.Institute des Sciences Mol´eculaires d’Orsay,Universit´e de Paris-Sud,91405 Orsay Cedex,France
(Dated:Received on January 1,2016;Accepted on March 22,2016)
Sum frequency generation vibrational spectroscopy(SFG-VS)is a robust technique for interfacial investigation at molecular level.The performance of SFG-VS mostly depends on the spectral resolution of the SFG system.In this research,a simplified function was deduced to calculate the spectral resolution of picosecond SFG system and the lineshape of SFG spectra based on the Guassian shaped functions of IR beam and visible beam.The function indicates that the lineshpe of SFG spectra from nonresonant samples can be calculated by the Guassian widths of both IR beam and visible beam.And the Voigt lineshape of SFG spectra from vibrational resonant samples can be calculated by the Homogeneous broadening(Lorentzian width)and Inhomogeneous broadening(Guassian width)of vibrational modes,as well as the Guassian widths of both IR beam and visible beam.Such functions were also applied to verify the spectral resolution of the polarization-resolved and frequency-resolved picosecond SFG-VS system which was developed by our group recently.It is shown that the linewidths of IR beams that generated from current laser system are about 1.5 cm-1.The calculated spectral resolution of current picosecond IR scanning SFG-VS system is about 4.6 cm-1,which is consist with he spctral resolution shown in the spectra of cholesterol monolayer(3.5-5 cm-1).
Lineshape calculation,Sum frequency generation,Vibrational spectra,Spectral resolution
I.INTRODUCTION
Sum frequency generation vibrational spectroscopy(SFG-VS),the second-order nonlinear optical spectroscopy,has been applied as a robust technique for interfacial investigation at molecular level for the past decades[1-9].By overlapping an infrared beam and a visible beam spatially and temporally onto molecular surface,the SFG signal with the frequency of summation of the incident visible beam and IR beam can be generated[10].Due to the symmetry requirement of the second-order nonlinear optical process,the SFG signals can only be generated from the non-centrosymmetric bulk mediums or the surface/interface,where the centrosymmetry is inherently broken.The merits of interface specificity and sub-monolayer sensitivity allow SFG-VS to not only obtain the molecular information such as structure,conformation and interaction strength,based on the vibrational peak position,amplitude and width,but also collect the reaction kinetics by monitoring the characteristic peaks of interfacial species or molecular groups.These information can be useful for the elucidation of molecular mechanisms and the analysis of interface specific thermodynamics.
Early SFG-VS experiments were usually performed by scanning the pulsed nanosecond or picosecond IR beams,with a linewidth of few wavenumbers or less[11].Such scanning SFG-VS system collects the SFG signal with PMT at each scanning step of wavenumbers.Broadband SFG-VS(BB-SFG-VS)system was developed at late 1990s by overlapping a broadband femtosecond IR beam and a narrowband visible beam that(linewidth reshaped)generated from a femtosecond laser[12,13].Such BB-SFG-VS system collects the SFG signal with a CCD detector,which also allow researchers to perform femtosecond resolved investigations in the time domain[14-20].
To obtain the molecular level information such as orientation and conformation,most of the SFG-VS spectra were interpreted based on their polarization dependent signals and phase interference properties(fitting parameters)[21-24].Thus,the performance of SFG-VS is m-ostly determined by the spectra fitting results and the spectral resolution of the SFG system.Spectra resolutions of 5-6 cm-1can be usually achieved in picosecond SFG systems(better resolution can be achieved in the wavenumber range of 3000-4000 cm-1)[25-30].And spectral resolutions of 5-20 cm-1can be achieved in femtosecond SFG systems determined by the linewidth of incident narrow-band visible beam. McGuire and Shen also demonstrated that an SFG spectral resolution of 6.6 cm-1can be achieved by using a time-domain Fourier-transform(FT)SFG intensity measurement with 100 femtosecond visible and IR pulses[31-33].
Recently,a sub-wavenumber high-resolution and broadband SFG-VS(HR-BB-SFG-VS)system with 0.6 cm-1spectral resolution was developed by Velarde et al.[34-38].Such HR-BB-SFG-VS system utilized a 90 ps visible beam as a nearly infinitely broad probe to capture the true free-induction decay(FID)vibrational coherent dynamics and the ideal SFG spectrum. A polariztion-resolved and frequency-resolved picosecond scanning SFG-VS system was also developed by our group recently[39].It has also been found out that the functions for HR-BB-SFG-VS system do not apply to our frequency-resolved picosecond IR-scanning SFG-VS system.Here we reported a function for the lineshape calculation of SFG-VS experiments based on the Guassian shaped functions of IR beam and visible beam. It is shown that the Voigt lineshape of SFG-VS spectra can be calculated by the homogeneous broadening and inhomogeneous broadening of vibrational modes,as well as the Guassian widths of both IR beam and visible beam.Such functions are also applied to verify the spectral resolution of the picosecond IR-scanning SFG-VS system.
II.THEORY
Assuming both of incident visible beam and IR beam are Gaussian shaped,their energy profile in the frequency domain and time domain can be described as∶

when both visible beam and IR beam are overlapped in time and space,the amplitude of emitting SFG signal ESFG(t)is proportional to the second-order polarization P(2)(t)which is calculated as the mathematical convolution of the second-order molecular response R(2)(t)with the electric fields of visible laser beam and IR laser beam(EVIS(t)and EIR(t))[35,40-43]∶

where τ is the time delay between the arrival of the IR and VIS pulses.As described by Benderskii and coworkers[40,42],the IR-resonant SFG process could be divided into a vibrational polarization P(1)(t)induced by the IR pulse and an up-conversion induced by the visible pulse.Since the up-converting VIS pulse is nonresonant,the de-phasing time of polarization P(2)(t)is very short which can be considered as an instantaneous event.And the second-order molecular response can be simplified as R(2)(t2,t1)~R(2)(t1)δ(t2)[35,44,45]. Thus we will have∶

By including the homogeneous(T2q)and inhomogeneous(∆ωq)broadening of vibrations,the intrinsic molecular response R(2)(t),can be described as[35,43,46,47]∶

where ANRis the non-resonant response of interfacial susceptibility,δ(t)is the Dirac delta function,and Θ(t)is the Heaviside step function[47].For the spectral resolution in high-resolution broadband SFG was discussed in detail in Ref.[35,36],as shown below∶
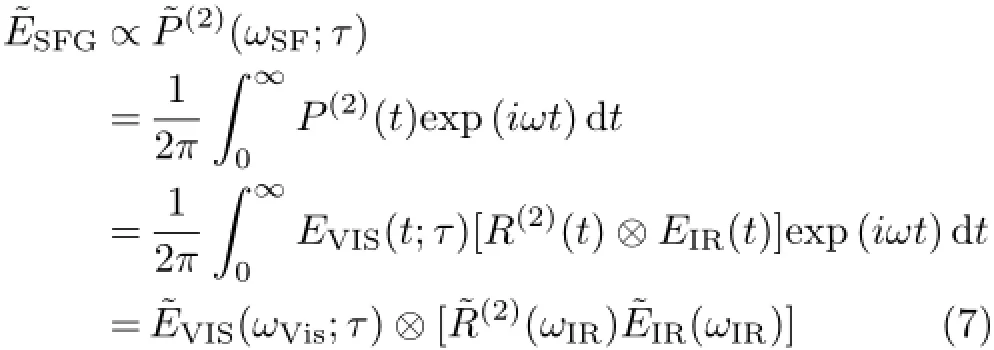
where ωIR,ωVIS,and ωSFare the center wavenumber of IR beam,visible beam and SFG signal.The wave line on the Vis and IR field function suggests the broadband SFG measurement.

The same equation would apply to the scanning SFG by adding the values for each individual IR frequencies of the scanning process to get the SFG spectrum,as∶here,is the field for each of the scanning wavelength IRand the summation is the process of the scanning to get the spectrum.Therefore,tually has the form ofif it is with a Gaussian lineshape,or any lineshape centered atThen,assuminghas the samefor each scanning wavelength,and since the SFG spectra are normalized to the IR intensity at each wavelength,Eq.(8)should have the form∶
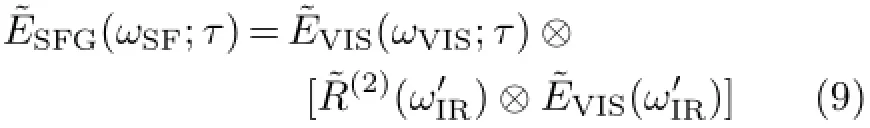
Since the convolution calculation can commute and exchange orders with each other,the SFG-VS spectra can be obtained by normalizing the SFG intensities with the laser intensities of visible beam and IR beams at each step of scanning wavenumber.Although,it should be noted that Eq.(9)stands under the assumption that all the IR pulses at different scanning wavelength has the same Gaussian shape.If the IR linewidth changes because the laser is not necessary to have the same linewidth at different scanning wavelength,there can be additional distortion in the SFG spectrum.Amplitude can be different when the spectrum is normalized to the IR intensity with different linewidths.
Therefore,if the visible and IR pulses of the scanning SFG-VS system are both Gaussian shaped,the linewidth of the qth vibrational mode can be calculated by the Voigt function[35,36]∶
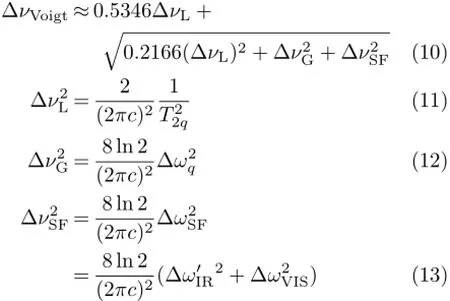
thus,it is very easy to see that the Voigt lineshape of SFG-VS spectra can be calculated by the homogeneous broadening and inhomogeneous broadening of vibrational modes,as well as the Guassian widths of both IR beam and visible beam[35,36].
III.EXPERIMENTS
The frequency-resolved picosecond SFG system was purchased from EKSPLA,Lithuanian.The setup of this laser system has been described in detail elsewhere[39].Figure 1 shows the scheme of optical parametric oscillator(OPO),optical parametric amplification(OPA)and differential frequency generation(DFG)system for the IR beam generation.Three beams,a 532 nm train beam,a 532 nm beam and a 1064 nm beam are used to generate the consecutively tunable IR beam for scanning.The 532 nm train beam(Train,87.2 MHz)is utilized for synchronously pumped OPO system to generate the seed beam with a linewidth of<0.2 nm(1.6 cm-1).The second 532 nm beam is utilized in the OPA system,to overlap with the seed beam and amplify the seed beam,which also generates the amplified Idle beam.The 1064 nm beam and the amplified Idle beam are overlapped in DFG system to generate the IR beam within the wavenumber range of 650-4000 cm-1.

FIG.1 Scheme of optical parametric oscillator(OPO),optical parametric amplification(OPA)and differential frequency generation(DFG)for the IR beam generation.
In this work,we performed several experiments to determine the linewidths of IR beams and understand the frequency resolution of current picosecond SFGVS system.Firstly,the amplified visible beams generated from OPA system within the wavelength range of 680-1064 nm were directed into the Monochromator 3504,SOLAR TII for the linewidth scan.The SFG signals of various samples of Au film,water,lipid monolayers and Parc18 monolayers were also scanned to calculate the linewidths of SFG signal and IR beam.The incident angles of visible beam and IR beam are 63◦and 52◦respectively.The structures of these molecules are shown in Fig.2.The D54-DMPE,DMPE[39]lipid monolayers,and PARC18 monolayers[48,49]were deposited on the bevel edge of the right-angle CaF2prisms at the surface pressure of 30 mN/m.And the SFG signals of water molecules at CaF2/water interface were also collected at the bevel edge of the CaF2prism.The SFG spectra of cholesterol monolayer at air/water interface were also collected to compare with the spectra reported in the literature[36].
IV.RESULTS AND DISCUSSION
A.IR linewidth calculated from OPA signal
Figure 3 shows the energy profiles of laser beams scanned by monochromator MS3504 in wavelength do-main.As seen in Fig.3,the linewidths of OPA beams are all less than 0.2 nm.The function for the linewidth of DFG process of nonresonant sample is∶

by assuming the linewidths of idle beams are the same as signal beam in OPA process,the linewidths of IR beams at various wavenumbers can be calculated by Eq.(13).Table I shows the calculation results of IR beam linewidths.As seen in the Table I,the linewidths of Idle beams are all less than 2 cm-1.And the linewidths of output IR beams are calculated to be between 1.5 and 2 cm-1.

FIG.2 Molecular sructures of D54-DMPE,DMPE,and PARC18.
B.SFG signal linewidth of nonresonant sample
To test the linewidth of IR beam of current picosecond SFG-VS system,the lineshape of SFG signals at various wavenumbers was collected.Figure 4 shows the energy profiles of SFG signals at several typical wavenumbers(same wavenumbers shown in Table I).To avoid the IR absorption of CO2in the air,the wavenumber of 2300 cm-1was chosen to perform the scanning instead of 2368 cm-1.As shown in Fig.4,the SFG signal linewidths of Au film is about 2 cm-1.The linewidths of incident IR beams at corresponding wavenumbers can be calculated by the following function∶

Table II shows the linewidths calculated from the fitting results of Fig.4.As shown in Table II,the linewidths of IR beams are about 1.5 cm-1,which is consistent with the calculation results shown in Table I.
C.SFG signal linewidths of vibrational resonant samples
Figure 5 shows the energy profile of SFG signals from several typical samples.It is interesting to see that the linewidths of SFG signals from various molecular samples are much larger than that from Au film.Unlike the nonresonant samples,such as Au films,z-cut quartz,and GaAs,the vibrational resonant samples for example monolayers and polymers will have a broadened SFG linewidth by including not only the linewidths of incident laser beams,but also the homogeneous broadening and inhomogeneous broadening of vibrational modes. Table III shows the linewidths of SFG signals calculated from the fitting results of Fig.5.Although,it is very hard to calculate both the homogeneous broadening and inhomogeneous broadening of vibrational modes from a single linewidth datum at one wavenumber point. Thus during the SFG experiments in picosecond system,scanning from wavenumber to wavenumber is required to obtain the full spectroscopic details of the vibrational resonant samples.
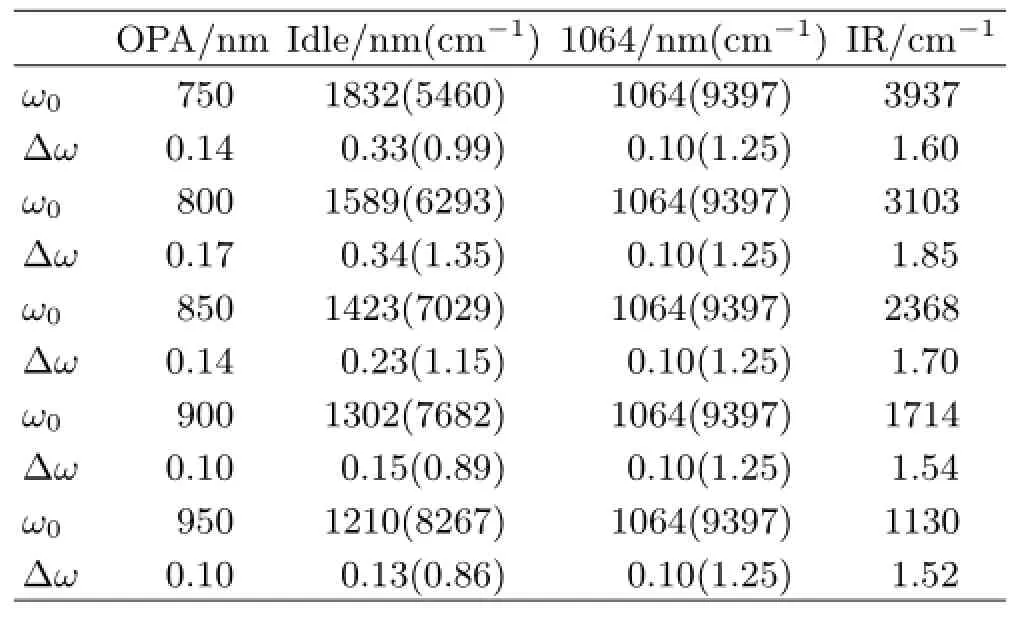
TABLE I Linewidths of Idle beams and IR beams calculated from the fitting results of Fig.3.

TABLE II Linewidths of IR beams calculated from the fitting results of Fig.4.
D.SFG spectra of cholesterol monolayer
Figure 6 shows the Isspspectra and Ipppspectra of cholesterol monolayer at air/water interface(Pi=21 mN/m).It should be noted that the scanning interval of these spectra is 2 cm-1.By comparing thespectra shown in Fig.6 with the spectra shown in the literature,it is easy to see that the spectral resolution of our SFG-VS system is better than the SFG system with 6 cm-1resolution.But several small peaks 2861.1 and 2971.6 cm-1,which are shown in Ref.[36],are still unrecognizable from Fig.6.

FIG.3 Energy profile of laser beams in wavelength domain.(a)750 nm,(b)800 nm,(c)850 nm,(d)900 nm,(e)950 nm,and laser beam at(f)1064.2 nm.

FIG.4 Energy profile of SFG signals at various wavenumber.(a)1130 cm-1,(b)1714 cm-1,(c)2300 cm-1,(d)3103 cm-1,and(e)3937 cm-1.The polarization combination are ppp.
Table IV shows the fitting parameters calculated from Isspspectra and Ipppspectra of cholesterol monolayer shown in Fig.6.As shown in Table IV,some of the fitting parameters have significant uncertainties,whichis an indication of unreliable fitting parameter due to inadequate resolution or signal noise ratios.By comparing the peak widths of cholesterol monolayer with the fitting parameters shown in Ref.[36],it can be concluded the spectral resolution of current IR scanning SFG-VS systems is about 3.5-5 cm-1.It is shown that even with the 2 cm-1scanning interval,the spectral resolution in the current IR scanning SFG is still not enough to resolve the complex spectrum with many overlapping peaks.It is also shown that higher spectral resolution of SFG-VS system and smaller scanning interval are both needed to obtain better information in IR scanning SFG-VS systems.
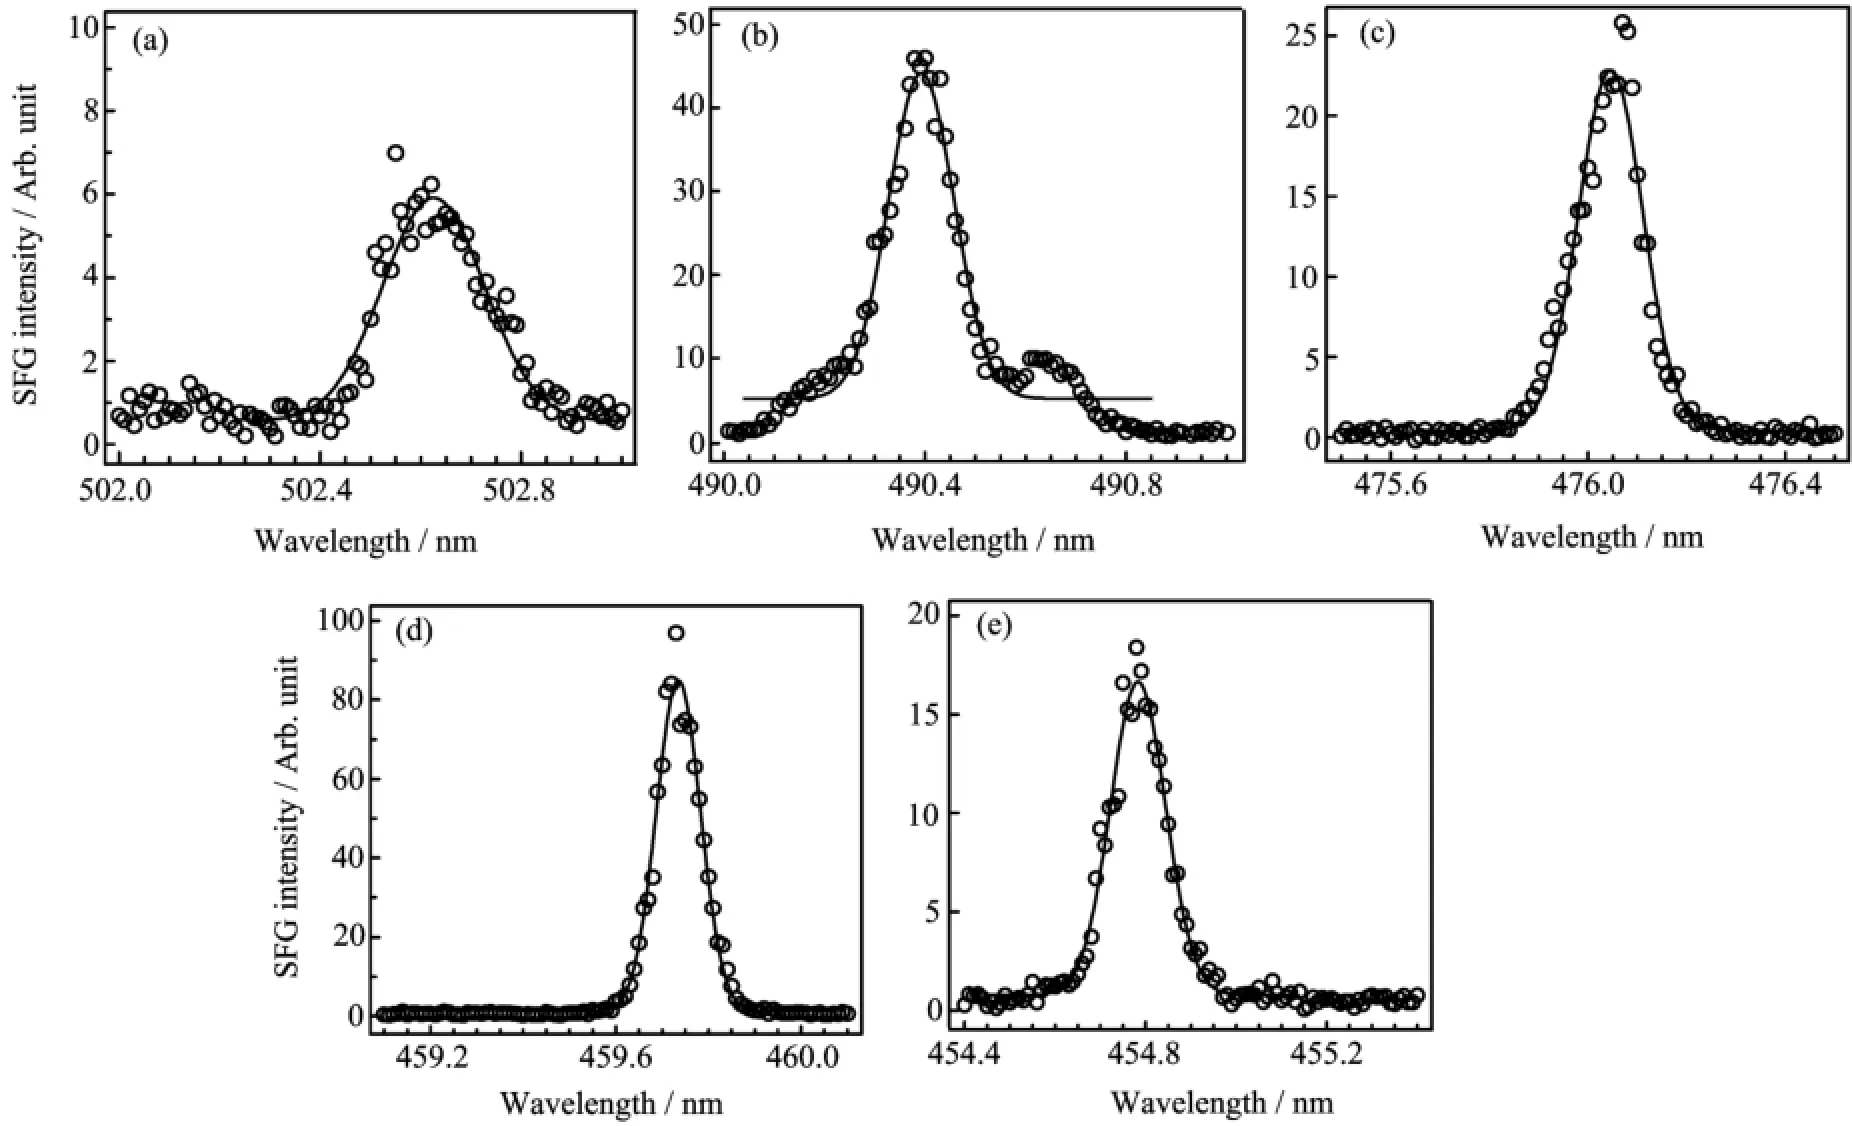
FIG.5 Energy profile of SFG signals at various wavenumber.SFG signal at(a)1105 cm-1from DMPE monolayer,(b)1600 cm-1from PARC18 monolayer,(c)2220 cm-1from D54-DMPE monolayer,(d)2965 cm-1from DMPE monolayer,and(e)3200 cm-1from water molecules.The polarization combination are ppp.
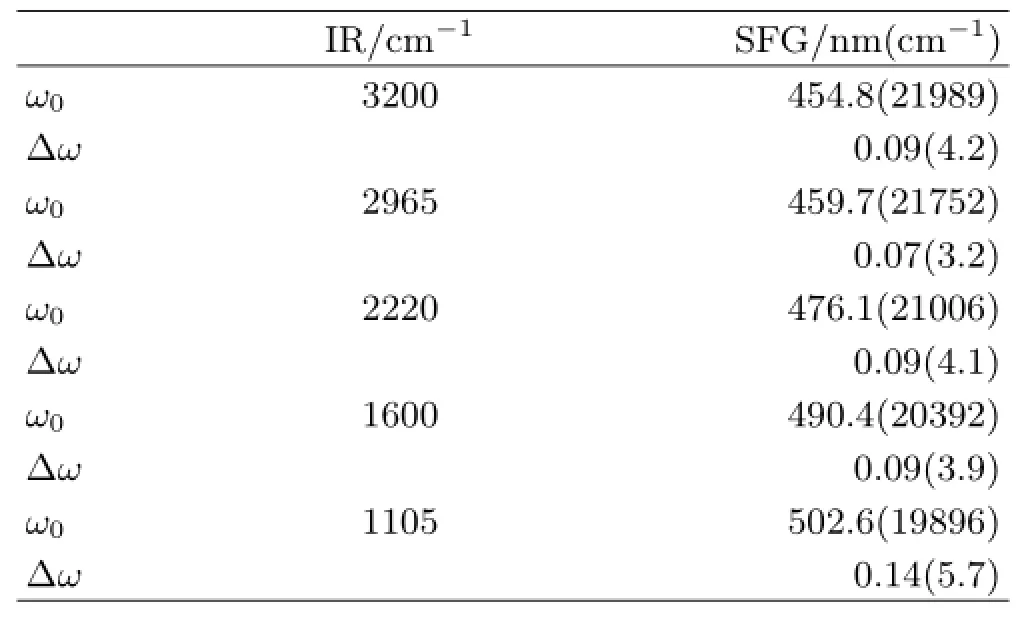
TABLE III Linewidths of SFG signals calculated from the fitting results of Fig.5.

TABLE IV Fitting parameters calculated from Isspspectra and Ipppspectra of cholesterol monolayer shown in Fig.6.
V.CONCLUSION
In this work,a function for the lineshape calculation of SFG signals has been deduced.The SFG signalsfrom various samples are also scanned to test the validity of the functions and the performance of current polarization-resolved and frequency-resolved picosecond SFG-VS system.It is shown that the linewidths of SFG signals from nonresonant samples and vibrational resonant samples conform closely the functions. And the calculated linewidths of IR beams at various wavenumbers are about 1.5Thus based on Eq.(13),the spectral resolution of current picosecond IR-scann√ing SFG-VS system can be calculated asparing the peak widths of cholesterol monolayer with the fitting parameters shown in Ref.[36],the spectral resolution is calculated to be 3.5-5,which is consistent with the spectral resolution calculated from Eq.(13).

FIG.6 SFG spectra of cholesterol monolayer at air/water interface,surface pressure of 21 mN/m.
The Eq.(13)suggests that it is more challenging for picosecond IR-scanning SFG-VS system to achieve higher resolution.The BB-SFG-VS system is of advantage in achieving higher spectral resolution because it only requires a narrow visible pulse.To achieve a spectral resolution less than 2 cm-1,each Guassian width of incident beamhas to be less than 0.6 cm-1.
These functions give clear descriptions of SFG signals generated from different samples at different situations,which may help the researchers understand the principles of lineshape calculation and analyse the SFG spectra with more accuracy.
VI.ACKNOWLEDGMENTS
This work was supported by the National Natural Science Foundation of China(No.21503093 and No.11547244)and the Doctorial Program of Jianghan University(No.1019-0610001).
[1]A.L.Harris,C.E.D.Chidsey,N.J.Levinos,and D. N.Loiacono,Chem.Phys.Lett.141,350(1987).
[2]X.D.Zhu,H.Suhr,and Y.R.Shen,Phys.Rev.B 35,3047(1987).
[3]Y.R.Shen,Nature 337,519(1989).
[4]K.B.Eisenthal,Chem.Rev.96,1343(1996).
[5]H.Arnolds and M.Bonn,Surf.Sci.Rep.65,45(2010).
[6]A.N.Bordenyuk and A.V.Benderskii,J.Chem.Phys. 122,134713(2005).
[7]H.F.Wang,W.Gan,R.Lu,Y.Rao,and B.H.Wu,Int.Rev.Phys.Chem.24,191(2005).
[8]Y.R.Shen,Annu.Rev.Phys.Chem.64,129(2013).
[9]M.Buck and M.Himmelhaus,J.Vac.Sci.Technol.A 19,2717(2001)
[10]Y.R.Shen,The Principles of Nonlinear Optics,New York:Wiley-Interscience(1984)
[11]J.P.Smith and V.Hinson-Smith,Anal.Chem.76,287A(2004)
[12]E.W.M.van der Ham,Q.H.F.Vrehen,and E.R. Eliel,Opt.Lett.21,1448(1996).
[13]L.J.Richter,T.P.Petralli-Mallow,and J.C.Stephenson,Opt.Lett.23,1594(1998).
[14]J.E.Laaser,W.Xiong,and M.T.Zanni,J.Phys. Chem.B 115,2536(2011).
[15]S.Nihonyanagi,A.Eftekhari-Bafrooei,and E.Borguet,J.Chem.Phys.134,084701(2011).
[16]X.Zhuang,P.B.Miranda,D.Kim,and Y.R.Shen,Phys.Rev.B 59,12632(1999).
[17]F.Vidal and A.Tadjeddine,Rep.Prog.Phy.68,1095(2005).
[18]I.M.Lane,D.A.King,and H.Arnolds,J.Chem.Phys. 126,024707(2007).
[19]W.Xiong,J.E.Laaser,R.D.Mehlenbacher,and M. T.Zanni,Proc.Nat.Acad.Sci.108,20902(2011).
[20]T.C.Anglin and A.M.Massari,Opt.Lett.37,1754(2012).
[21]X.Wei,S.C.Hong,X.Zhuang,T.Goto,and Y.R. Shen,Phys.Rev.E 62,5160(2000).
[22]W.Gan,D.Wu,Z.Zhang,R.R.Feng,and H.F.Wang,J.Chem.Phys.124,114705(2006).
[23]D.S.Zheng,Y.Wang,A.A.Liu,and H.F.Wang,Int. Rev.Phys.Chem.27,629(2008).
[24]F.Wei,Y.Y.Xu,Y.Guo,S.L.Liu,and H.F.Wang,Chin.J.Chem.Phys.22,592(2009).
[25]P.Guyot-Sionnest,Phys.Rev.Lett.66,1489(1991).
[26]A.L.Harris and L.Rothberg,J.Chem.Phys.94,2449(1991).
[27]J.C.Owrutsky,J.P.Culver,M.Li,Y.R.Kim,M. J.Sarisky,M.S.Yeganeh,A.G.Yodh,and R.M. Hochstrasser,J.Chem.Phys.97,4421(1992).
[28]J.P.R.Symonds,H.Arnolds,V.L.Zhang,K.Fukutani,and D.A.King,J.Chem.Phys.120,7158(2004).
[29]C.Hess,M.Wolf,S.Roke,and M.Bonn,Surf.Sci.502,304(2002).
[30]I.M.Lane,D.A.King,and H.Arnolds,J.Chem.Phys. 126,024707(2007).
[31]J.A.McGuire,W.Beck,X.Wei,and Y.R.Shen,Opt. Lett.24,1877(1999).
[32]J.A.McGuire and Y.R.Shen,J.Opt.Soc.Am.B 23,363(2006).
[33]L.Velarde,X.Y.Zhang,Z.Lu,A.G.Joly,Z.Wang,and H.F.Wang,J.Chem.Phys.135,241102(2011).
[34]L.Velarde and H.F.Wang,Chem.Phys.Lett.585,42(2013).
[35]L.Velarde and H.F.Wang,J.Chem.Phys.139,084204(2013).
[36]L.Velarde and H.F.Wang,Phys.Chem.Chem.Phys. 15,19970(2013).
[37]L.Zhang,Z.Lu,L.Velarde,L.Fu,Y.Pu,S.Y.Ding,A.J.Ragauskas,H.F.Wang,and B.Yang,Cellulose 22,1469(2015).
[38]A.L.Mifflin,L.Velarde,J.Ho,B.T.Psciuk,C.F.A. Negre,C.J.Ebben,M.A.Upshur,Z.Lu,B.L.Strick,R.J.Thomson,V.S.Batista,H.F.Wang,and F.M. Geiger,J.Phys.Chem.A 119,1292(2015).
[39]F.Wei,W.Xiong,W.Li,W.Lu,H.C.Allen,and W. Zheng,Phys.Chem.Chem.Phys.17,25114(2015).
[40]A.N.Bordenyuk,H.Jayathilake,and A.V.Benderskii,J.Phys.Chem.B 109,15941(2005).
[41]W.Xiong,J.E.Laaser,R.D.Mehlenbacher,and M.T. Zanni,Proc.Natl.Acad.Sci.USA 108,20902(2011).
[42]I.V.Stiopkin,H.D.Jayathilake,C.Weeraman,and A. V.Benderskii,J.Chem.Phys.132,234503(2010).
[43]S.Mukamel,PrinciplesofNonlinearOptical Spectroscopy,Oxford:Oxford University Press,(1995).
[44]J.C.Owrutsky,J.P.Culver,M.Li,Y.R.Kim,M. J.Sarisky,M.S.Yeganeh,A.G.Yodh,and R.M. Hochstrasser,J.Chem.Phys.97,4421(1992).
[45]H.Ueba,Prog.Surf.Sci.55,115(1997).
[46]J.E.Laaser,W.Xiong,and M.T.Zanni,J.Phys. Chem.B 115,2536(2011).
[47]P.Hamm and M.Zanni,Concepts and Methods of 2D Infrared Spectroscopy,Cambridge:Cambridge University Press,(2011).
[48]Y.Y.Xu,Y.Rao,D.S.Zheng,Y.Guo,M.H.Liu,and H.F.Wang,J.Phys.Chem.C 113,4088(2009).
[49]F.Wei and S.J.Ye,J.Phys.Chem.C 116,16553(2012).
∗Author to whom correspondence should be addressed.E-mail:weifeng@jhun.edu.cn,Tel:+86-27-84223798-205.
杂志排行

CHINESE JOURNAL OF CHEMICAL PHYSICS的其它文章
- Raman Spectra of Liquid Nitromethane under Singly Shocked Conditions
- Tunneling Electron Induced Fluorescence from Single Porphyrin Molecules Decoupled by Striped-Phase Octanethiol Self-assembled Monolayer
- Ion Product of Pure Water Characterized by Physics-Based Water Model
- Performances of Five Representative Force Fields on Gaseous Amino Acids with Different Termini
- Dynamics of Tripartite Entanglement and Intramolecular Energy in Symmetric Trimer Molecule
- Ab initio Study on Formation Mechanism of Spiro-Si-Heterocyclic Ring Compound Involving Ge from H2Ge=Si:and Formaldehyde