The effects of soil sand contents on characteristics of humic acids along soil profiles
2016-08-26XinyueDiHuiDongXianjinAnHaimingTangBaohuaXiao
Xinyue Di·Hui Dong·Xianjin An·Haiming Tang·Baohua Xiao
The effects of soil sand contents on characteristics of humic acids along soil profiles
Xinyue Di1,2·Hui Dong1,2·Xianjin An1,2·Haiming Tang1,2·Baohua Xiao1
©Science Press,Institute of Geochemistry,CAS and Springer-Verlag Berlin Heidelberg 2016
It is generally accepted that the compositions and properties of soil organic matter(SOM)are influenced by many factors.In order to reveal the effects of soil texture on characteristics and dynamics of SOM and its sub-fraction,humic acid(HA),along two soil profiles,a yellow soil profile and a purplish soil profile,under the same climate and vegetation conditions were determined.Results indicate that the decomposition and humification degrees of SOM and HA of the purplish soils are higher than those of the corresponding yellow soils indicated by A/O-A ratios of HAs,TOCs and HA yields of bulk soil samples,nevertheless,the development degree of the purplish soil is lower than that of the yellow soil.The variations of E4/E6ratios of HAs along the soil profiles indicate the overall molecular sizes of HAs decreased downward along the soil profiles. A/O-A ratios of HAs decreased downward along both the soil profiles indicate that humification processes decrease downward along both the soil profiles.Leaching of SOM shows significant effects on the distribution and characteristics of HAs in the yellow soil profile but the purplish soil profile,which is consistent with the higher hydrophobicity of HAs in purplish soils,shows that the distribution characteristics of SOM along the soil profiles are a complex result of the combination of soil texture and characteristics of SOM itself.The remarkably different sand contents are concluded tentatively as one of reasons to the different distributions and dynamics of HAs along the soil profiles,however,to profoundly understand the evolution and transport of SOM along soil profiles needs more researches.
Soil profile·Soil organic matter·Humic acid· Characteristics·Sand content
1 Introduction
Humic substance,distributed ubiquitously in water,sediment and soil,is the major component of soil organic matter(SOM),usually occupying over 80%of the SOM (Conte et al.2006;Stevenson 1994),and plays an important role in the physical and chemical properties and fertility of soil(Simpson et al.2011).Humic acid(HA)takes up an important fraction of soil humic substance.HA is thought to be more distinguishable and sensitive towards environmental changes than bulk SOM or other SOM fractions(Arshad and Schnitzer 1989;Jien et al.2011;Zech et al.1997);therefore HA has been widely used as a proxy in studying the characteristics and evolution of SOM (Buurman et al.2009;Zhang et al.2011).
The structure and composition of SOM are influenced by many factors.The decomposition of SOM is slowed in the coldandwetclimateoftheArcticecosystem(Daietal.2002;Nadelhoffer et al.1992)and is faster in tropic regions rather than in temperate regions(Bayer et al.2000;Sanchez and Logan 1992).The aromaticity of SOM is hindered in high rainfallareasduetotheleachingofligninfragments(Preston 1996).Quideau et al.(2001)suggested that the composition ofSOMislinkeddirectlywithforestvegetationtypes.Bayer et al.(2002)found that the humification degree of HA extracted from no-tillage soils was lower than that from conventional tillage soils.The influences of climate andvegetation on properties of soil HA were evaluated by several studies,and they concluded that climate is the primary factor controlling the dynamics of HA(Preston 1991,1996)and vegetation input is a minor factor influencing the characteristics of soil HA(Amalfitano et al.1995;Krosshavn etal.1990).Thepedogeneticfactorsarealsoimportanttothe structureandcompositionofSOM.Forexample,Conteetal. (2003)found that the humic matters of andic soils contained more carboxyl functional groups than those of non-andic soils due to the formation of stable complexes between humic matters and the aluminum of allophane materials;while Marinari et al.(2010)found that dynamics of FTIR characteristics of HAs along a vertisols soil profile and an alfisols soil profile were quite similar.The soil texture,including soil matrix and soil minerals,influences the stability and properties of SOM(Baldock and Skjemstad 2000;Galantini et al.2004;Schoening et al.2005;Traversa et al. 2014).It has been reported that organic materials in high sand content soils are quickly decomposed by microorganisms(Galantini et al.2004;Ladd et al.1985;Traversa et al. 2014),and that,compared to smectite dominated soils,SOMs of kaolinite and Fe-oxides dominated soils accumulate polysaccharides structures and deplete aromatic groups (Dick et al.2005;Wattel-Koekkoek et al.2001).Nevertheless,the quantitative relationships of climate,covering plant andpedogeneticfactorstothecharacteristicsofSOMremain ambiguous,and further studies are much needed.
This study systematically investigated the characteristics and distributions of SOMs and HAs along two soil profiles from the Karst area of southwest China and tentatively distinguished the role of soil texture on the characteristics and evolution of SOMs.
2 Materials and methods
2.1Soil profiles
A yellow soil and a purplish soil profile were sampled from the suburban area of Guiyang,Guizhou,China,with the straight-line distance being<12 km.The description of two sampling sites is briefed in Table 1.Both sampling sites are located on hilltops and covered by a thin layer of vegetation litter(about 3-5 cm),have the same annual mean temperature(15.3°C)and the same annual mean precipitation(1129.5 mm),and their dominant covering plants are both coniferous trees and sparse bushes.The soil samples were collected after removing the litter covering on soil surface,and three layers of soil,named as top-,middle-and bottom-layer soil,were taken along with the soil profiles.The soil samples were air dried,gently crushed to pass 2 mm sieves,and visible debris of roots and stones were picked out by hand in the laboratory and stored in the dark for later use.
2.2Soil properties
2.2.1TOC and TON
The TOC and TON contents of the soil samples were determined by an elemental analyzer(Vario ElIII,Elementar Company,Germany)following the regular procedure.Briefly,the soil sample was pretreated by an overdose HCl solution(0.5 mol/L),and the slurry stood overnight to ensure the reaction completed,then the slurry was centrifuged to remove the liquid,and the residual solid was washed by Mill-Q water till neutral and then freeze-dried. The residual solid was ground carefully and a certain amount of it was wrapped in a tin capsule and then was measured on the elemental analyzer.The measured TOC and TON values were corrected to the initial soil weight.
2.2.2Sand content
The sand content of soil was determined according to the method described elsewhere(Jastrow 1996).Briefly,a certain amount(1 g)of the soil sample was soaked overnight in thesodiumhexametaphosphatesolution[Na6(PO3)6,5 g/L],the slurry was sonicated for 1 min,and then wet sieved by a 270#sieve(<53 μm).The sand content was determined as the ratio of the dry weight of the material retained on the sieve to the dry weight of the initial soil.
Sandcontent(wt%)


Table 1 Sampling site,date and horizon depth

Table 2 Soil organic carbon (TOC)and nitrogen(TON),C/N ratio,soil sand contents(wt%),extraction yields(g·kg-1of soil),and the percentage of the ratio of organic carbon in HA fraction to the corresponding bulk soil(HAC/TOC)of the soil profiles
2.3Humic acid extraction
YHAs and PHAs are HA samples extracted exhaustively from the yellow soil and purplish soil samples,respectively,according to the procedure detailed elsewhere(Ma et al.2015).The total dry weight of each HA sample was weighed and applied to calculate the yield of HA(yHAs,g/kg dry soil)for the corresponding soil sample.
2.4HA characterizations
The ash contents of the HA samples were measured by heating the HA samples(0.5 g)in porcelain crucibles at 750°C in a muffle for 4 h.The material remained in the porcelain crucible after combustion was considered as the ashcontentoftheHAsample.TheC,H,NandOcontentsof the HA samples were measured using the same elemental analyzer and the same methods of TOC and TON measurements described above.The measured C,H,N and O contents were corrected and reported in the ash-free base.The FTIR spectra of the HA samples were recorded on Bruker VERTEX 70 FT-IR Spectrometer(Bruker Corporation,Germany)with a scanning range of 4000-400 cm-1.
The solid-state cross-polarization magic angle-spinning13C-NMR spectra of the HA samples were measured in the Hefei Institutes of Physical Science,Chinese Academy of Sciences,using a Bruker AscendTM600WB nuclear magnetic resonance spectrometer(Bruker Corporation,Germany).About 100 mg HA powder samples were filled in a 4-mm diameter ZrO2rotor with a Kel-F cap,and the13C resonant frequency and magic angle spinning frequency were set at 150.91 MHz and 8000 Hz,respectively.Recycle time and contact time were 2 s and 2 ms,respectively.Each spectrum consisted of 2400 data points and the chemical shifts were calibrated by tetramethyl silane.
The UV-Vis spectra of the HA samples were scanned by Cary 300 UV-V is spectrophotometer(Agilent Technologies,America)in quartz cuvettes(1 cm path length)at 200-800 nm.The HA solution was prepared by dissolving 5 mg HA solid sample in 100 mL 0.05 mol/L NaHCO3solution.The E4/E6ratio is the ratio of absorbance at 465 nm to that at 665 nm.
3 Results
3.1Characteristics of soils
The properties of the soil samples are listed in Table 2. The yield of HA(yHA)represented the amount(g)of HA extracted from 1 kg of the bulk soil,and HAC/TOC was the percentage of the ratio of organic carbon in HA fraction to the corresponding bulk soil.Obviously,the TOC,yHA and HAC/TOC ratios of the three soil samples from the yellow soil profile were remarkably higher than the corresponding ones from the purplish soil profile.The yHA values of both series of soil samples fell in a range of 0.04-7.90 g/kg,which is lower than those reported in the literature(2.3-15.7 g/kg)(Spaccini et al. 2006),and the HAC/TOC ratios(2.00%-20.94%)were also lower than other reports(about 20%)(Grasset and Amble`s 1998;Grasset and Ambles 1998;Schulten and Schnitzer 1997),except Y1 whose HAC/TOC ratio was 20.94.
The TOC contents and yHAs decreased downward along the soil profiles at both sites,and this may be due to the lower organic material input of deeper soil layers(Lawrence et al.2015;Qu et al.2009;Wu et al.2011).The C/N ratios decreased downward along the two soil profiles,which is in line with other studies,indicating a relative enrichment of organic N in the SOM of deeper layers(Dick et al.2005;Rumpel and Kogel-Knabner 2011).The sand contents decreased from 2.97%to 0.71%and from 46.20%to 9.08%downward along the yellow soil profile and the purplish soil profile,respectively,and this may be due to the translocation of clay particles from the top-layer to the deeper layers in the soil profile or the higher weathering intensity of the top-layer soil.The HAC/TOC ratios decrease downward along the both soil profiles,which are in line with the observation of the prior study (Alvarez-Arteaga et al.2012),suggesting the preservation and formation of HA are lower in deeper soil layer. However,the HAC/TOC ratios decreased significantly (from 20.94%to 3.02%)along the yellow soil profile but slightly(from 3.25%to 2.00%)along the purplish soil profile.
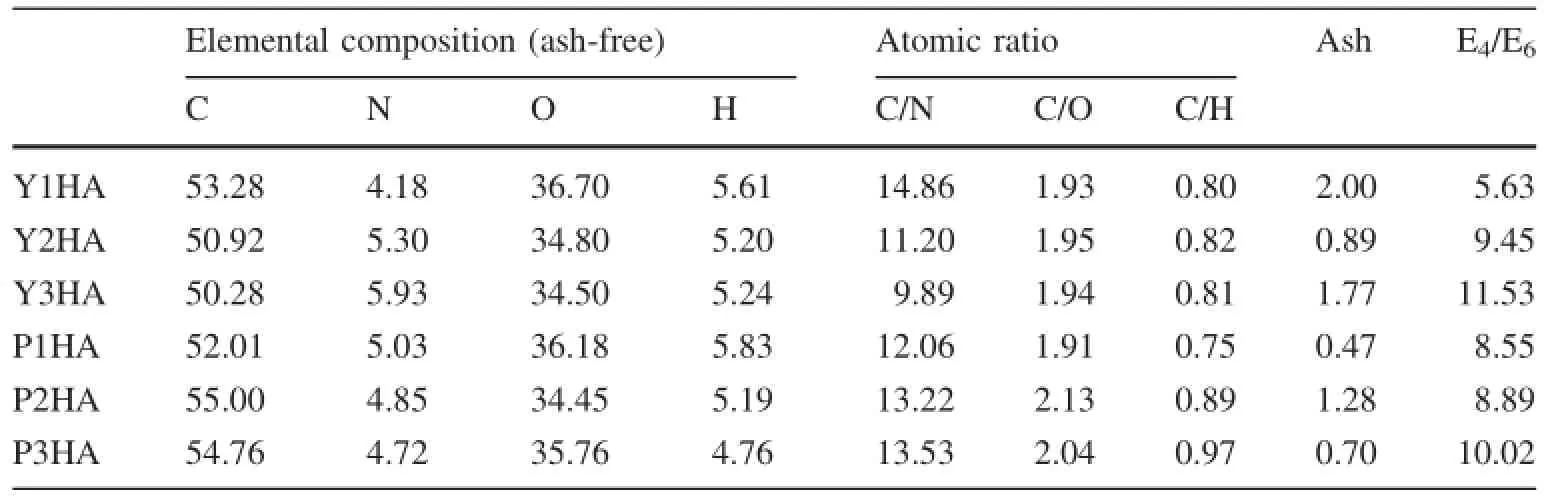
Table 3 Elemental compositions(wt%),atomic ratios,ash contents(wt%),and E4/E6ratios of HA
3.2Elemental compositions of HAs
The elemental compositions of YHAs and PHAs are listed in Table 3.In general,the carbon contents of YHAs (50.28%-53.28%)were much lower than those of PHAs (52.01%-55.00%),which suggest that the condensation or aromatic degrees of YHAs are lower than those of PHAs.The C/N ratio of Y1HA was higher than that of P1HA,however,the C/N ratios of Y2HA and Y3HA were much lower than those of corresponding P2HA and P3HA. The changes of elemental compositions along the soil profiles are different between the two sites.The C contents of YHAs decrease from 53.28%in the top-layer to 50.28%in the bottom-layer of the yellow soil profile,while the C contents of PHAs increase from the top-layer (52.01%)to the deeper-layer(about 55.00%).The N contents of YHAs increase from 4.18%to 5.93%downward along the yellow soil profile,while they decrease from 5.03%to 4.72%downward along the purplish soil profile.The C/N ratios of HAs decreased downward along the yellow soil profile(from 14.86 to 9.89),and increased along the purplish soil profile(from 12.06 to 13.53).The changes of C/N ratios along the yellow soil profile were consistent with prior reports(Abakumov et al.2010).The C/O and C/H ratios of the yellow soil HAs changed slightly along the soil profile(1.93-1.95 and 0.80-0.82,respectively),while the C/O and C/H ratio of the purplish soil HAs increased sharply downward along the soil profile (from 1.91 to 2.04 and from 0.75 to 0.97,respectively).
3.3FTIR-ATR spectroscopy of HAs
The FTIR spectra of YHAs and PHAs were shown in Fig.1.It has been known that the adsorption bands around 1040 cm-1may be attributed to the C-O asymmetric stretch vibrations of carbohydrates(Giovanela et al.2010;Kalbitz et al.1999;Peschel and Wildt 1988;Stevenson and Goh 1971).The intensities of adsorption bands around 1040 cm-1of HAs increased visibly downward along the yellow soil profile but changed slightly along purplish soil profile,suggesting the carbohydrate components of YHAs increased downward along the yellow soil profile,while changed slightly along the purplish soil profile.The adsorption bands at 2920 and 2850 cm-1are usually attributed to C-H stretch vibrations of methyl or methylene components.The intensities of adsorption bands around 2850 and 2920 cm-1of YHAs were remarkably lower than those of PHAs,suggesting the contents of methyl or methylene components in YHAs were lower than those in PHAs,which is in line with the investigation by Galantini et al.(2004),in which they found finer textured soil was less aliphatic.The intensities of adsorption bands around 2850 and 2920 cm-1of HAs decreased gradually along the yellow soil profile,and also showed an obviously drop in P3HA than those in P1HA and P2HA,suggesting the amount of methyl components or methylene components in HAs were decreased downward along the two soil profiles,which is in line with the study on the Rutigliano soil profile (Traversa et al.2014).It has been suggested that the methyl or methylene components increase,while carbohydrates decrease as the decomposition degree of SOM increase (Baldock et al.1997;Dai et al.2002);the changes of the two components along the soil profiles may suggest that the decomposition degrees of HA in the bottom-layers of the two soil profiles are lower than those of the top-layers.
The adsorption bands at 1710 cm-1were generally attributed to C=O stretch vibrations of various groups,such as carboxyl acids,carboxylates,esters,ketones,and amides.Theintensitiesofadsorptionbandsaround 1710 cm-1of HAs decreased slightly downward along the yellow soil profile but increased visibly downward along the purplish soil profile,suggesting the C=O functional groups of HAs decreased slightly downward along the yellow soil profile but increased visibly downward along the purplish soil profile.The decreased intensities of bands around 1710 cm-1downward along the purplish soil profile were in line with the study on the Vauda di Nole soil profile(Traversa et al.2014).
The adsorption bands around 1545 cm-1are usually attributed to C=N and C=C stretch vibrations in amide and pyrrole materials.The intensities of adsorption bands at 1545 cm-1of HAs increased gradually downward along yellow soil profile,suggesting amide groups of the HAs increased downward along the yellow soil profile,and thiswas in line with prior studies(Marinari et al.2010;Traversa et al.2011,2014).The intensities of adsorption bands at 1545 cm-1of HAs decreased downward along the purplish soil profile,and this may be due to the fact that the HAs of the purplish soil decomposed highly by microorganisms.The trends of amide groups along soil profiles were similar to the N contents of HAs.

Fig.1 The FTIR spectra of HAs extracted from yellow and purplish soil profiles
3.4CPMAS13C-NMR spectroscopy of HAs
The CPMAS-13C-NMR is a powerful tool for the characterization of soil HAs.Although the resonance peaks attributed to different carbon components overlap slightly,the integrated areas of carbon regions can be used for the qualitative comparison of component contents in HAs extracted from similar samples(Dick et al.2005;Quideau et al.2001;Schnitzer and Levesque 1979;Skjemstad et al. 1994).
The13C-NMR spectra of HAs extracted from two soil profiles are shown in Fig.2 and the relative proportion of different carbon components for HAs are listed in Table 4. In general,the main peaks of all HAs were around 30 ppm,which are consistent with other studies(Gonzalezvila and Lentz 1976;Hatcher et al.1980).For YHAs,the most pronounced carbon components of YHAs were O-alkyl-C components(29.67%-38.00%),and the second most abundant components were alkyl-C components(24.72%-29.19%),and this carbon distribution was same to another study(Fabbri et al.1998).In contrary to the yellow soil,the relative contents of O-alkyl-C components(27.65%-30.39%)werelowerthanthealkyl-Ccomponents (24.95%-31.97%)in PHAs,which is in line with the findings of Yang et al.(2011).As mentioned before,alkyl-CaccumulatesandO-alkyl-Cconsumesduringthe decomposition of SOM,so the A/O-A ratio was considered to be a suitable index for estimating the decomposition degree of HAs(Baldock et al.1997;Dai et al.2002).The A/O-A ratios of PHAs were higher than those of the correspondingYHAs,implyingthatthedecomposition degrees of PHAs are higher than those of the corresponding YHAs,and this was consistent with the better aeration condition in the purplish soil profile,which favors the degradation reactions of HA.However,A/O-A ratios showed decreasing trends along both profiles,which may mean that the decomposition levels of HA in the lower layers are higher than those in the upper layers of the two soil profiles,however the E4/E6data have showed that the molecular sizes of HAs decrease unanimously along two soil profiles.Therefore,the A/O-A ratio as an index of the decomposition degree of SOM should be applied with caution and restriction.
The changes of O-alkyl-C contents in HAs along soil profiles may depend on the soil types.Some previous investigators observed increases of O-alkyl-C components downward along the soil profiles(Gressel et al.1996;Preston et al.1994;Ussiri and Johnson 2003),while some others observed a significant decrease(Kogelknabner et al. 1991)or slight decrease(Preston et al.1994).This study found that O-Alkyl C contents of YHAs increased from 29.67%to 38.00%and O-Alkyl C contents of PHAs decreased from 30.39%to 27.65%downward along the two soil profiles(Table 4).The changes of the aromatic-C contents of HAs along the soil profiles depended on the soil types.The aromatic-C contents of HAs decreased downward along the yellow soil profile but increased downward along the purplish soil profile.
The ratio of Ho/Hi was introduced to indicate the hydrophobicity of HA(Spaccini et al.2006).Ho/Hi ratios of YHAs were smaller than those of the corresponding PHAs,suggesting that the hydrophobicity of YHAs waslower than that of PHAs.Ho/Hi ratios decreased downward along both soil profiles,however,the intensities of decrease were different.Ho/Hi ratios decreased significantly along yellow soil(from 1.07 to 0.79)and decreased slightly along purplish soil(from 1.09 to 1.00).
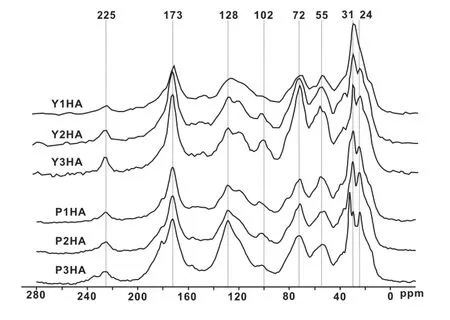
Fig.2 CPMAS13C-NMR spectra of HAs extracted from yellow and purplish soil profiles
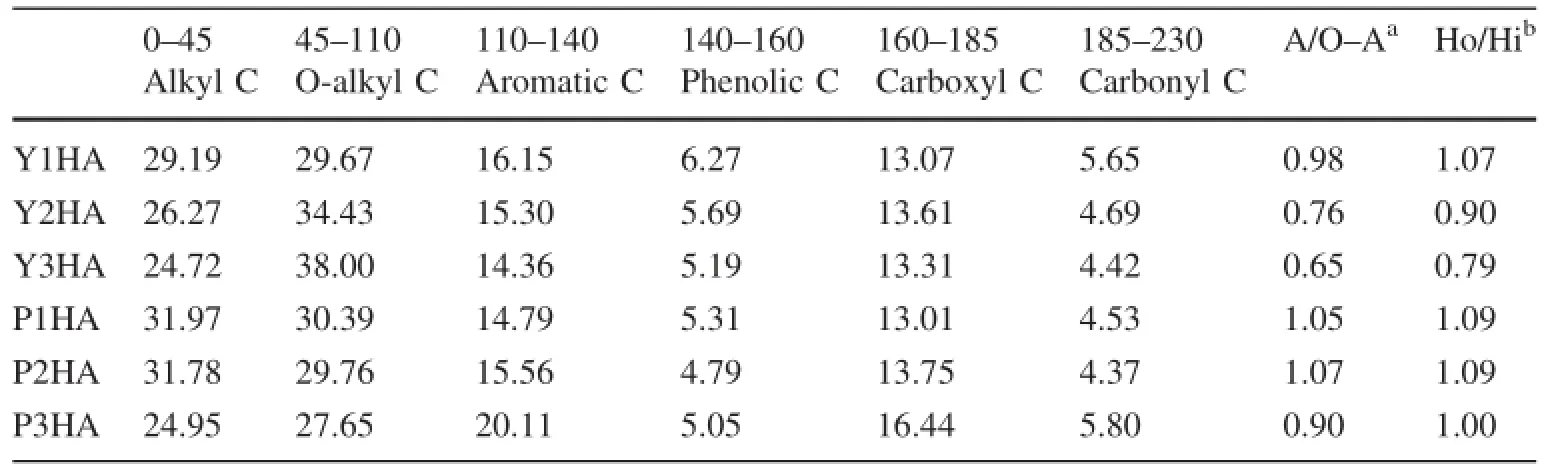
Table 4 Chemical shift of CPMAS13C-NMR spectra,relative proportion of different carbon types and relative proportion ratios for the HAs extracted from yellow and purple soils
3.5UV-Vis spectroscopy of HAs
The characteristics of HAs could also be obtained through their UV-Vis spectra.The UV-Vis spectra of HAs extracted from yellow and purplish soil profiles are shown in Fig.3.In line with other studies(Baes and Bloom 1990;Chin et al.1994;Giovanela et al.2010;Korshin et al. 1997),the absorbance values decreased in intensity consistently from 200 to 800 nm.The‘‘shoulder''peaks were observed at around 270-280 nm in all of the spectra.This may be due to the overlap of a large number of chromophorespresentinthehumiccores(Fookenand Liebezeit 2000;Giovanela et al.2010;Peuravuori and Pihlaja 1997).The absorbance intensities of PHAs in the UV region(200-400)were higher than those of YHAs,and this may suggest the aromatic degrees of PHAs were higher than those of the YHAs(Senesi et al.1996).
The E4/E6ratios of HAs were obtained by the absorbance ratios at wavelengths of 465 and 665 nm.The previous investigators concluded that the ranges of E4/E6ratio of HA extracted from the top-layer of soil profiles was 3.8-5.8(Kukkonen 1992)and 5.44-5.7(Chen et al.1977). Our results showed the range was from 5.63 to 11.53 (Table 3),which was much higher than the previous reports.The E4/E6ratio of Y1HAs was lower than that of P1HA,and this may be a result of the lower sand content of Y1 compared to that of P1.Prior investigators also found that the E4/E6ratio was greater in HA extracted from coarser textured soil(Galantini et al.2004;Traversa et al. 2014).The E4/E6ratios of HAs extracted from the two soilsobviously increased downward along the soil profile;this trend contrasted prior investigations(Traversa et al.2011;Gondar et al.2005),which observed that E4/E6ratios decreased downward along the soil profiles.The E4/E6ratios were 8.55,8.89 and 10.02 for P1HA,P2HA and P3HA,respectively.The E4/E6ratios of P1HA and P2HA were close and significantly different from that of P3HA;this variation pattern is very similar to that of the sand contents in the purplish soil profile,suggesting that the sand contents affected the E4/E6ratios and other characteristics related to the E4/E6ratios,such as decomposition degree and condensation degree.
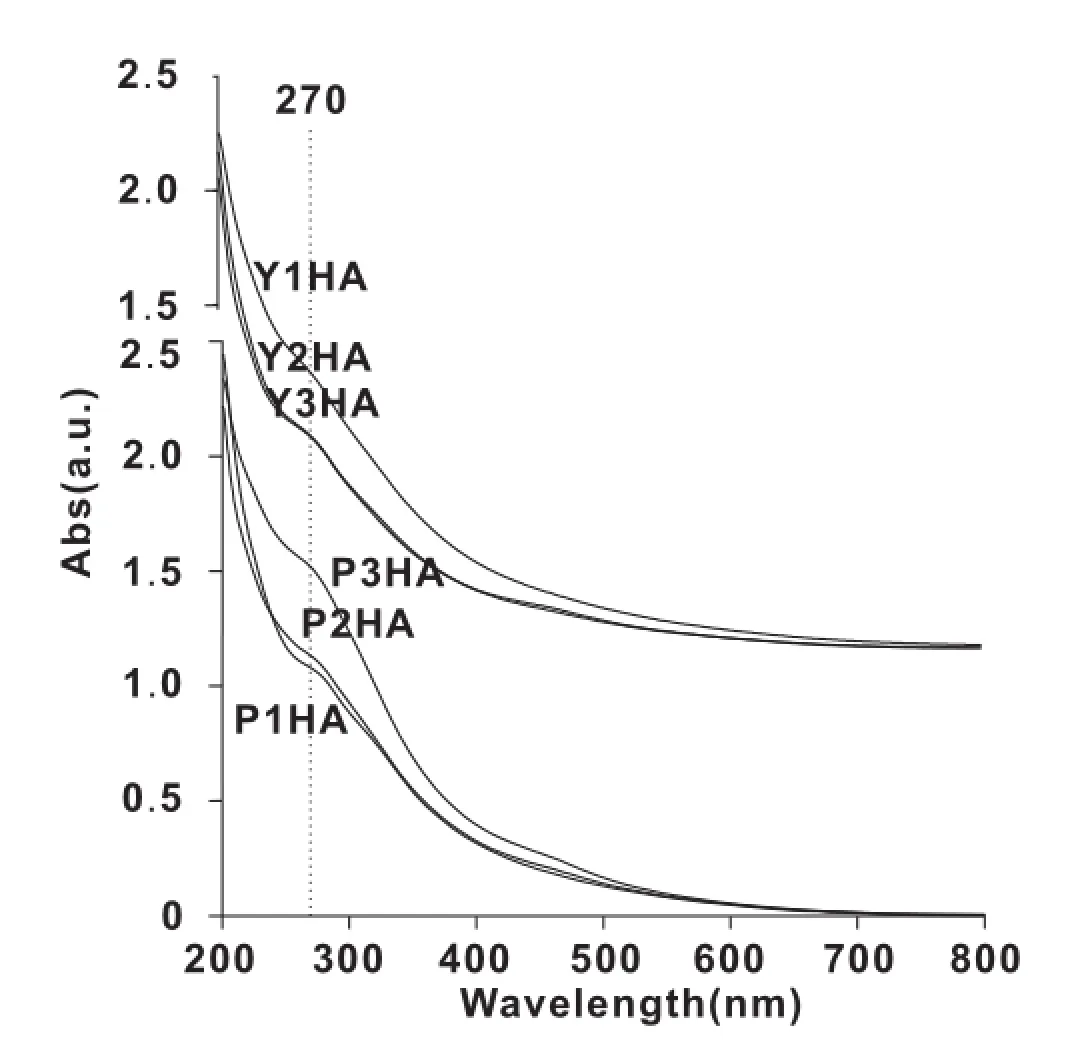
Fig.3 UV-Vis spectra of HAs extracted from yellow and purplish soil profiles
4 Discussion
The two soil profiles were sampled from one small geographic area with similar vegetation covers,however,while the climate conditions and the fresh organic residue inputs of the soil sites were similar,the compositions and dynamics of extracted HAs were found to be notably different along the two soil profiles.The different characteristics and dynamics of SOMs along the two soil profiles should be a result of the different textures of the soils.In terms of soil classification,these two soils are quite different.The yellow soil belongs to Ferralsol,a type of weathered soil with a yellow or red color from the accumulation of metal oxides,particularly iron and aluminum oxides;the purplish soil belongs to Cambisol,a type of soil with incipient soil formation and weak differentiation of soil horizons.The properties of a soil are influenced largely by its texture.In general,the mineral components of soil include sand,silt and clay,and their relative proportions determine the texture of a soil.Sand is the largest and the most stable mineral components of soil,and its content usually determines the volume of soil pores,influences the activity of organisms,and affects the characteristics of SOM(Hassink et al.1993).The sand contents of the yellow soil and purplish soil samples were remarkably different and their variation trends along the two profiles were also different(Table 2),showing negative correlations to TOCs and positive correlations to humification degree of HAs along the soil profiles,indicating that the sand content might be an important factor for the controlling characteristics and distribution of SOM in the two soil profiles.
4.1Sand content effects on characteristics of HAs of the two soils
The purplish soil samples have higher sand contents than the corresponding yellow soil samples,which might be the reason for the purplish soil sample having the much lower TOC content compared to the corresponding yellow soil sample.It has been suggested that the SOMs are decomposed quickly by microorganisms in high sand content soils (Galantini et al.2004;Ladd et al.1985;Traversa et al. 2014).The sand contents along the purplish soil profile were in the range of 9.08 wt%-46.20 wt%,which were significantly higher than those along the yellow soil profile (0.71 wt%-2.97 wt%)(Table 2).The high sand content might result in better aeration and water permeability conditions along the purplish soil profile,leading to the fast decomposition of SOM,and reducing the accumulation of SOM in soils.
The influences of sand content on SOM were also expressed in the detailed investigation of characteristics and distributions of HA along the soil profiles.As mentioned above,the two sites were covered by similar vegetation litters,which mean similar inputs of organic matter to the soil profiles.The oxidative decomposition of vegetation litters was considered to be divided into three successivestages:firstly,thelosingofcarbohydrates,including cellulose,hemicellulose and protein;subsequently,the decomposing of lignin;and finally,the losing of highly recalcitrant alkyl-C including long chain fatty acids,lipids and waxes(Baldock et al.1997).Accordingly,the alkyl-C contents of HA will increase relatively and O-alkyl-C contents of HA will decrease relatively as the decomposition processes of HA proceed.The results of FTIR-ATR and CPMAS13C-NMR showed that methyl,methylene(or alkyl-C)components were higher and carbohydrate(or O-alkyl-C)components were lower in PHAs than in corresponding YHAs,and we concluded that thedecomposition degrees of PHAs were higher than those of YHAs,especially,in the top layers of the two soil profiles. It was also supported by the E4/E6ratios of HAs from the two soil profiles,as the E4/E6ratios were 8.55 and 5.63 for P1HA and Y1HA,respectively,implying that the molecular size of P1HA was smaller than that of Y1HA.
Since the development degrees of yellow soils were higher than those of purplish soils,the ages of YHAs may be older than PHAs;however,the expectation contrasted to the results of study.The contradiction may partly be due to the fast decomposition of organic matters in the purplish soil profile caused by the well aeration of high sand content of purplish soil profile.
4.2Sand contents effects on HA dynamics along two soil profiles
Leaching has been suggested as a general way for SOM transportion along the soil profile(Kogelknabner et al. 1988).The characteristics and distribution of HA along the yellow soil profile were influenced by leaching,e.g.the hydrophobicity,indicated by the Ho/Hi ratio,of YHA decreased gradually along the soil profile;the non-polar alkyl-C components decreased gradually along the soil profile;O-alkyl-C measured by13C-NMR and carbohydrates measured by FTIR-ATR,and the relatively polar components increased gradually along the soil profile.
The sand contents are much higher along purplish soil profile than those corresponding along the yellow soil profile,so the water permeability and aeration conditions of the purplish soil profile are better and the effects of leaching on the characteristics and distribution of SOM along the purplish soil profile should be more remarkable. Figure 1 shows a remarkable increase of C=O content along the purplish soil profile but non-significant change along the yellow soil profile;this could be an evidence of strong leaching effects on the dynamics of HA along the purplish soil profile,since C=O contents,especially carboxyl groups,are polar functional groups which tend to transport with soil water and accumulate at the lower part of the soil column.However,the hydrophobicity of PHAs and components of O-alkyl-C and carbohydrate in PHAs didn't show significant changes along the purplish soil profile.This might be a result of the high decomposition of PHAs in the sandy purplish soil.The aeration condition in the sandy purplish soil profile favors the growing of microorganisms,which prefer the utilization and decomposition of carbohydrates which led to the PHAs depletion of carbohydrates(polar)and affected the transformation of HAs along the soil profile.
The characteristics of P3HA were significantly different from corresponding those of P1HA and P2HA,for instance,UV-Vis spectra(Fig.3)of P1HA and P2HA are quite similar but obviously different from that of P3HA,the carbon distributions,measured by13C-NMR(Table 4),of P1HA and P2HA are similar and significantly different from that of P3HA.The sand contents along the purplish soil profile showed a similar trend,and the sand contents of P1 and P2 were at the same level and were obviously higher than that of P3(Table 2).The highly consistent variations of sand contents and characteristics of PHAs along the purplish soil profile suggested that the sand content may play an important role in controlling the characteristics and dynamics of PHAs along the purplish soil profile.
The decomposition and humification degrees are often discussed in studying the properties and dynamics of SOM along soil profiles.The SOM formed in the superficial layer of soil were found to be more stable than those formed in deeper-layers,due to the high activity of microorganisms in superficial layer(Alvarez-Arteaga et al.2012;Orlov 1998). Similarly,we found that the decomposition and humification degrees of HA in the top-layer were higher than those in the deeper-layers of the studied soils.Many indexes could be used to calculate the decomposition and humification degrees of HAs.Firstly,the E4/E6ratio was used to indicate the humification degrees of HAs(Brunetti et al. 2012;Chen et al.1977;Giovanela et al.2010;Stevenson 1994).The E4/E6ratios of HAs increased consistently downward along the two soil profiles,indicating that the humification degrees of HA decreased downward along the soil profiles at both soil sites.Secondly,prior studies had found that Alkyl-C contents increase and O-alkyl-C contents decrease as the decomposition degree of SOM increase(Baldock et al.1997;Dai et al.2002);the higher the decomposition degree of SOMs,the larger the A/O-A ratio.The A/O-A ratio could be regarded as a sensitive index of the decomposition degree of SOM.In this study,the A/O-A ratios of HAs showed a decreasing trend downward along the soil profiles,also suggesting the decreasing trend of the decomposition degree of HAs downward along the two soil profiles.
Aromatic component contents also could be used to indicate the decomposition and humification degrees of HA.As mentioned earlier,the decomposition and humification degrees of HAs decrease downward along the two soil profiles.The variation patterns of the aromatic-C contents of HAs along the two soil profiles are completely different:aromatic-C contents of HAs decreased along the yellow soil profile but increased along the purplish soil profile(Table 4).As discussed above,the decomposition and humification degrees of HAs along the two soil profiles decrease;consequently,the inconformity of the variation patterns of the aromatic-C contents along the two soil profiles indicated a uniform decrease of the decomposition and humification degrees along the soil profiles,which maybe related to the differences of decomposition degrees of the two soils.There should be a disctinction of the decomposition stages of the SOMs when discussing the accumulation or depletion of the aromatic-C components as decomposition and humification processes.The aromatic-C components of HAs are considered to be derived from lignin(Oades 1995).The aromatic-C components accumulated as decompositions of carbohydrate,cellulose andhemicelluloseareproceeding(Baldocketal. 1992,1997;Bracewell and Robertson 1987;Hempfling et al.1987;Zech et al.1992),therefore in general,the decrease of aromatic-C component contents are suggested to be an evidence of the decrease of decomposition and humification degrees.However,as the decomposition proceeds,the aromatic-C components were also decomposed and the alkyl-C components were gradually accumulated(Baldock et al.1992).This case may occur when the easier decomposed materials,such as carbohydrate,cellulose and hemicellulose,were excessively decomposed. The high sand of purplish soil led to the fast decomposition of HAs.The HA yield values along the purplish soil profile are lower than those of the corresponding yellow soil profile,and the O-alkyl-C contents of PHAs were lower than corresponding layers of YHAs,except P1HA,which is slightly higher than that of Y1HA.As a result,the aromatic-C of HAs may be decomposed in the purplish soil,leading the aromatic-C content to decrease during the decomposition and humification process;therefore the increase of aromatic-C contents downward along the purplish soil profile may also indicate the decrease of the decomposition and humification degrees.In this way,the different patterns of the aromatic-C contents of HAs along the two soil profiles may result from the different decomposition and humification degrees of the two soil HAs,which were ultimately caused by the different sand contents.
On the basis of the above discussions,we believed that the different levels and distributions of sand contents along the two soil profiles influence the decomposition and humification of soil HAs and therefore lead to the different characteristics and distributions of HAs in the two soil sites.Nevertheless,other factors cannot be ruled out,for instance,characteristics of Fe and Al minerals,differences of soil microflora,etc.Fe and Al minerals may affect the quantity of SOM by stabilizing SOM through sorption,entrapment and complexation processes(Guggenberger and Haider 2002)and affecting the quality of SOM by differential sorption or complexation of SOM components (Dick et al.1999,2005;Parfitt et al.1999;Wattel-Koekkoek et al.2001);the activity intensity and the major types of microflora in the soil are also important influential factors of the characteristics and distributions of SOM,all of which need careful further study.
5 Conclusions
Soil texture plays a significant role in the evolution of SOM along the soil profile.Although the yellow soil profile and the purplish soil profile in this study were adjacent and covered by similar vegetation covers,their SOM components showed quite different characteristics and distribution patterns along the soil profiles:SOMs in the purplish soils showed higher decomposition and humification levels compared to those of the yellow soil,SOM contents were significantly lower in the purplish soils than in the corresponding yellow soils,and the variations of SOM characteristics and contents were diminished along the purplish soil profiles compared to along the yellow soil profile.The different characteristics and distribution patterns of SOMs along the two soil profiles were attributed,mainly,to the different sand contents of the two soils and were further reinforced by the characteristics of SOM itself.
Acknowledgments This study was financially supported by National Major Research Program of China(2013CB956702),the National Science Foundation of China(41273149,41173129),the Science Foundation of Guizhou Province(20113109)and the 100-Talent Program of CAS.
References
Abakumov E,Trubetskoj O,Demin D,Celi L,Cerli C,Trubetskaya O (2010)Humic acid characteristics in podzol soil chronosequence.Chem Ecol 26:59-66.doi:10.1080/02757540.2010. 497758
Alvarez-Arteaga G,Krasilnikov P,Garcia-Calderon NE(2012)Vertical distribution and soil organic matter composition in a montanecloudforest,Oaxaca,Mexico.EurJForRes 131:1643-1651.doi:10.1007/s10342-012-0643-4
Amalfitano C,Quezada RA,Wilson MA,Hanna JV(1995)Chemicalcomposition of humic acids-a comparison with precursor light fraction litter from different vegetations using spectroscopic techniques.SoilSci159:391-401.doi:10.1097/00010694-199506000-00004
Arshad MA,Schnitzer M(1989)Chemical characteristics of humic acids from 5 soils in Kenya.Z Pflanzena¨hr Bodenkd 152:11-16. doi:10.1002/jpln.19891520103
Baes AU,Bloom PR(1990)Fulvic-acid ultraviolet-visible spectrainfluence of solvent and pH.Soil Sci Soc Am J 54:1248-1254
Baldock JA,Skjemstad JO (2000)Role of the soil matrix and minerals in protecting natural organic materials against biological attack.Org Geochem 31:697-710.doi:10.1016/s0146-6380(00)00049-8
Baldock JA,Oades JM,Waters AG,Peng X,Vassallo AM,Wilson MA(1992)Aspects of the chemical structure of soil organic materials as revealed by solid-state13C NMR-spectroscopy. Biogeochemistry 16:1-42
Baldock JA,Oades JM,Nelson PN,Skene TM,Golchin A,Clarke P (1997)Assessing the extent of decomposition of natural organic materials using solid-state13C NMR spectroscopy.Aust J Soil Res 35:1061-1083.doi:10.1071/s97004
Bayer C,Martin-Neto L,Mielniczuk J,Ceretta CA(2000)Effect of no-till cropping systems on soil organic matter in a sandy clayloam acrisol from Southern Brazil monitored by electron spin resonance and nuclear magnetic resonance.Soil Tillage Res 53:95-104.doi:10.1016/s0167-1987(99)00088-4
Bayer C,Martin-Neto L,Mielniczuk J,Saab SD,Milori DMP,Bagnato VS(2002)Tillage and cropping system effects on soil humic acid characteristics as determined by electron spin resonanceandfluorescencespectroscopies.Geoderma 105:81-92.doi:10.1016/s0016-7061(01)00093-3
Bracewell JM,Robertson GW(1987)Characteristics of soil organicmatter in temperate soils by Curie-point pyrolysis mass-spectrometry.3.Transformations occurring in surface organic horizons. Geoderma 40:333-344.doi:10.1016/0016-7061(87)90042-5
Brunetti G,Farrag K,Plaza C,Senesi N(2012)Advanced techniques for characterization of organic matter from anaerobically digested grapemarc distillery effluents and amended soils. Environ Monit Assess 184:2079-2089.doi:10.1007/s10661-011-2101-z
Buurman P,Nierop KGJ,Kaal J,Senesi N(2009)Analytical pyrolysis and thermally assisted hydrolysis and methylation of EUROSOIL humic acid samples-a key to their source.Geoderma 150:10-22.doi:10.1016/j.geoderma.2008.12.012
Chen Y,Senesi N,Schnitzer M (1977)Information provided on humic substances by E4/E6ratios.Soil Sci Soc Am J 41:352-358
Chin YP,Aiken G,Oloughlin E(1994)Molecular-weight,polydispersity,and spectroscopic properties of aquatic humic substances.EnvironSciTechnol28:1853-1858.doi:10.1021/ es00060a015
Conte P,Spaccini R,Chiarella M,Piccolo A (2003)Chemical properties of humic substances in soils of an Italian volcanic system.Geoderma117:243-250.doi:10.1016/s0016-7061(03)00126-5
Conte P,Spaccini R,Piccolo A(2006)Advanced CPMAS-C-13 NMR techniques for molecular characterization of size-separated fractionsfromasoilhumicacid.AnalBioanalChem 386:382-390.doi:10.1007/s00216-006-0637-5
Dai XY,Ping CL,Michaelson GJ(2002)Characterizing soil organic matter in Arctic tundra soils by different analytical approaches. Org Geochem 33:407-419.doi:10.1016/s0146-6380(02)00012-8 Dick DP,Burba P,Herzog H(1999)Influence of extractant and soil type on molecular characteristics of humic substances from two Brazilian soils.J Braz Chem Soc 10:140-145
Dick DP,Gonc¸alves CN,Dalmolin RSD,Knicker H,Klamt E,Ko¨gel-Knabnerc I,Simo˜es ML,Martin-Neto L(2005)Characteristics of soil organic matter of different Brazilian ferralsols under native vegetation as a function of soil depth.Geoderma 124:319-333.doi:10.1016/j.geoderma.2004.05.008
Fabbri D,Mongardi M,Montanari L,Galletti GC,Chiavari G,Scotti R(1998)Comparison between CP/MAS13C-NMR and pyrolysis-GC/MS in the structural characterization of humins and humic acids of soil and sediments.Fresenius J Anal Chem 362:299-306.doi:10.1007/s002160051078
Fooken U,Liebezeit G(2000)Distinction of marine and terrestrial origin of humic acids in North Sea surface sediments by absorption spectroscopy.Mar Geol 164:173-181.doi:10.1016/ s0025-3227(99)00133-4
Galantini JA,Senesi N,Brunetti G,Rosell R(2004)Influence of texture on organic matter distribution and quality and nitrogen and sulphur status in semiarid Pampean grassland soils of Argentina.Geoderma 123:143-152.doi:10.1016/j.geoderma. 2004.02.008
Giovanela M,Crespo JS,Antunes M,Adametti DS,Fernandes AN,Barison A,Silva CWP,Re´gis Gue´gan,Mikael Motelica-Heino (2010)Chemical and spectroscopic characterization of humic acids extracted from the bottom sediments of a Brazilian subtropical microbasin.J Mol Struct 981:111-119.doi:10. 1016/j.molstruc.2010.07.038
Gondar D,Lopez R,Fiol S,Antelo JM,Arce F(2005)Characterization and acid-base properties of fulvic and humic acids isolated from two horizons of an ombrotrophic peat bog. Geoderma 126:367-374.doi:10.1016/j.geoderma.2004.10.006
Gonzalezvila FJ,Lentz H(1976)FT-C13 Nuclear magnetic-resonance spectra of natural humic substances.Biochem Biophys ResCommun72:1063-1070.doi:10.1016/s0006-291x(76)80240-9
Grasset L,Ambles A(1998)Structural study of soil humic acids and humin using a new preparative thermochemolysis technique. JAnalApplPyrolysis47:1-12.doi:10.1016/s0165-2370(98)00084-9
Grasset L,Amble`s A(1998)Structure of humin and humic acid from an acid soil as revealed by phase transfer catalyzed hydrolysis. Org Geochem 29:881-891.doi:10.1016/S0146-6380(98)00193-4 Gressel N,McColl JG,Preston CM,Newman RH,Powers RF(1996)Linkagesbetweenphosphorus transformationsandcarbon decomposition in a forest soil.Biogeochemistry 33:97-123. doi:10.1007/bf02181034
Guggenberger G,Haider KM (2002)Effect of mineral colloids on biogeochemical cycling of C,N,P,and S in soil.In:Huang PM,Bollag JM,Senesi N(eds)Interactions between soil particles and microorganisms,impact on the terrestrial ecosystem.Wiley,Chichester,pp 267-322
Hassink J,Bouwman LA,Zwart KB,Brussaard L(1993)Relationships between habitable pore-space,soil biota and mineralization rates in grassland soils.Soil Biol Biochem 25:47-55.doi:10. 1016/0038-0717(93)90240-c
Hatcher PG,Rowan R,Mattingly MA(1980)1H and13C NMR of marine humic acids.Org Geochem 2:77-85
Hempfling R,Ziegler F,Zech W,Schulten HR (1987)Litter decomposition and humification in acidic forest soils studied by chemical degradation,IR and NMR-spectroscopy and pyrolysis field-ionization mass-spectrometry.Z Pflanzena¨hr Bodenkd 150:179-186.doi:10.1002/jpln.19871500311
Jastrow JD (1996)Soil aggregate formation and the accrual of particulate and mineral-associated organic matter.Soil Biol Biochem 28:665-676.doi:10.1016/0038-0717(95)00159-x
Jien SH,Chen TH,Chiu CY(2011)Effects of afforestation on soil organic matter characteristics under subtropical forests with low elevation.JForRes16:275-283.doi:10.1007/s10310-010-0231-8
Kalbitz K,Geyer W,Geyer S(1999)Spectroscopic properties of dissolved humic substances-a reflection of land use history in a fen area.Biogeochemistry 47:219-238.doi:10.1007/bf00994924
Kogelknabner I,Zech W,Hatcher PG(1988)Chemical-composition oftheorganic-matterinforestsoils-thehumuslayer. ZPflanzena¨hrBodenkd151:331-340.doi:10.1002/jpln. 19881510512
Kogelknabner I,Hatcher PG,Zech W (1991)Chemical structural studies of forest soil humic acids-aromatic carbon fraction.Soil Sci Soc Am J 55:241-247
Korshin GV,Li CW,Benjamin MM(1997)Monitoring the properties of natural organic matter through UV spectroscopy:a consistent theory.WaterRes31:1787-1795.doi:10.1016/s0043-1354(97)00006-7
Krosshavn M,Bjorgum JO,Krane J,Steinnes E(1990)Chemicalstructure of terrestrial humus materials formed from different vegetation characterized by solid-state C-13 NMR with CP-MAS techniques.J Soil Sci 41:371-377
Kukkonen J(1992)Effects of lignin and chlorolignin in pulp-mill effluents on the binding and bioavailability of hydrophobic organic pollutants.Water Res 26:1523-1532.doi:10.1016/0043-1354(92)90073-d
Ladd JN,Amato M,Oades JM (1985)Decomposition of plantmaterial in Australian soils.3.Residual organic and microbial biomass-C and biomass-N from isotope-labeled legume materialand soil organic-matter,decomposing under field conditions. Aust J Soil Res 23:603-611.doi:10.1071/sr9850603
Lawrence CR,Harden JW,Xu XM,Schulz MS,Trumbore SE(2015)Long-term controls on soil organic carbon with depth and time:a case study from the Cowlitz River Chronosequence,WA,USA. Geoderma 247:73-87.doi:10.1016/j.geoderma.2015.02.005
Ma L,Xiao B,Di X,Huang W,Wang S(2015)Characteristics and distributions of humic acids in two soil profiles of the southwest ChinaKarstarea.ActaGeochim.doi:10.1007/s11631-015-0086-y
Marinari S,Dell'Abate MT,Brunetti G,Dazzi C(2010)Differences of stabilized organic carbon fractions and microbiological activity along Mediterranean vertisols and alfisols profiles. Geoderma 156:379-388.doi:10.1016/j.geoderma.2010.03.007
Nadelhoffer DJ,Giblin AE,Shaver GR,Linkins AE(1992)Microbial processes and plant nutrient availability in arctic soils.In:Chapin FSI,Jefferies RL,Reynolds JF,Shaver GR,Svoboda J,Chu EW (eds)Arctic ecosystems in a changing climate:an ecophysiological perspective.Academic,San Diego,pp 281-301
Oades JM (1995)Recent advances in organomineral interactions:implications for carbon cycling and soil structure.Environ Impact Soil Compon Interact 1:119-134
Orlov DS(1998)Organic substances of Russian soils.Eurasian Soil Sci 31:946-953
Parfitt RL,Yuan G,Theng BKG(1999)A13C-NMR study of the interactions of soil organic matter with aluminium and allophane in podzols.Eur J Soil Sci 50:695-700.doi:10.1046/j.1365-2389. 1999.00274.x
Peschel G,Wildt T (1988)Humic substances of natural and anthropogeneous origin.Water Res 22:105-108.doi:10.1016/ 0043-1354(88)90136-4
Peuravuori J,Pihlaja K (1997)Molecular size distribution and spectroscopic properties of aquatic humic substances.Anal Chim Acta 337:133-149.doi:10.1016/s0003-2670(96)00412-6
Preston C(1991)Using NMR to characterize the development of soil organic matter with varying climate and vegetation.In International Atomic Energy Agency,Food and Agriculture Organization of the United Nations(eds)Stable isotopes in plant nutrition,soil fertility and environmental studies.International Atomic Energy Agency,Vienna
Preston CM (1996)Applications of NMR to soil organic matter analysis:history and prospects.Soil Sci 161:144-166.doi:10. 1097/00010694-199603000-00002
Preston CM,Hempfling R,Schulten HR,Schnitzer M,Trofymow JA,Axelson DE(1994)Characterization of organic-matter in a forest soil of coastal british-columbia by NMR and pyrolysisfield ionization mass-spectrometry.Plant Soil 158:69-82.doi:10. 1007/bf00007919
Qu KY,Feng HM,Dai LM,Zhou L(2009)Profile distribution and storage of soil organic carbon of main forest types in eastern mountainous region of Liaoning.Chin J Soil Sci 40:1316-1320
Quideau SA,Chadwick OA,Benesi A,Graham RC,Anderson MA (2001)A direct link between forest vegetation type and soil organic matter composition.Geoderma 104:41-60.doi:10.1016/ s0016-7061(01)00055-6
Rumpel C,Kogel-Knabner I(2011)Deep soil organic matter-a key but poorly understood component of terrestrial C cycle.Plant Soil 338:143-158.doi:10.1007/s11104-010-0391-5
Sanchez PA,Logan TJ(1992)Myths and science about the chemistry and fertility of soils in the tropics.In:Lal R,Sanchez PA(eds)Myths and science of soil of the Tropics,vol 29.SSSA,Madison,pp 35-46
Schnitzer M,Levesque M(1979)Electron-spin resonance as a guide to the degree of humification of peats.Soil Sci 127:140-145. doi:10.1097/00010694-197903000-00003
Schoening I,Morgenroth G,Kogel-Knabner I(2005)O/N-alkyl and alkyl C are stabilised in fine particle size fractions of forest soils. Biogeochemistry 73:475-497.doi:10.1007/s10533-004-0897-0
Schulten HR,Schnitzer M(1997)Chemical model structures for soil organic matter and soils.Soil Sci 162:115-130.doi:10.1097/ 00010694-199702000-00005
Senesi N,Miano TM,Brunetti G(1996)Humic-like substances in organic amendments and effects on native soil humic substances. In:Piccolo A(ed)Humic substances in terrestrial ecosystems. Elsevier,Amsterdam,pp 531-593
Simpson AJ,McNally DJ,Simpson MJ(2011)NMR spectroscopy in environmental research:from molecular interactions to global processes.Prog Nucl Magn Reson Spectrosc 58:97-175.doi:10. 1016/j.pnmrs.2010.09.001
Skjemstad JO,Clarke P,Taylor JA,Oades JM,Newman RH(1994)The removal of magnetic-materials from surface soils-a solidstate C-13 CP/MAS NMR-study.Aust J Soil Res 32:1215-1229. doi:10.1071/sr9941215
Spaccini R,Mbagwu JSC,Conte P,Piccolo A(2006)Changes of humic substances characteristics from forested to cultivated soils in Ethiopia.Geoderma132:9-19.doi:10.1016/j.geoderma.2005.04.015 Stevenson FJ(1994)Humus chemistry:genesis,composition,reactions,2nd edn.Wiley,New York
Stevenson FJ,Goh KM (1971)Infrared spectra of humic acids and related substances.Geochim Cosmochim Acta 35:471.doi:10. 1016/0016-7037(71)90044-5
Traversa A,Said-Pullicino D,D'Orazio V,Gigliotti G,Senesi N (2011)Properties of humic acids in Mediterranean forest soils (Southern Italy):influence of different plant covering Eur.J For Res 130:1045-1054.doi:10.1007/s10342-011-0491-7
Traversa A,D'Orazio V,Mezzapesa GN,Bonifacio E,Farrag K,Senesi N,Brunetti G(2014)Chemical and spectroscopic characteristics of humic acids and dissolved organic matter along two alfisol profiles.Chemosphere 111:184-194.doi:10. 1016/j.chemosphere.2014.03.063
Ussiri DAN,Johnson CE(2003)Characterization of organic matter in a northern hardwood forest soil by C-13 NMR spectroscopy and chemical methods.Geoderma 111:123-149.doi:10.1016/s0016-7061(02)00257-4
Wattel-Koekkoek EJW,van Genuchten PPL,Buurman P,van Lagen B(2001)Amount and composition of clay-associated soil organic matter in a range of kaolinitic and smectitic soils. Geoderma 99:27-49.doi:10.1016/s0016-7061(00)00062-8
Wu XG,Guo JP,Yanf XY,Tian XP(2011)Soil organic carbon storage and profile inventory in the different vegetation types of Luya Mountain.Acta Ecol Sin 31:3009-3019
Yang Y,Shu L,Wang XL,Xing BS,Tao S(2011)Impact of deashing humic acid and humin on organic matter structural properties and sorption mechanisms of phenanthrene.Environ Sci Technol 45:3996-4002.doi:10.1021/es2003149
Zech W,Ziegler F,Kogelknabner I,Haumaier L(1992)Humic substances distribution and transformation in forest soils.Sci Total Environ 118:155-174
Zech W et al(1997)Factors controlling humification and mineralization of soil organic matter in the tropics.Geoderma 79:117-161.doi:10.1016/s0016-7061(97)00040-2
Zhang JJ,Hu F,Li HX,Gao Q,Song XY,Ke XK,Wang LC(2011)Effects of earthworm activity on humus composition and humic acid characteristics of soil in a maize residue amended ricewheat rotation agroecosystem.Appl Soil Ecol 51:1-8.doi:10. 1016/j.apsoil.2011.08.004
15 September 2015/Revised:23 May 2016/Accepted:17 June 2016/Published online:28 June 2016
✉ Baohua Xiao xiaobaohua@vip.skleg.cn
1State Key Laboratory of Environmental Geochemistry,Institute of Geochemistry,Chinese Academy of Sciences,Guiyang 550081,China
2Graduate University of Chinese Academy of Sciences,Beijing 100049,China
杂志排行
Acta Geochimica的其它文章
- Effects of organic acids on dissolution of Fe and Mn from weathering coal gangue
- Photosynthetic capability and Fe,Mn,Cu,and Zn contents in two Moraceae species under different phosphorus levels
- Geochemistry of Tertiary sandstones from southwest Sarawak,Malaysia:implications for provenance and tectonic setting
- Effect of pH on binding of pyrene to hydrophobic fractions of dissolved organic matter(DOM)isolated from lake water
- A hydrochemical study of the Hammam Righa geothermal waters in north-central Algeria
- Solubilization of potassium containing minerals by high temperature resistant Streptomyces sp.isolated