Quality measures of reconstruction filters for stereoscopic volume rendering
2016-07-19DavidRobertsIoannisIvrissimtziscTheAuthor206ThisarticleispublishedwithopenaccessatSpringerlinkcom
David A.T.Roberts(),Ioannis Ivrissimtzis○cThe Author(s)206.This article is published with open access at Springerlink.com
Research Article
Quality measures of reconstruction filters for stereoscopic volume rendering
David A.T.Roberts1(),Ioannis Ivrissimtzis1
○cThe Author(s)2016.This article is published with open access at Springerlink.com
AbstractIn direct volume rendering(DVR),the choice of reconstruction filter can have a significant effect on the visual appearance of the images produced and thus,on the perceived quality of a DVR rendered scene.This paper presents the results of a subjective experiment where participants stereoscopically viewed DVR rendered scenes and rated their subjective quality. The statistical analysis of the results focuses on the relationship between the quality of the stereoscopic scene and properties of the filters such as post-aliasing and smoothing,as well as the relationship between the quality of the stereoscopic scene and properties of the rendered images such as shape compactness.
The experiment evaluated five reconstruction filters on four different volumetric datasets.Participants rated the stereoscopic scenes on four quality measures: depth quality,depth layout,lack of jaggyness,and sharpness.The results show that the correlation between the quality measures and post-aliasing and smoothing,which are properties associated with each reconstruction filter,is moderate and statistically insignificant.On the other hand,the correlation between the quality measures and compactness,which is a property specific to each rendered image,is strong and statistically significant.
Keywordsdirectvolumerendering(DVR);reconstructionfilters;stereoscopic;user evaluations
1School of Engineering and Computing Sciences,Durham University,Durham,DH13LE,UK.E-mail:D A.T.Roberts,d.a.t.roberts@durham.ac.uk();I Ivrissimtzis,ioannis.ivrissimtzis@durham.ac.uk.
Manuscript received:2015-11-27;accepted:2015-12-09
1 Introduction
Volumetric data can describe 3D scenes containing . . various objects of complex shape,which could be semi-transparent and arranged in complex layouts. This can lead to conflicting depth information and can make it difficult for observers to understand the detailed layout of the objects in the scene.Several attempts have been made to aid in the understanding of depth in images produced by direct volume rendering(DVR),including the analysis of semitransparency[1,2]as well as the use of stereoscopic displays[3-5].
Reconstructionfiltersarefunctionsusedby standard DVR algorithms to interpolate between thenodesofa3Dgridofvolumetricdata. Reconstruction filters have been widely studied in their use for 2D image re-sampling[6]and volume rendering[7-11].There is a wide range of proposed reconstruction filters and the type and severity of the various types of visual artefacts they introduce into the produced images are fairly well-understood. Artefacts such as aliasing and blurring can degrade the perception of depth and thus,choosing a reconstruction filter that introduces artefacts was shown to have an effect on the results of pathsearching tasks when used with stereoscopic DVR [11].However,it is less clear how observers perceive these artefacts and how they may affect subjective measures of the quality of a stereoscopically viewed DVR rendered scene.
This paper presents an experimental study of four quality measures related to stereoscopic volume rendering:depthquality,depthlayout,lack ofjaggyness,andsharpness.Wetestedfive reconstruction filters on four different datasets,three of which were natural datasets and one was computer generated.We then analysed the results looking for relationships between the quality measure scores gathered from the participants on one hand and thesmoothing and post-aliasing of the filters and the shape compactness of the images on the other.
Analysis of the results of the experiment suggests that while perception of the quality of the scene layout is not affected by the choice of reconstruction filter,this is not the case for depth quality.That is,whilst users are able to understand the global layout of objects in the scene regardless of the choice of reconstruction filter,the perception of depth quality depends on that choice.However,when we tried to translate the statistically significant relationships between quality measure filters,into correlations between quality measures and properties of the filters,here smoothing and post-aliasing,we found such correlations to be moderate at best and statistically insignificant.On the other hand,we found that an image specific,rather than filter specific,measure of shape compactness is highly correlated with each of the quality measures.
The implication of the results is firstly that the often quoted smoothing and post-aliasing measures of reconstruction filters for DVR do not necessarily relate to how well observers will perceive the images. Therefore preferences towards reconstruction filters that exhibit high or low post-aliasing or smoothing do not guarantee any particular level of perceived quality.Measures that take into account the rendered images,such as shape compactness as used in this paper,should be preferred instead.Secondly,the shape compactness results suggest that the B-spline approximation filter should be preferred if the smoothing of the initial volumetric data caused by the use of an approximating filter can be tolerated.
We summarise the contributions of the paper as
·An experimental evaluation of stereoscopic DVR on four quality measures with our results showing that reconstruction filters affect the quality of depth.
·We show that shape compactness measured on rendered images has a stronger correlation to the quality measures assessed than the smoothing and post-aliasing properties of the reconstruction filters.
The rest of the paper is organised as follows. In Section 2,we discuss related work and the background to reconstruction filters as well as reviewingevaluationsofstereoscopicDVR.In Section 3,the compactness measure used in the analysis of the results is described.In Section 4, we detail the design of the experiment.Section 5 presents the results of the experiment and in Section 6 these are discussed.We briefly conclude in Section 7 and discuss possible future work.
2 Related work
2.1DVR
The classic approach for direct volume rendering for each pixel in the image casts a ray directed towards the volumetric data.Along this ray samples are taken of the volumetric data.As volumetric data is discrete it is necessary to interpolate the data at points away from the grid nodes.To produce values for these off-grid sample points a reconstruction filter is used.If the sample rate along the ray is at or above the Nyquist rate the sinc filter can be used for perfect reconstruction.However,the unbounded support of this filter makes it impractical in most cases.
A significant body of research has been done on the design of practical reconstruction filters.This includes a range of windowing schemes for the sinc filter to create a bounded support filter with some of the properties of perfect reconstruction[12]. Other methods use a prefilter prior to reconstruction improve the quality of the filtered data[8,13]. Further,splinebasedfiltersmaybebasedonCatmull-Rom,cubic B-splines,and BC-splines[9,14,15].
All practical filters introduce artefacts into the reconstructed image.The nature and severity of such artefacts are usually studied in the frequency domain.A filter smooths if it deviates from the ideal pass-band behaviour and produces post-aliasing if it deviates from the ideal stop-band behaviour in the frequency domain.Visually,in the final rendered images smoothing removes finer details while postaliasing introduces typical aliasing artefacts.The amount of smoothing and post-aliasing introduced by a filter can be estimated by the metrics in Ref.[9].In Fig.1(a),the engine dataset has been rendered using DVR.Figure 1(b)shows the dataset rendered with trilinear reconstruction;it shows aliasing artefacts when zoomed in.In Fig.1(c)the zoomed in area is noticeably smoother due to using the B-spline filter.
Although reconstruction filters can noticeably affect the visual appearance of DVR images there are surprisingly few studies that assess how observersperceive the differences between the filters or the artefacts produced by them.In Ref.[6]a perceptual study was undertaken to see what parameters for BC-splines cause visual artefacts of blurring,ringing,or anisotropy.In a more recent study reconstruction filters were assessed for a path-searching task in 3D [11].The results there determined that the choice of filter can have an effect on task performance,although it is not clear exactly why the filters produced different results.
2.2Quality of stereoscopic DVR
The quality of stereoscopically viewed DVR has been primarily assessed using tasks that require a participant to perform a task related to depth perception.These include the depth ordering evaluations of Refs.[1,3]where volume rendered cylinders were displayed and participants had to find their ordering,as well as the more common relative depth tasks requiring participants to find which highlighted feature is closest to themselves[16,17],and path-searching tasks[11,18].These studies give values using the task's accuracy rates to compare the quality of one rendering method or display system over another but do not give any information as to how participants perceive any visual differences.
The literature on the assessment of the perceived quality of stereoscopic DVR is more sparse.In Ref.[19]anopencommentsystemwasused for participants to remark upon the quality of different display systems used for DVR.Participants positively commented on the quality of a Fishtank display versus a standard 2D display and gave positivecommentstowardsthehighlevelsof immersion in the Cave environment.More formalised quality measures were used in Ref.[5]with a Likert scale being used to determine the comfort level,ease of viewing,and ease of understanding of features in the datasets.The results found that ease of viewing increased for stereoscopic viewing.The qualitative measures used in these studies are however secondary to the primary task-based evaluations performed.
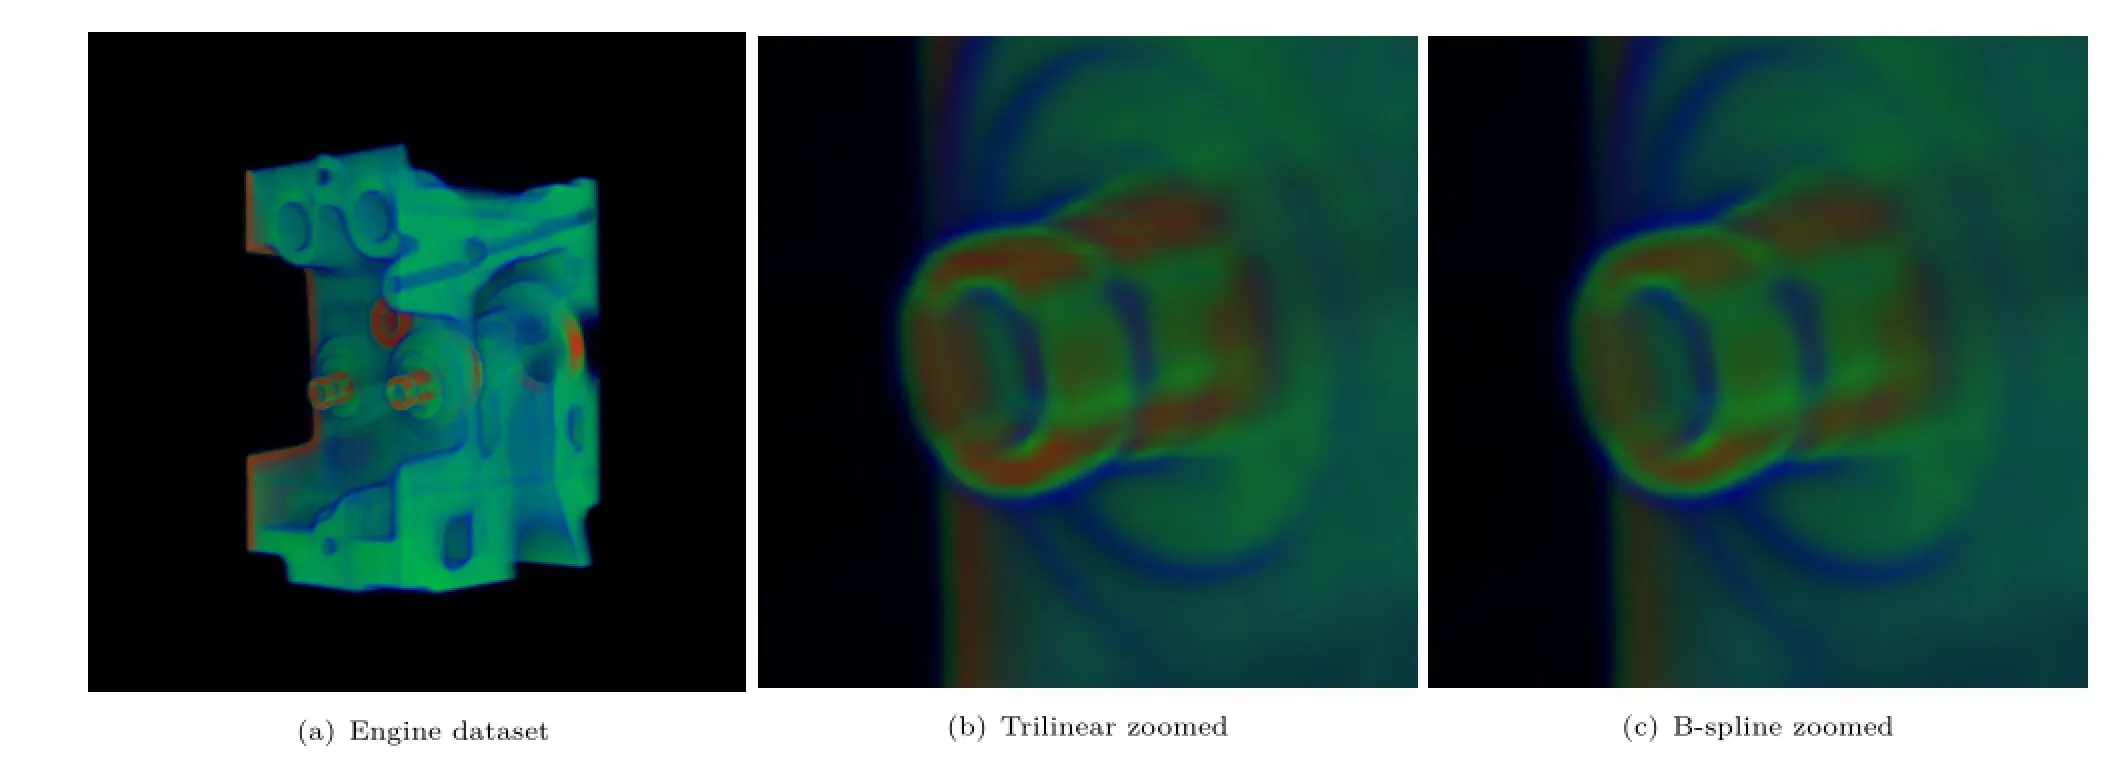
Fig.1 DVR image of an engine dataset illustrating the differences between two reconstruction filters.
3 Shape compactness
Although there are several methods for defining compactness of planar shapes,the measure used in Ref.[20]is the most widely accepted:
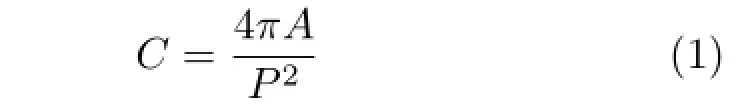
where A is the area of the shape and P its perimeter. Because of the isoperimetric inequality[21],the compactness value of a shape is always in the range(0,1].The highest value of compactness is equal to 1 and attained by a disc,while shapes with multiple branching extremities have low values of compactness that approach 0.It is scale invariant and moreover is relatively stable under the almost rigid shape deformations that are common in physical simulations.
3.1Implementation details
A simple method for calculating a compactness value for a DVR image is computing the area and perimeter of the features of the image.By applying a binary thresholding to the DVR image a silhouette of the features is produced.The area of the features is then calculated by counting the number of non-zero pixels while the perimeter is found by applying the Canny edge detection algorithm to the silhouette and counting the number of edge pixels.
Weconsideredtwomethodsofbinary thresholding:manual fine tuning for each dataset and Otsu's method[22].Figure 2 displays the results of the two thresholding methods and the corresponding edge sets returned by the Canny algorithm.Otsu's method can be seen to be more conservative than manual thresholding.In our analysis we always used Otsu's method since it is fully automatic and thus it was deemed more objective.
Obviously,the compactness values of the DVR images depend heavily on the dataset.For example,the engine dataset would most likely produce more compact images than the angiography dataset,under any reasonable choices of parameter values.On the other hand,and critically for our purposes,the choice of reconstruction filter can also significantly alter the compactness of the rendered images.For example,a filter with a significant smoothing effect can blur and eventually remove from the thresholded image the thinner branches,increasing thus the overall compactness.
4 Experimental methodology
4.1Quality measures
In the assessment of the quality of the stereoscopic volume rendered images and the properties of each reconstruction filter,four different quality measures were used.Table 1 shows the descriptions of the quality measures as given to the participants.
The first,depth quality[23],is a critical aspect of stereoscopic viewing and is dependant upon two factors:the stereoscopic image being presented as well as the hardware and viewing settings used to display it.Artefacts such as aliasing and blurring in the image can cause errors between perspective and binocular depth cues[24]and degradation of fine depth perception[25]that may lead to poor depth quality.Low display resolutions and incorrect viewing distances are typical hardware and viewing setting factors that can lead to poor quality of depth perception.
Todeterminehowreconstructionfiltersmay affect the ability to understand the organisation of the features of the scene,the second measure that was assessed is the depth layout[23].It characterises how positions and spatial features in a scene are understood.While the depth effect and perspective cues are considered more helpful than stereopsis when determining object positions and how they relate to each other[26],nevertheless,when sampling artefacts exist,stereopsis combined with linear perspective can provide conflicting depth information to the viewer[24].
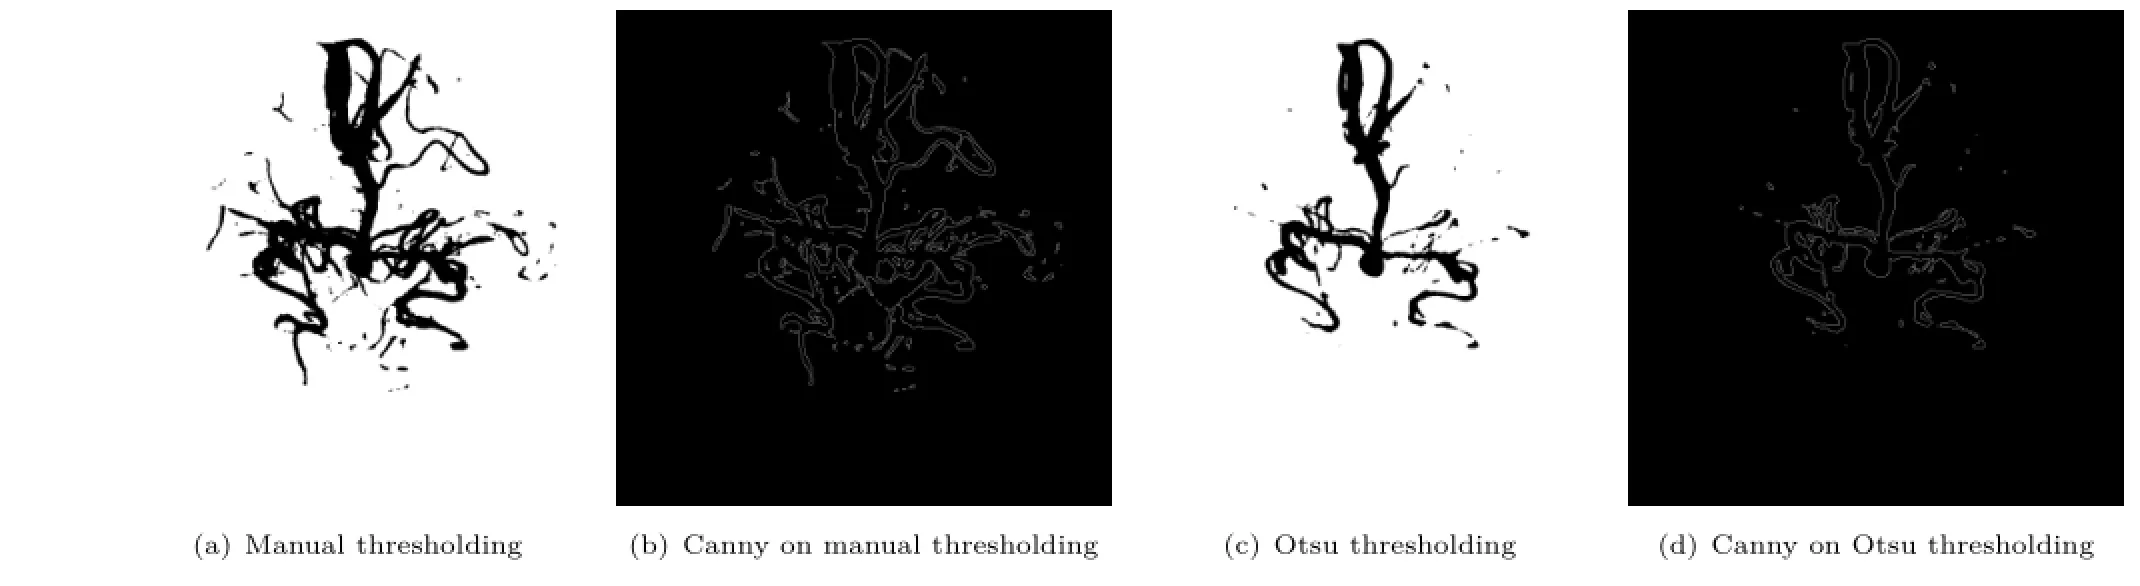
Fig.2 Thresholding of an angiography dataset using the two methods considered.
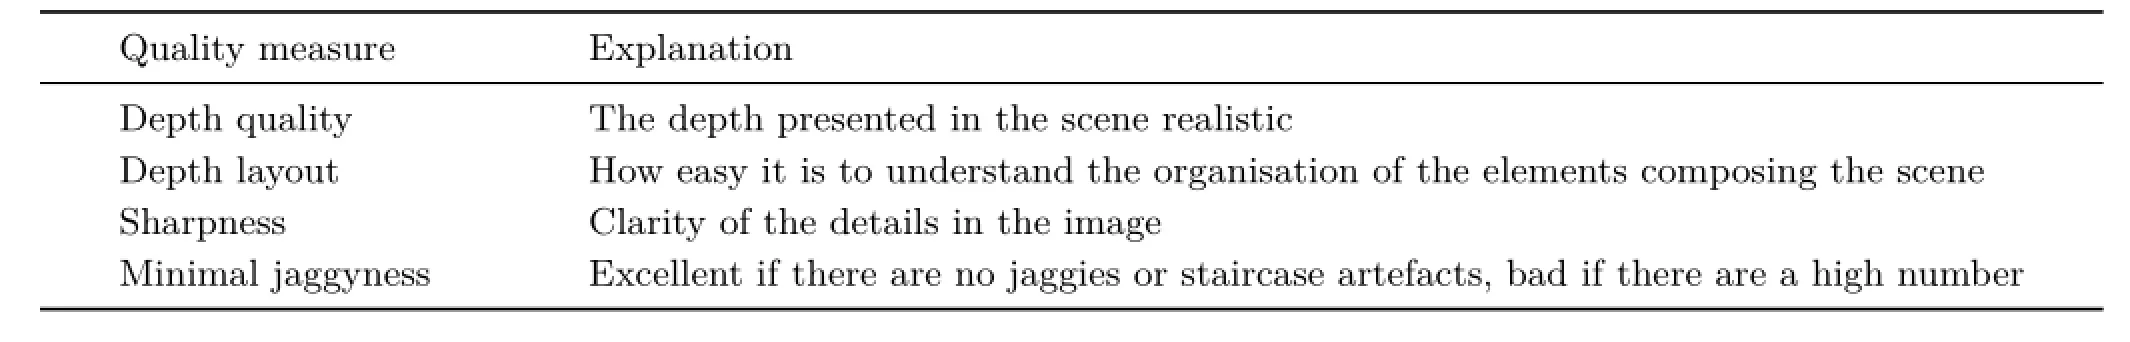
Table 1 Explanations of quality measures given to participants
The third quality measure was sharpness,which concerns the crispness of details in the stereoscopicimages presented.Previous subjective evaluation of stereoscopic images has shown no strong correlations between sharpness and depth quality,necessitating the need for the sharpness and an independent measure[27,28].
The fourth assessed quality measure assessed was minimal jaggyness.In this case low values of that measure would reflect lack of jaggy or aliasing artefacts.Increased levels of aliasing in stereoscopic images have been suggested to cause errors in disparity and conflicting depth information[24]. Further,it has been demonstrated that anti-aliasing techniques can increase the ability to perceive depth[29].One would reasonably expect that reconstruction filters with higher levels of aliasing would lead to higher jaggyness;however that had to be tested since it has been suggested that a form of binocular averaging occurs between the two eyes that decreases the overall perceived aliasing artefacts [30,31].
4.2Reconstruction filters
Five reconstruction filters were evaluated:B-spline,trilinear,Catmull-Rom,interpolating B-spline,and the Welch windowed sinc.The B-spline filter is an approximation filter and technically not a reconstruction filter,but it is included due to its common usage for noisy datasets.The trilinear filter,being built into GPUs,is the most commonly used filter in DVR.The Catmull-Rom is an interpolating spline with a balance between smoothing and postaliasing artefacts.The interpolating B-spline uses a prefilter to force the B-spline to interpolate the values at the grid nodes,at the cost of increased post-aliasing artefacts.Finally,the Welch windowed sinc is a windowed version of the sinc filter that has minimal smoothing but high post-aliasing.
Thefrequencydomainsmoothingandpostaliasing metrics of Ref.[9]measure the pass-band and stop-band behaviour,respectively.Figure 3 shows the values of the smoothing and post-aliasing metrics for the five reconstruction filters used in the experiment.
4.3Stimuli
Fourdatasetswereusedintheexperiment. Three of them,the angiography,the engine,and the visible human are natural and were created via conventional scanning processes.The volume resolutions of these datasets are(512×512×512),(256×256×256),and(128×256×256),respectively. For each dataset the transfer function that assigns colours and opacities has been chosen arbitrarily. Figures 4(a),4(b),and 4(c)show renderings of each of these datasets using the B-spline reconstruction filter.
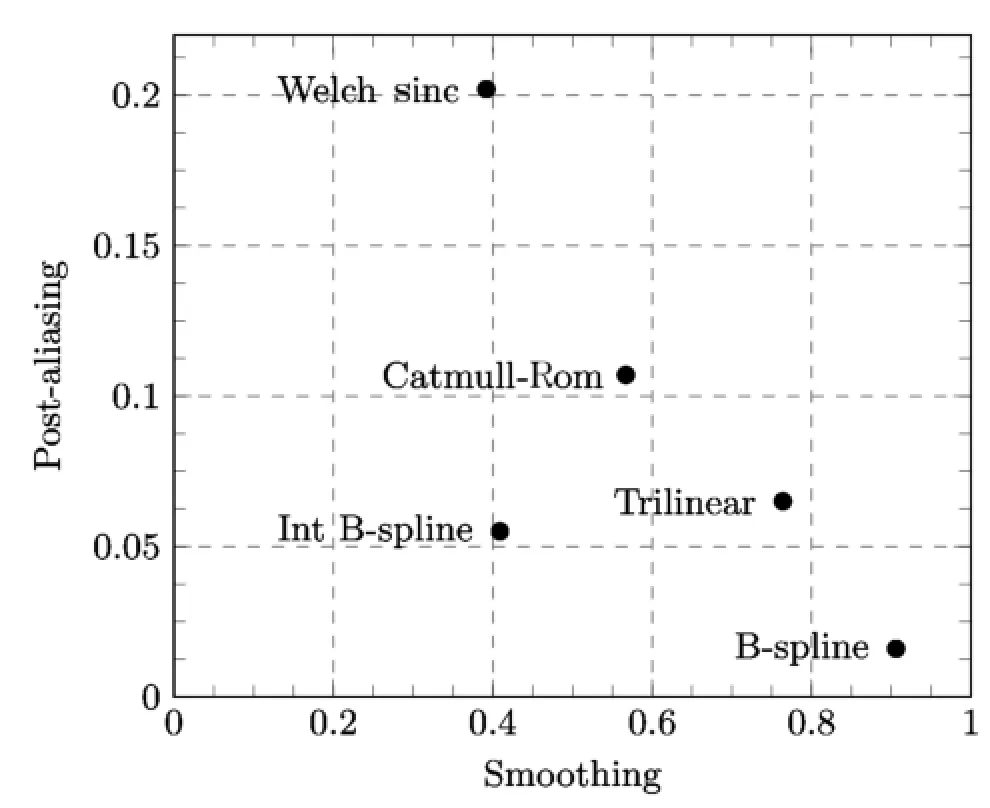
Fig.3 Marschner and Lobb smoothing and post-aliasing values for the five reconstruction filters evaluated.High values indicate high levels of smoothing or post-aliasing.
The fourth dataset,referred to as the graph,is a computer generated dataset containing a set of spherical nodes connected to other nodes via cylinders.It has been designed to encapsulate characteristics of natural datasets such as noise,branching,and complex spatial layout.The noise was introduced by modulating the volume data with a 3D Perlin noise function and the spatial structure of the graph was determined by a graph layout algorithm detailed in Ref.[26].The use of noise and graph layout algorithm produces a volume approximating the irregularities of natural datasets whilst allowing the overall complexity to be easily controlled by increasing or decreasing the number of nodes.The dataset was produced by the publicly available software vxtrl[32]at a resolution of (256×256×256).The transfer function was designed to have a degree of semi-transparency whilst still displaying clear structures.Figure 4(d)shows a rendering of the graph dataset with the B-spline filter.
4.4Equipment and viewing conditions
To display 3D images a stereoscopic True3DI 24”HD-SDI display was used with a resolution of 1920× 1200 for each eye and refresh rate of 60Hz.A 17 inch IBM LCD display,used to display the grading scales for the measurement scores,was positioned to the left of the stereoscopic display.Participants wore linear polarized glasses at all time during the experiments and were seated at a distance of 60cm from the display.All light levels were kept constant throughout the experiments.
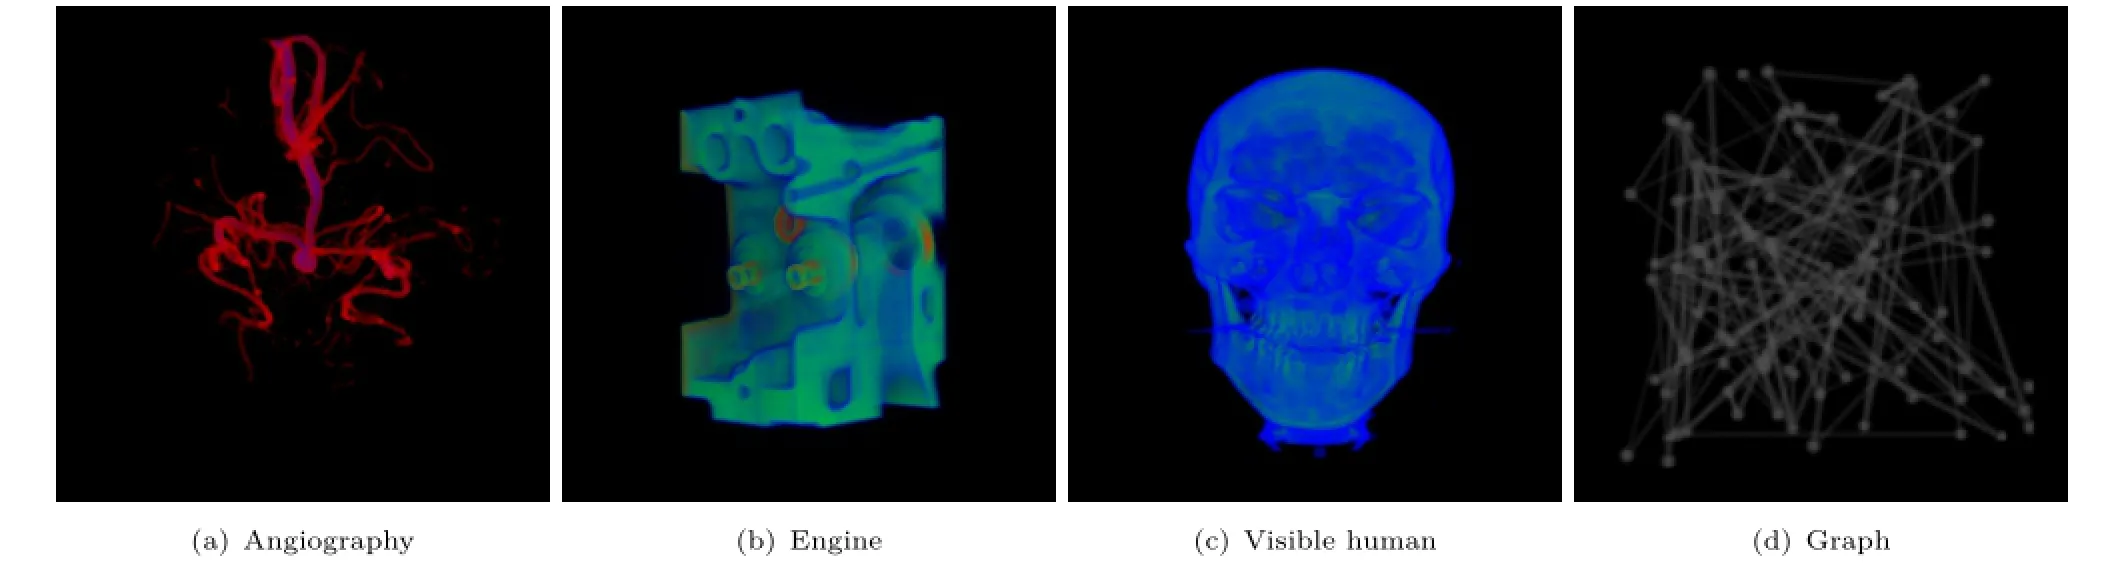
Fig.4 Example renderings of the four datasets used in the experiment.
4.5Participants
Overall,20 participants took part in the experiment;14 women and 6 men with ages ranging from 18 to 29.All participants were paid£5 for taking part in the experiment.The Bailey and Snellen chart was used to screen participants for vision and the Titmus fly stereo test was used to screen for stereo-vision. The participants of the experiment did not have prior experience with analysing volumetric datasets;howeversomewerefamiliarwithstereoscopic displays.In the literature,the choice between novice and expert participants in experiments involving the analysis of volumetric scenes is a matter still open for discussion.Although domain experts can provide highly specific results,novice participants are free of preconceived biases towards particular display methods or rendering styles[5,33].
4.6Procedure
Before the main experiment,each participant took a pretrial test where five images were displayed and rated for each of the four measurements.For the pretrial test no scores were recorded.In the main experiment,for each participant,the images of each dataset were shown as a block sequence,i.e.,there was no interleaving between datasets.The ordering of the four datasets for each participant was determined via a Latin Square design,while the ordering of the reconstruction filters for each dataset was random.
For each image in the experiment four grading scales were used,one for each of the quality measurements assessed.The sliding scales were divided into five regions labelled Excellent,Good,Fair,Poor,and Bad according to the ITU-R BT.500 recommendations[34].Each scale was continuous with values ranging from 0 to 100,which were not presented to the participant.After submitting the scores for an image,a blank screen was displayed for 3 seconds.Figure 5 shows the grading scales used for the experiment.
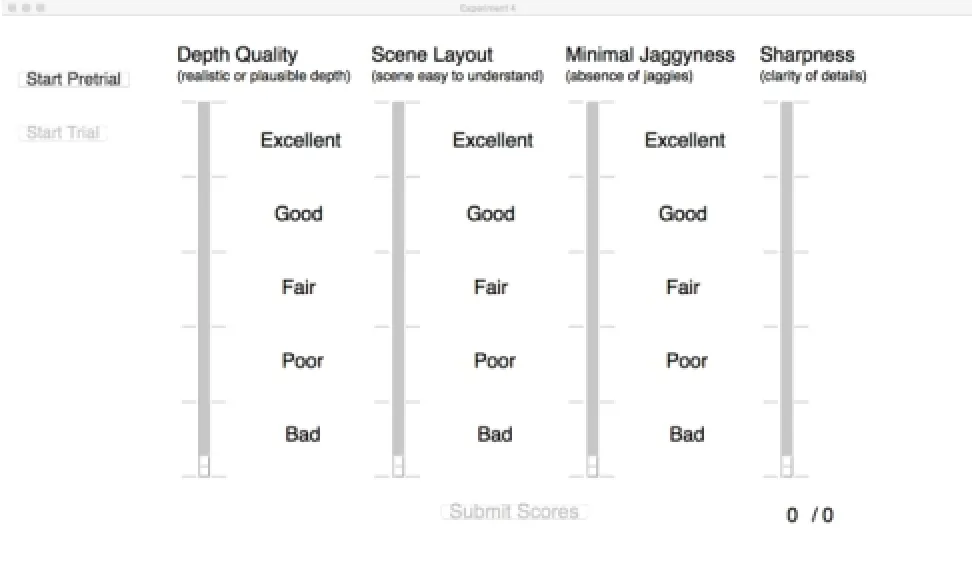
Fig.5 Grading scales used for the subjective experiment.
5 Results
Sections 5.1.1,5.1.2,5.1.3,and 5.1.4 present the statistical analysis of the results of the experiment for the angiography,engine,visible human,and graph datasets,respectively.In Section 5.2,we analyse the relationship between the smoothing and post-aliasing of the reconstruction filters and the quality scores.Finally,in Section 5.3 we analyse the relationship between the compactness of the testimages and the quality scores.
5.1Results of the experiment
Prior to performing statistical analysis of the results,the subjective scores from each participant for each measure were transformed to z-scores.This is required because not all participants used the entire range of the scales presented when rating the images,so their scores are not directly comparable.To normalize the raw scores into z-scores the values were converted into standard deviation units that represent deviations from the mean[35].Figure 6 shows the average z-score values for each dataset,quality measure,and reconstruction filter.
Following the ITU-R BT.500 recommendations,an analysis of the results per individual participant was performed prior to the main statistical analysis[34]. This was done to potentially remove participants who may have misunderstood the individual quality measures used in the experiment.The β2normality test was used for each participant and quality measure separately.The test determined that no participants should be removed prior to full analysis. For the main analysis,the z-scores for each measure per dataset were subjected to a one-way repeated measure of analysis of variance(ANOVA)with the reconstruction filter as the independent variable and the score as the dependent variable. In the cases when the assumption of sphericity failed after applying Mauchly's test of Sphericity,the Greenhouse-Geisser correction was applied.When applicable,post-hoc analysis was performed using the pairwise Bonferroni test.In reporting the results, we use the standard notation of F and p for the F-statistic and the p-value,respectively,while for the effect size we report the partial η2.
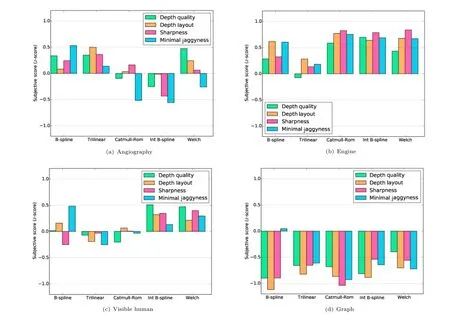
Fig.6 Plot of average z-score results.
5.1.1Angiography
The choice of reconstruction filter was found to have a significant effect on depth quality when viewing the angiography dataset.The results of the ANOVAwere F(4,76)=3.152,p=0.019,partial η2=0.142. Despite the interpolating B-spline having the lowest depth quality with a z-score of-0.253 and the Welch windowed sinc having the highest with 0.473,a post-hoc pairwise Bonferroni test revealed no significant interactions between individual pairs of reconstruction filters.
Regarding the sharpness measure,the choice of reconstruction filter was found to have a significant effectwiththeresultsoftheANOVAbeing F(4,76)=2.991,p=0.024,partial η2=0.071. Following a post-hoc Bonferroni test,significant differences were found between the trilinear(0.362)and interpolating B-spline(-0.433),p=0.044.
Significant differences were found when analysing the scores for the minimal jaggyness measure with F(4,76)=5.739,p<0.001,and partial η2=0.232. According to a post-hoc Bonferroni pairwise test,the B-spline(0.532)was significantly different from the Catmull-Rom (-0.516),p=0.008 and the interpolating B-spline(-0.559),p=0.003.
Therewasnostatisticalsignificanceof reconstruction filters on the depth layout measure for the angiography dataset.
5.1.2Engine
For the engine dataset,the choice of reconstruction filter was found to have a significant effect on depth quality.Mauchly's test of Sphericity was violated with p=0.005 and therefore the Greenhouse-Geisser correction was used.The results of the ANOVA were F(2.492,47.537)=3.284,p=0.036,partial η2=0.147.No significant interactions between pairs of reconstruction filters were found according to a post-hoc pairwise Bonferroni test.However,the trilinear filter had the lowest depth quality with an average of-0.075 and the interpolating B-spline had the highest with 0.697.
The choice of reconstruction filter was found to have a significant effect on sharpness,with the results of the ANOVA being F(4,76)=4.582,p= 0.002,partial η2=0.194.A follow-up Bonferroni test reported that the sharpness score of the B-spline filter(0.240)was significantly lower than the interpolating B-spline(0.787),p=0.025 and the Welch windowed sinc(0.836),p=0.016.
The results of ANOVA showed that there was no significant effect of the choice of reconstruction filter on depth layout or minimal jaggyness for the engine dataset.
5.1.3Visible human
A significant effect was found on depth quality withtheANOVAreportingF(4,76)=4.612,p=0.002,partial η2=0.195.Follow-up post-hoc tests revealed no significant interactions between pairs of reconstruction filters;however the Catmull-Rom filter had the lowest average with-0.204 and the interpolating B-spline had the highest with 0.508.
The ANOVA for minimal jaggyness also reported statistical significance.Sphericity had been violated withp=0.005andsotheGreenhouse-Geisser correctionwasapplied.TheANOVAresults wereF(2.678,50.883)=3.039,p=0.043,partial η2=0.138.No interactions were found between individualreconstructionfilters; howeverthe trilinear filter had the lowest average with-0.254 and the B-spline had the highest with 0.482
Thechoiceofreconstructionfilterhadno statistically significant effect on the depth layout and the sharpness scores.
5.1.4Graph
The choice of reconstruction filter was found to only have an effect on the minimal jaggyness measure with the ANOVA reporting F(4,76)=4.308,p=0.003. A Bonferroni test reported that the B-spline filter (-0.046)was significantly different from the Welch windowed sinc filter(-0.721)with p=0.013.
No significant results were reported for the depth quality,depth layout,and the sharpness measures.
5.2Correlations with smoothing and postaliasing
The smoothing and post-aliasing introduced by the reconstruction filter correspond to the blurring and aliasing of the features of the rendered images.These artefacts can degrade depth perception when viewing stereoscopic scenes[24,25].Here,we investigate whether these properties of the filters are related to how observers perceived the images by measuring the correlation between the smoothing and post-aliasing metrics on the filters proposed in Ref.[9],and the quality scores obtained from the experiment.
The smoothing and post-aliasing values for the reconstruction filters used in the experiment are shown in Fig.3.The Pearson correlation coefficients were computed to determine if a linear relationshipexists between the smoothing and post-aliasing properties and the quality scores obtained from the experiment.A summary of the results can be seen in Table 2.There were no strong correlations between either of the frequency domain metrics and the quality scores obtained.
5.3Correlations with compactness
The frequency domain metrics used to measure smoothing and post-aliasing are filter specific in that they are independent of the dataset used or images produced.As an alternative we investigated whether the image specific measure of shape compactness was correlated with the quality scores obtained.
The compactness of each image used in the experiment was computed by the method described in Section 3.We found that the compactness analysis gives very similar results when it is applied on the left images of the stereoscopic pairs,or the right images,or on combined cyclopean images.For simplicity,here we only report the analysis for the left images.The compactness measures for each of the twenty images used in the experiment can be seen in Figs.7(a)and 7(b).From the results we can see that the engine and visible human datasets have high compactness values whereas the angiography and graph datasets have low values.In all cases,the use of the B-spline approximation filter gave the highest compactness.
After computing the compactness measures for the images Pearson correlation coefficients were computed to see if a relationship exists between image compactness and the quality scores.A summary of the results is shown in Table 3.There was a moderate positive correlation between the compactness measure and the quality of depth reported by the participant,r(18)=0.475,p<0.05 with compactness statistically explaining 22.563%of the variation in depth quality.A strong correlation was found for depth layout with r(18)=0.557,p<0.05 with compactness explaining 31.025% of the variation in depth layout.Compactness was also found to have a strong correlation with lack of jaggyness with r(18)=0.605,p< 0.01,and compactness statistically explaining 36.603%of the variation in scores found.A further strong correlation was found for sharpness with r(18)= 0.510,p<0.05,and compactness explaining 26.010%of the variance in sharpness scores.
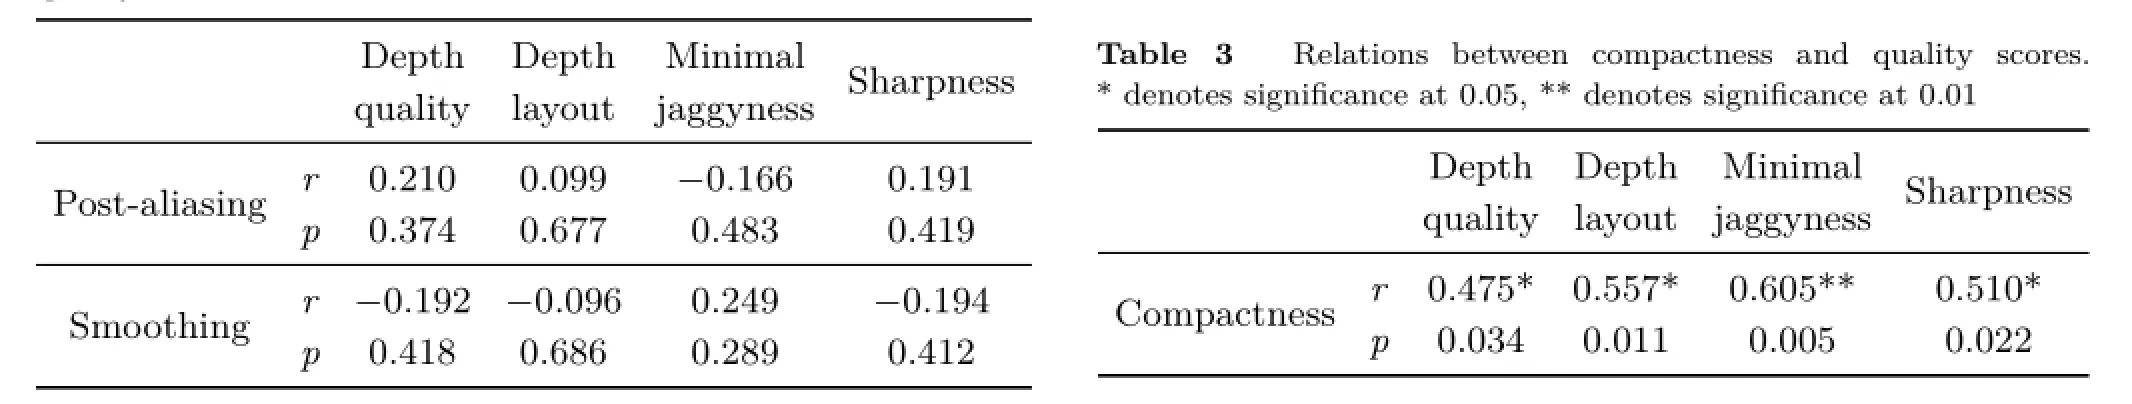
Table 2 Correlations between smoothing and post-aliasing and quality scores
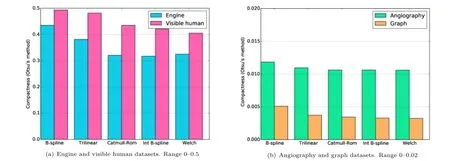
Fig.7 Plots of compactness measures split into two graphs with different scalings of the y-axis due to the polarization of the results.
6 Discussion
From the overall analysis of the results,the largest factor in the differences in quality scores is the dataset itself.The natural datasets reported higher scores for the quality measures than the computer generated dataset,implying a preference towards non-computer generated datasets.
However,in many practical situations users do not have control over the datasets they view and it is therefore a significant finding that the choice of reconstruction filter had an effect on the quality scores.Indeed,in the three natural datasets,the choice of reconstruction filter was found to have a significant effect on the depth quality.On the other hand,exactly how the choice of reconstruction filter affects depth quality is still not clear.The interpolating B-spline had the highest depth quality measure for the engine and the visible human datasets,while for the angiography dataset the interpolating B-spline had the lowest score.This suggests that some processing and analysis of the volumetric data are required before choosing the optimal reconstruction filter for viewing them.
Reconstruction filters were found to have no significant effect on the depth layout scores for any of the datasets used in the experiment.This implies that the differences in the images do not affect the general ability to understand global features in the scene.It also suggests that the perceived relationships between object positions are unaffected by the choice of reconstruction filter.
As expected from an approximating filter,the B-spline had significantly higher minimal jaggyness scores in most cases.This implies that it produces images with the fewest number of perceived aliasing artefacts,meaning that its low Marschner and Lobb post-aliasing value(see Fig.3),has visual significance.
For the angiography and engine datasets the sharpnessqualitymeasurewasaffectedby thereconstructionfilter,buttheresultsvary considerably between the datasets.This suggests that the dataset is the primary factor affecting the values of this measure.
6.1Smoothing and post-aliasing
ThePearsoncorrelationcoefficientsindicate that the smoothing and post-aliasing properties ofthereconstructionfiltershaveonlysmall correlationswiththequalitymeasures,i.e.,r coefficients in or very near the region of[0.1,0.3]. Moreover,thesemeasuredcorrelationsarenot statistically significant.This suggests that a choice of reconstruction filter based on its smoothing and post-aliasing properties alone does not guarantee any level of quality and that other dataset specific factors must be considered.
6.2Compactness
Unlikesmoothingandpost-aliasing,theshape compactness measure was found to have a strong correlation to each of the quality measures assessed in the experiment,i.e.,r coefficients in or very near the region of[0.5,1.0].In each case,a high compactness measure implies a high score for depth quality,depth layout,minimal jaggyness,and sharpness.If a choice of dataset is possible,then datasets with high compactness,such as the engine and the visible human,should be preferred.Of course,in many applications we do not choose the dataset.In such cases,the compactness values in Fig.7 show that the B-spline filter produces the highest compactness across all datasets and so should be preferred.If an approximation filter is not suitable,then according to the results the trilinear filter should be the second preference.
7 Conclusions
In this paper we have evaluated several quality measures on stereoscopic DVR images produced by various reconstruction filters.The results suggest that the choice of reconstruction filter affects the perceived quality of depth in stereoscopic DVR images but not the understanding of the layout of objects in the scene.We have found that the frequency domain measures of smoothing and postaliasing of individual filters do not correlate with any of the quality measures.Instead,a positive correlation was found between the compactness of the images and each of the quality measures,with the B-spline approximation filter producing the most compact images.
From a practical point of view,the results suggest that we cannot choose an optimal reconstruction filter using the filter specific measures of smoothness and post-aliasing.However,based on the strongcorrelationbetweenimagecompactnessand depth perception,a possible strategy for choosing reconstruction filter would be to render the dataset withseveralfilters,computethecompactness measureofeachrenderedimageand,finally,present to the viewer the image with the highest compactness.
In the future,we plan to extend the study to include both novices and expert users of DVR to see how the preferences may differ between these groups.Since transfer functions can also have a significant effect on tasks requiring depth perception [1],a second possible extension of the research presented in this paper is to study the effect of the choice of transfer function on the quality measures of stereoscopic DVR.
Acknowledgements
The visible human dataset was provided by the National Library of Medicine.The angiography andenginedatasetsarepubliclyavailableat http://www.volvis.org.
References
[1]Boucheny,C.;Bonneau,G.;Droulez,J.;Thibault,G.;Ploix,S.A perceptive evaluation of volume rendering techniques.ACM Transactions on Applied Perception Vol.5,No.4,Article No.23,2009.
[2]Zheng,L.; Wu,Y.; Ma,K.-L.Perceptually based depth-ordering enhancement for direct volume rendering.IEEE Transactions on Visualization and Computer Graphics Vol.19,No.3,446-459,2012.
[3]Cho,I.;Wartell,Z.;Dou,W.;Wang,X.;Ribarsky,W.Stereo and motion cues effect on depth perception in volumetric data.In:Proceedings of SPIE 9011,Stereoscopic Displays and Applications XXV,901118,2014.
[4]Kersten,M.Stereoscopic volume rendering of medical images.Master Thesis.Queen's University,2005.
[5]Laha,B.;Sensharma,K.;Schiffbauer,J.D.;Bowman,D.A.Effects of immersion on visual analysis of volume data.IEEE Transactions on Visualization and Computer Graphics Vol.18,No.4,597-606,2012.
[6]Mitchell,D.P.;Netravali,A.N.Reconstruction filters in computer-graphics.ACM SIGGRAPH Computer Graphics Vol.22,No.4,221-228,1988.
[7]Carlbom, I.Optimalfilterdesignforvolume reconstruction and visualization.In:Proceedings of IEEE Conference on Visualization,54-61,1993.
[8]Csebfalvi,B.Anevaluationofprefiltered reconstructionschemesforvolumerendering. IEEE Transactions on Visualization and Computer Graphics Vol.14,No.2,289-301,2008.
[9]Marschner,S.R.;Lobb,R.J.Anevaluation of reconstruction filters for volume rendering.In: Proceedings of the Conference on Visualization,100-107,1994.
[10]M¨oller,T.;Machiraju,R.;Mueller,K.;Yagel,R.Classificationandlocalerrorestimationof interpolationandderivativefiltersforvolume rendering.In:Proceedings of the Symposium on Volume Visualization,71,1996.
[11]Roberts,D.A.T.;Ivrissimtzis,I.;Holliman,N.An evaluation of reconstruction filters for a path-searching task in 3D.In:Proceedings of the 6th International Workshop on Quality of Multimedia Experience,165-170,2014.
[12]Theußl,T.;Hauser,H.;Gr¨oller,E.Mastering windows:Improving reconstruction.In:Proceedings of the IEEE symposium on Volume visualization,101-108,2000.
[13]Blu,T.;Thevenaz,P.;Unser,M.Linear interpolation revitalized.IEEE Transactions on Image Processing Vol.13,No.5,710-719,2004.
[14]Hou,H.S.;Andrews,H.Cubic splines for image interpolation and digital filtering.IEEE Transactions on Acoustics,Speech and Signal Processing Vol.26,No.6,508-517,1978.
[15]Keys,R.Cubic convolution interpolation for digital image processing.IEEE Transactions on Acoustics,Speech and Signal Processing Vol.29,No.6,1153-1160,1981.
[16]Kersten-Oertel,M.;Chen,S.-J.;Collin,D.L.An evaluation of depth enhancing perceptual cues for vascular volume visualization in neurosurgery.IEEE Transactions on Visualization and Computer Graphics Vol.20,No.3,391-403,2014.
[17]Ropinski,T.;Steinicke,F.;Hinrichs,K.Visually supporting depth perception in angiography imaging. In:Lecture Notes in Computer Science,Vol.4073. Butz,A.;Fisher,B.;Kr¨uger,A.;Olivier,P.Eds. Springer Berlin Heidelberg,93-104,2006.
[18]Agus,M.;Bettio,F.;Giachetti,A.;Gobbetti,E.;Guiti´an,J.A.I.;Marton,F.;Nilsson,J.;Pintore,G. An interactive 3D medical visualization system based on a light field display.The Visual Computer Vol.25,No.9,883-893,2009.
[19]Prabhat;Forsberg,A.;Katzourin,M.;Wharton,K.;Slater,M.A comparative study of desktop,fishtank,and cave systems for the exploration of volume rendered confocal data sets.IEEE Transactions on Visualization and Computer Graphics Vol.14,No.3,551-563,2008.
[20]Li,W.;Goodchild,M.F.;Church,R.An efficient measure of compactness for two-dimensional shapes anditsapplicationinregionalizationproblems. International Journal of Geographical Information Science Vol.27,No.6,1227-1250,2013.
[21]Osserman,R.The isoperimetric inequality.Bulletin of the American Mathematical Society Vol.84,No.6,1182-1239,1978.
[22]Otsu,N.A threshold selection method from gray-level histograms.IEEE Transactions on Systems,Man and Cybernetics Vol.9,No.1,62-66,1979.
[23]Lebreton,P.;Raake,A.;Barkowsky,M.;Le Callet,P. Evaluating depth perception of 3D stereoscopic videos. IEEE Journal of Selected Topics in Signal Processing Vol.6,No.6,710-720,2012.
[24]Pfautz,J.D.Depth perception in computer graphics. Ph.D.Thesis.University of Cambridge,2000.
[25]Costa,M.F.;Moreira,S.M.C.F.;Hamer,R.D.;Ventura,D.F.Effects of age and optical blur on real depth stereoacuity.Ophthalmic and Physiological Optics Vol.30,No.5,660-666,2010.
[26]Ware, C.; Franck, G.Evaluatingstereoand motion cues for visualizing information nets in three dimensions.ACM Transactions on Graphics Vol.15,No.2,121-140,1996.
[27]Seuntiens,P.;Meesters,L.;Ijsselsteijn,W.Perceived quality of compressed stereoscopic images:Effects of symmetric and asymmetric JPEG coding and camera separation.ACM Transactions on Applied Perception Vol.3,No.2,95-109,2006.
[28]Tam,W.J.;Stelmach,L.B.;Corriveau,P.J. Psychovisual aspects of viewing stereoscopic video sequences.In:Proceedings of SPIE 3295,Stereoscopic Displays and Virtual Reality Systems V,226,1998.
[29]J¨a¨a-Aro,K.-M.;Kjelldahl,L.Effectsofimage resolution on depth perception in stereo and nonstereo images.In:Proceedings of SPIE 3012,Stereoscopic Displays and Virtual Reality Systems IV,319,1997.
[30]Hancock,D.Distributedvolumerenderingand stereoscopicdisplayforradiotherapytreatment planning.Ph.D.Thesis.University of Manchester,2001.
[31]Reinhart, W.F.Gray-scalerequirementsfor anti-aliasingofstereoscopicgraphicimagery.In: Proceedings of SPIE 1669,Stereoscopic Displays and Applications III,90,1992.
[32]Novotny,P.;Dimitrov,L.I.;Sramek,M.Enhanced voxelization and representation of objects with sharp details in truncated distance fields.IEEE Transactions on Visualization and Computer Graphics Vol.16,No. 3,484-498,2010.
[33]Laha,B.;Bowman,D.;Socha,J.J.Effects of VR system fidelity on analyzing isosurface visualization of volume datasets.IEEE Transactions on Visualization and Computer Graphics Vol.20,No.4,513-522,2014.
[34]RecommendationITU-RBT.500-11.Methodology forthesubjectiveassessmentofthequalityof television pictures.Technical Report,1998.Available athttps://www.itu.int/dms pubrec/itu-r/rec/bt/RREC-BT.500-11-200206-S!PDF-E.pdf.
[35]Van Dijk,A.M.;Martens,J.-B.;Watson,A.B. Quality assessment of coded images using numerical category scaling.In:Proceedings of SPIE 2451,Advanced Image and Video Communications and Storage Technologies,90,1995.

David A.T.Roberts is a Ph.D. candidate at the School of Engineering and Computing Sciences at Durham University,UK.His research interests includedirectvolumerendering,stereoscopic displays,image processing,and 3D modelling.

IoannisIvrissimtzisisalecturer attheSchoolofEngineeringand ComputingSciencesatDurham University,UK.Hisresearch interests include stereoscopic volume rendering,subdivision surfaces,surface reconstruction from unorganised point sets,and machine learning applications in computer graphics problems.
Open AccessThe articles published in this journal aredistributedunderthetermsoftheCreative CommonsAttribution4.0InternationalLicense (http://creativecommons.org/licenses/by/4.0/),which permits unrestricted use,distribution,and reproduction in any medium,provided you give appropriate credit to the original author(s)and the source,provide a link to the Creative Commons license,and indicate if changes were made.
Other papers from this open access journal are available free of charge from http://www.springer.com/journal/41095. To submit a manuscript,please go to https://www. editorialmanager.com/cvmj.
杂志排行

Computational Visual Media的其它文章
- Saliency guided local and global descriptors for effective action recognition
- An interactive approach for functional prototype recovery from a single RGBD image
- Decoding and calibration method on focused plenoptic camera
- VoxLink-Combining sparse volumetric data and geometry for efficient rendering
- High-resolution images based on directional fusion of gradient
- Comfort-driven disparity adjustment for stereoscopic video