Study on Internal Information of the Two-Layered Tissue by Optimizing the Detection Position
2016-07-12LIUYanYANGXueZHAOJingLIGangLINLing
LIU Yan, YANG Xue, ZHAO Jing, LI Gang, LIN Ling*
1. State Key Laboratory of Precision Measuring Technology and Instruments, Tianjin University, Tianjin 300072, China
2. Tianjin Key Laboratory of Biomedical Detecting Techniques & Instruments, Tianjin University, Tianjin 300072, China
3. School of Chinese Medicine Engineering, Tianjin University of Traditional Chinese Medicine, Tianjin 300193, China
Study on Internal Information of the Two-Layered Tissue by Optimizing the Detection Position
LIU Yan1,2, YANG Xue1,2, ZHAO Jing3, LI Gang1,2, LIN Ling1,2*
1. State Key Laboratory of Precision Measuring Technology and Instruments, Tianjin University, Tianjin 300072, China
2. Tianjin Key Laboratory of Biomedical Detecting Techniques & Instruments, Tianjin University, Tianjin 300072, China
3. School of Chinese Medicine Engineering, Tianjin University of Traditional Chinese Medicine, Tianjin 300193, China
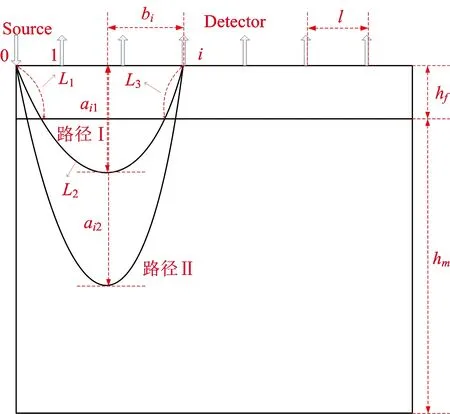
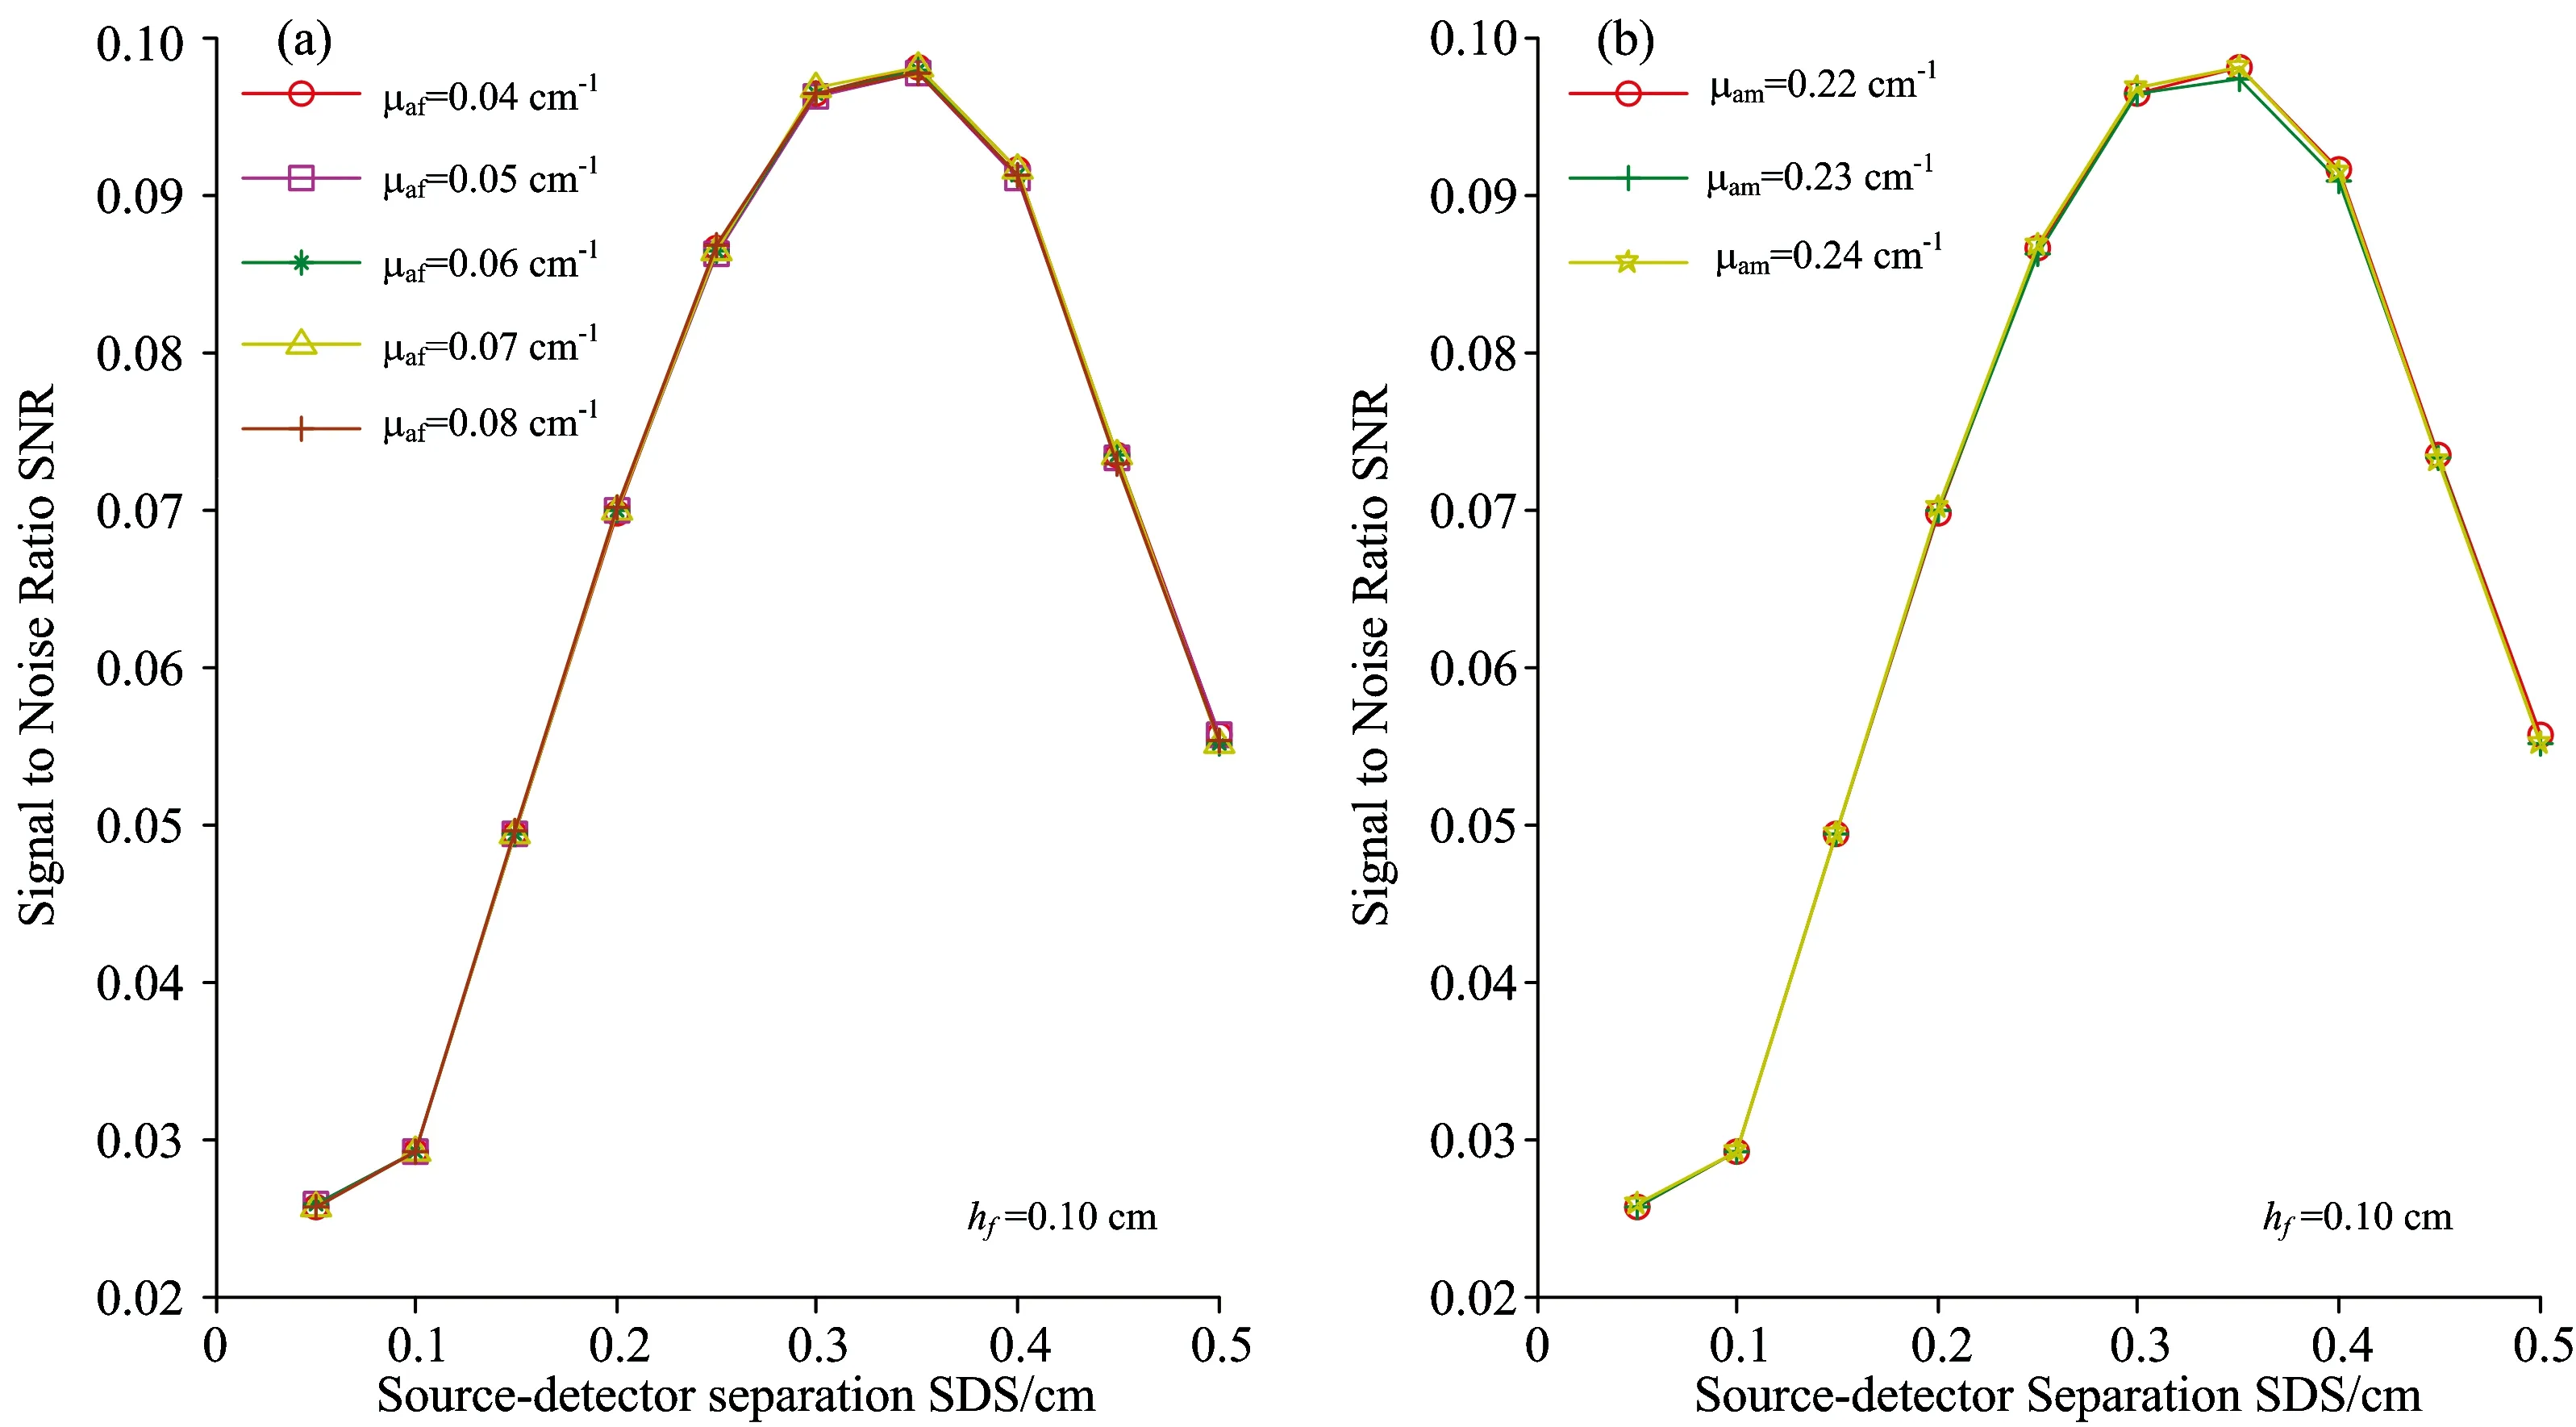
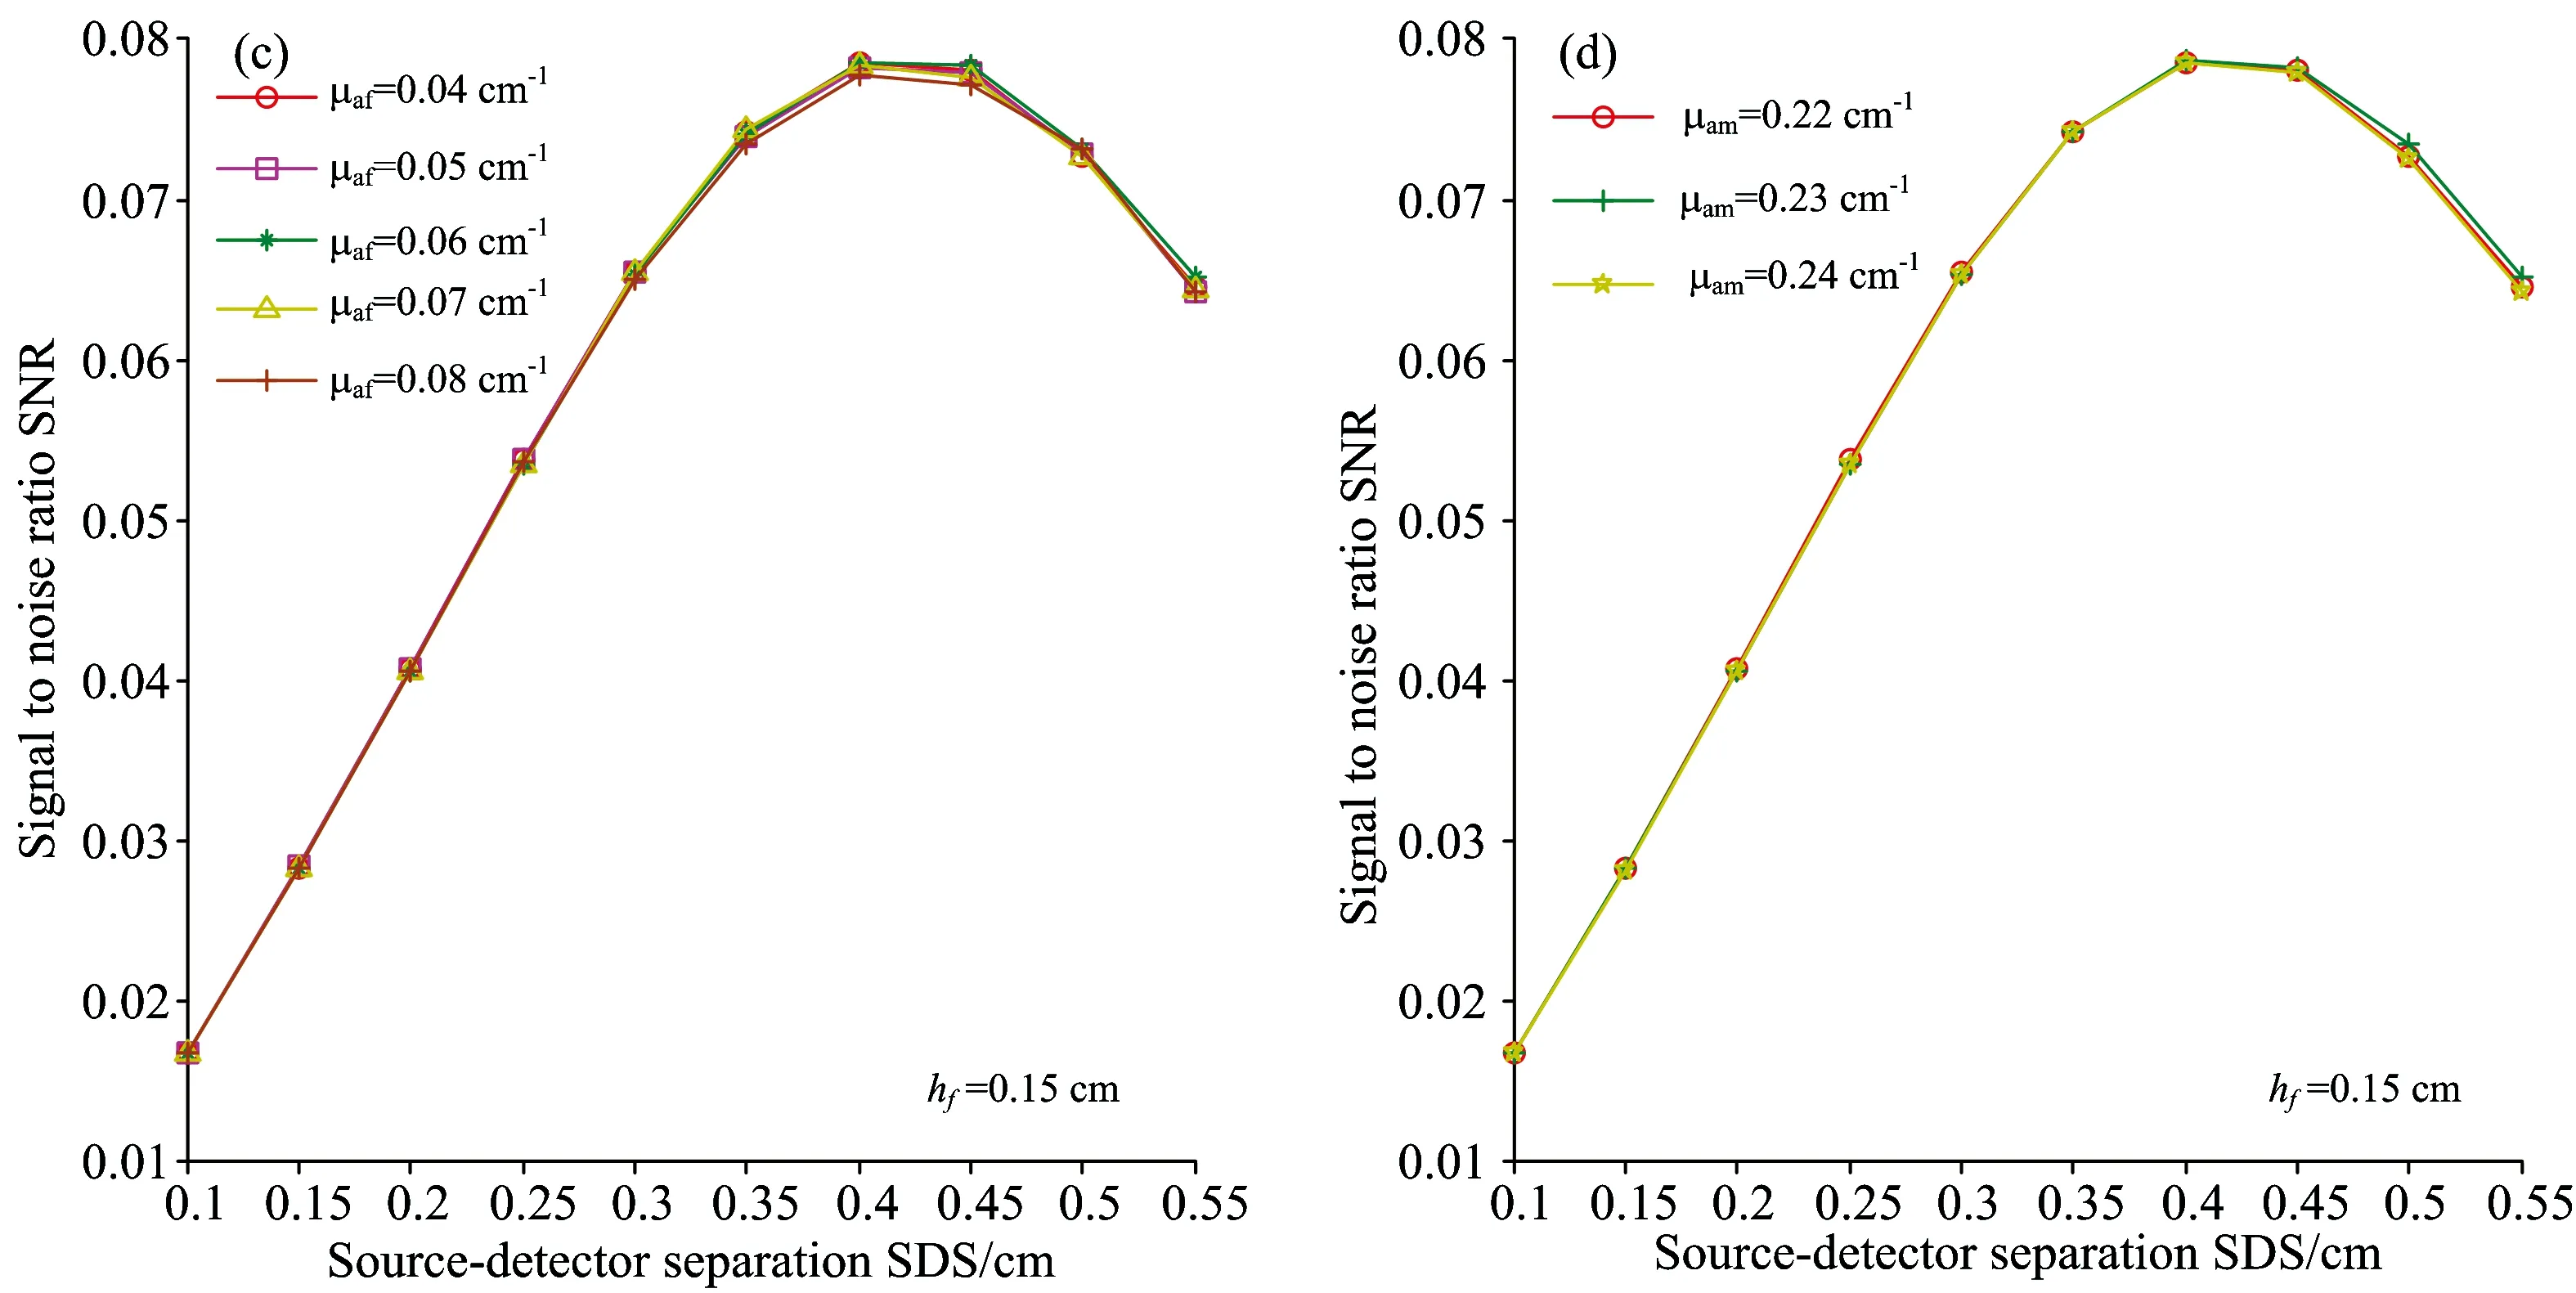
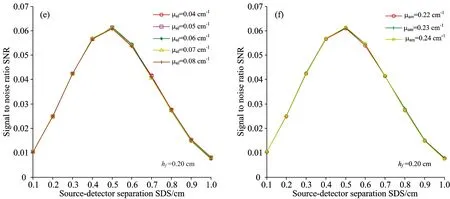
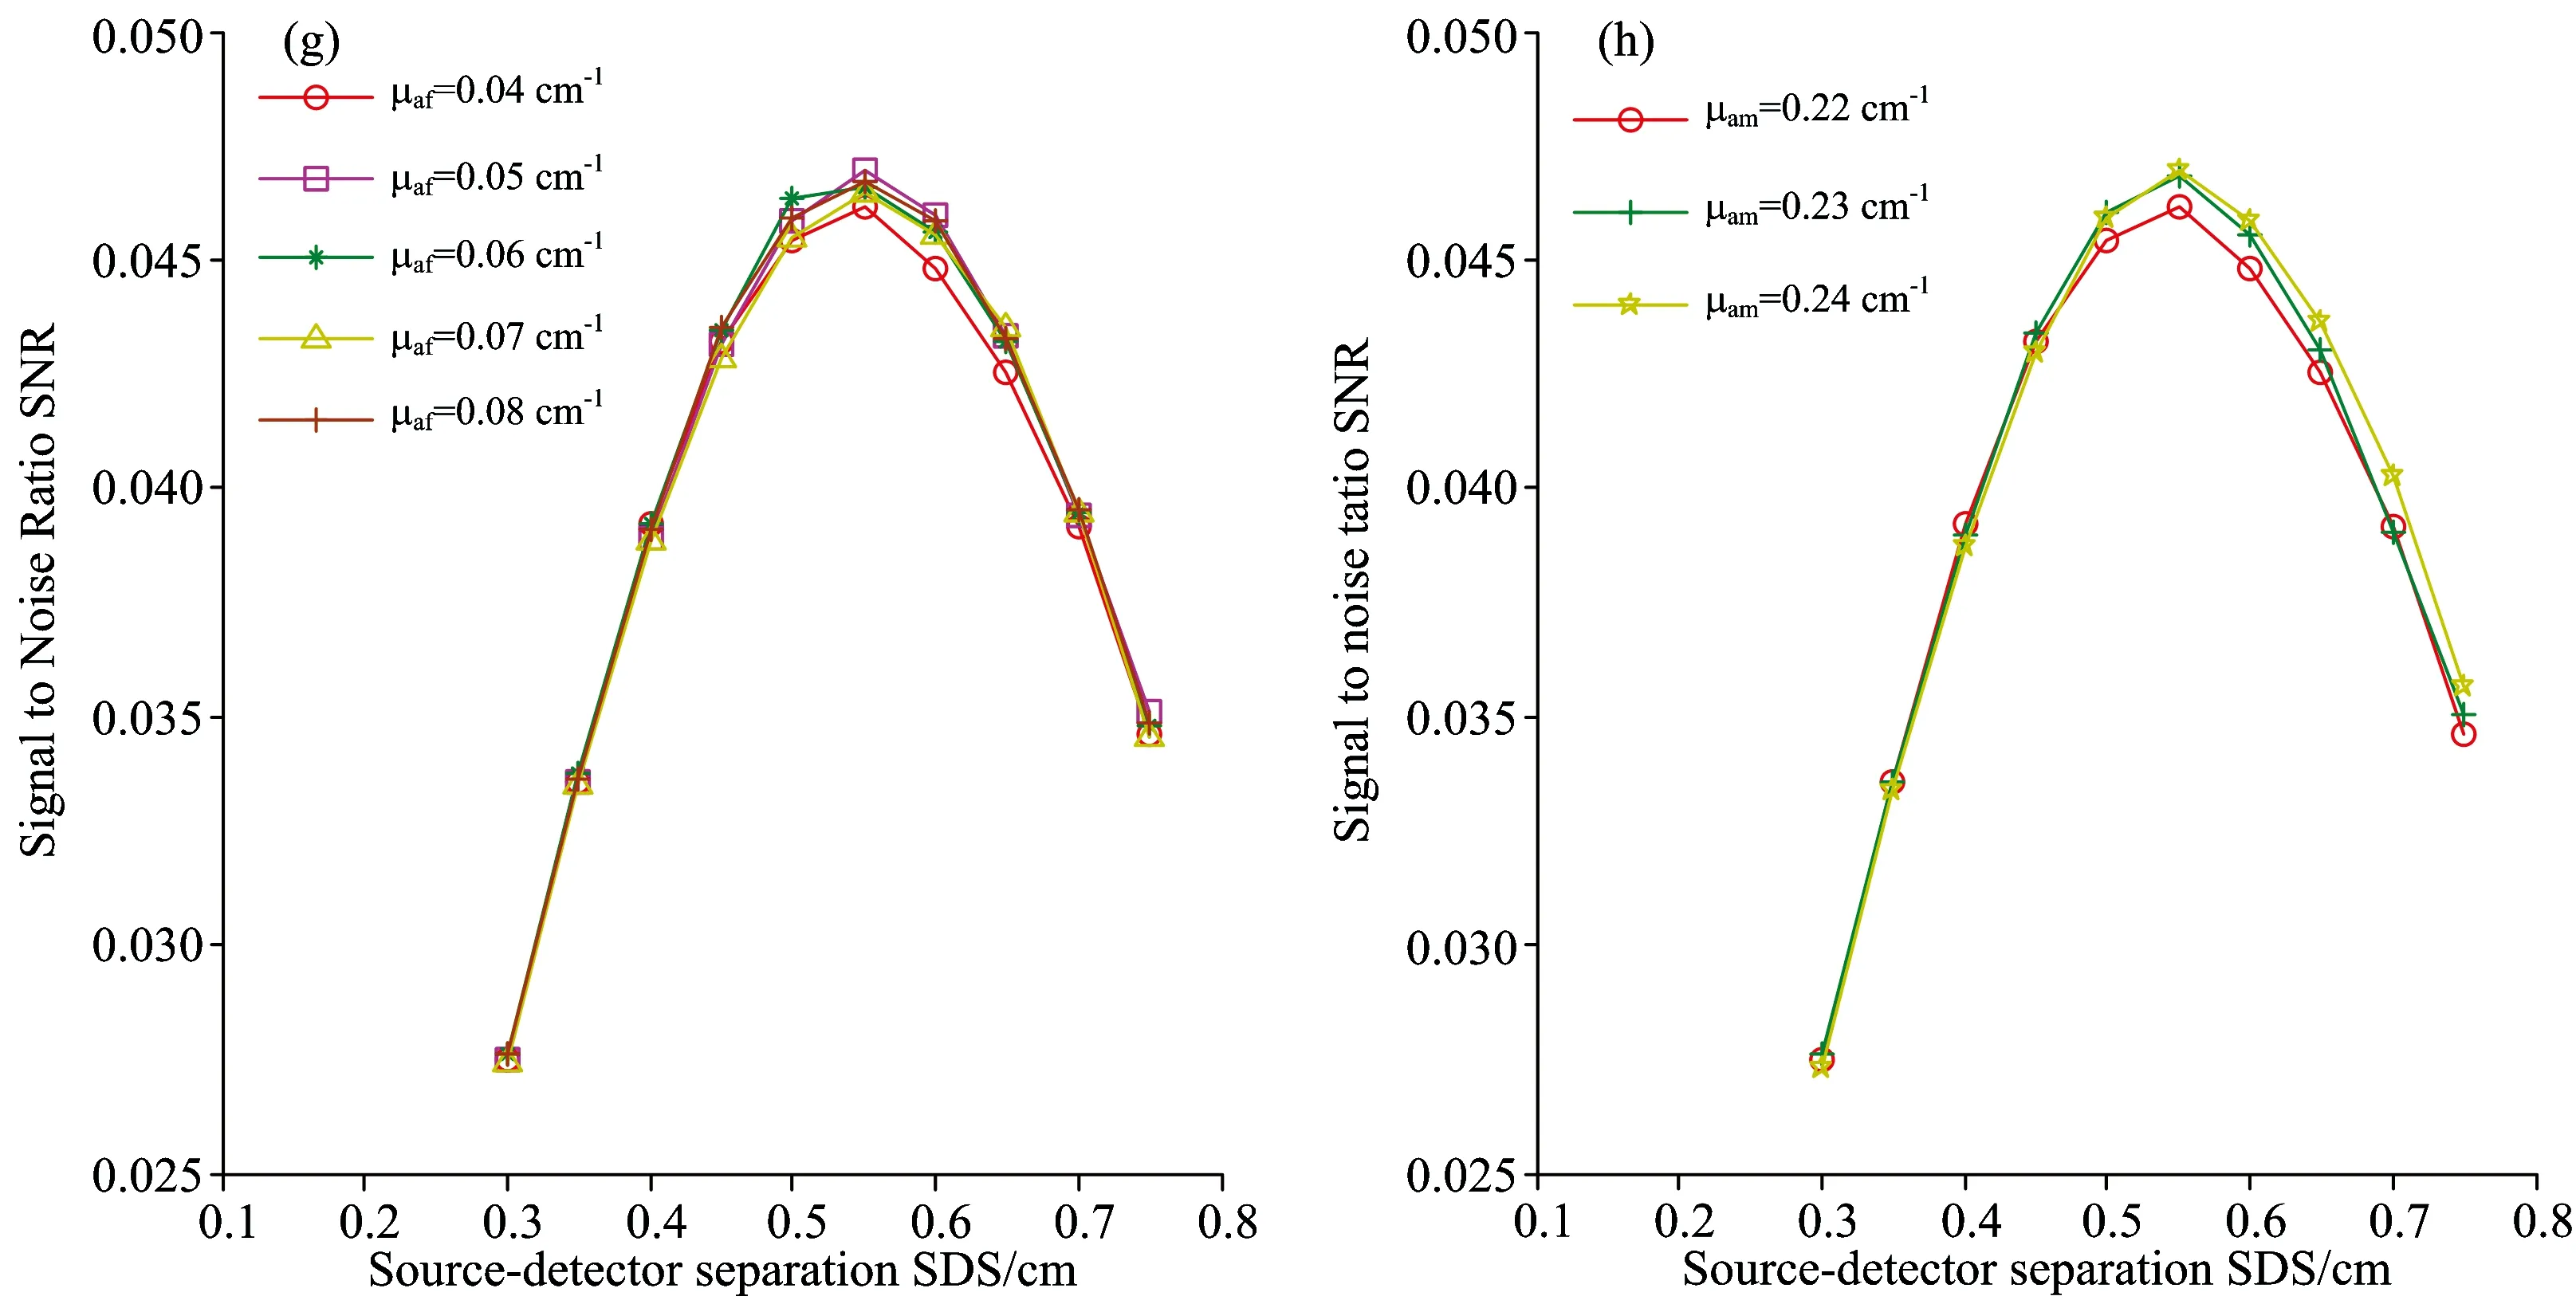
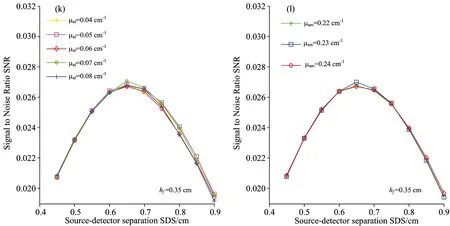
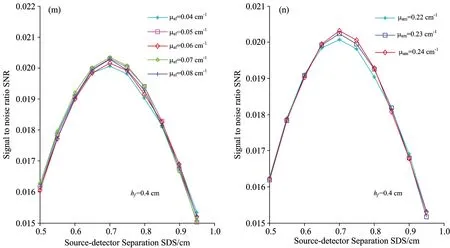
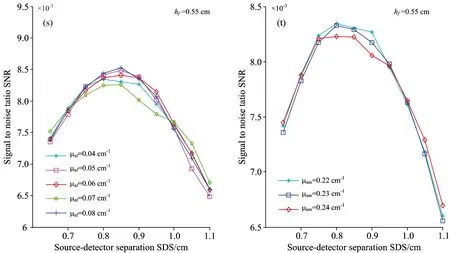
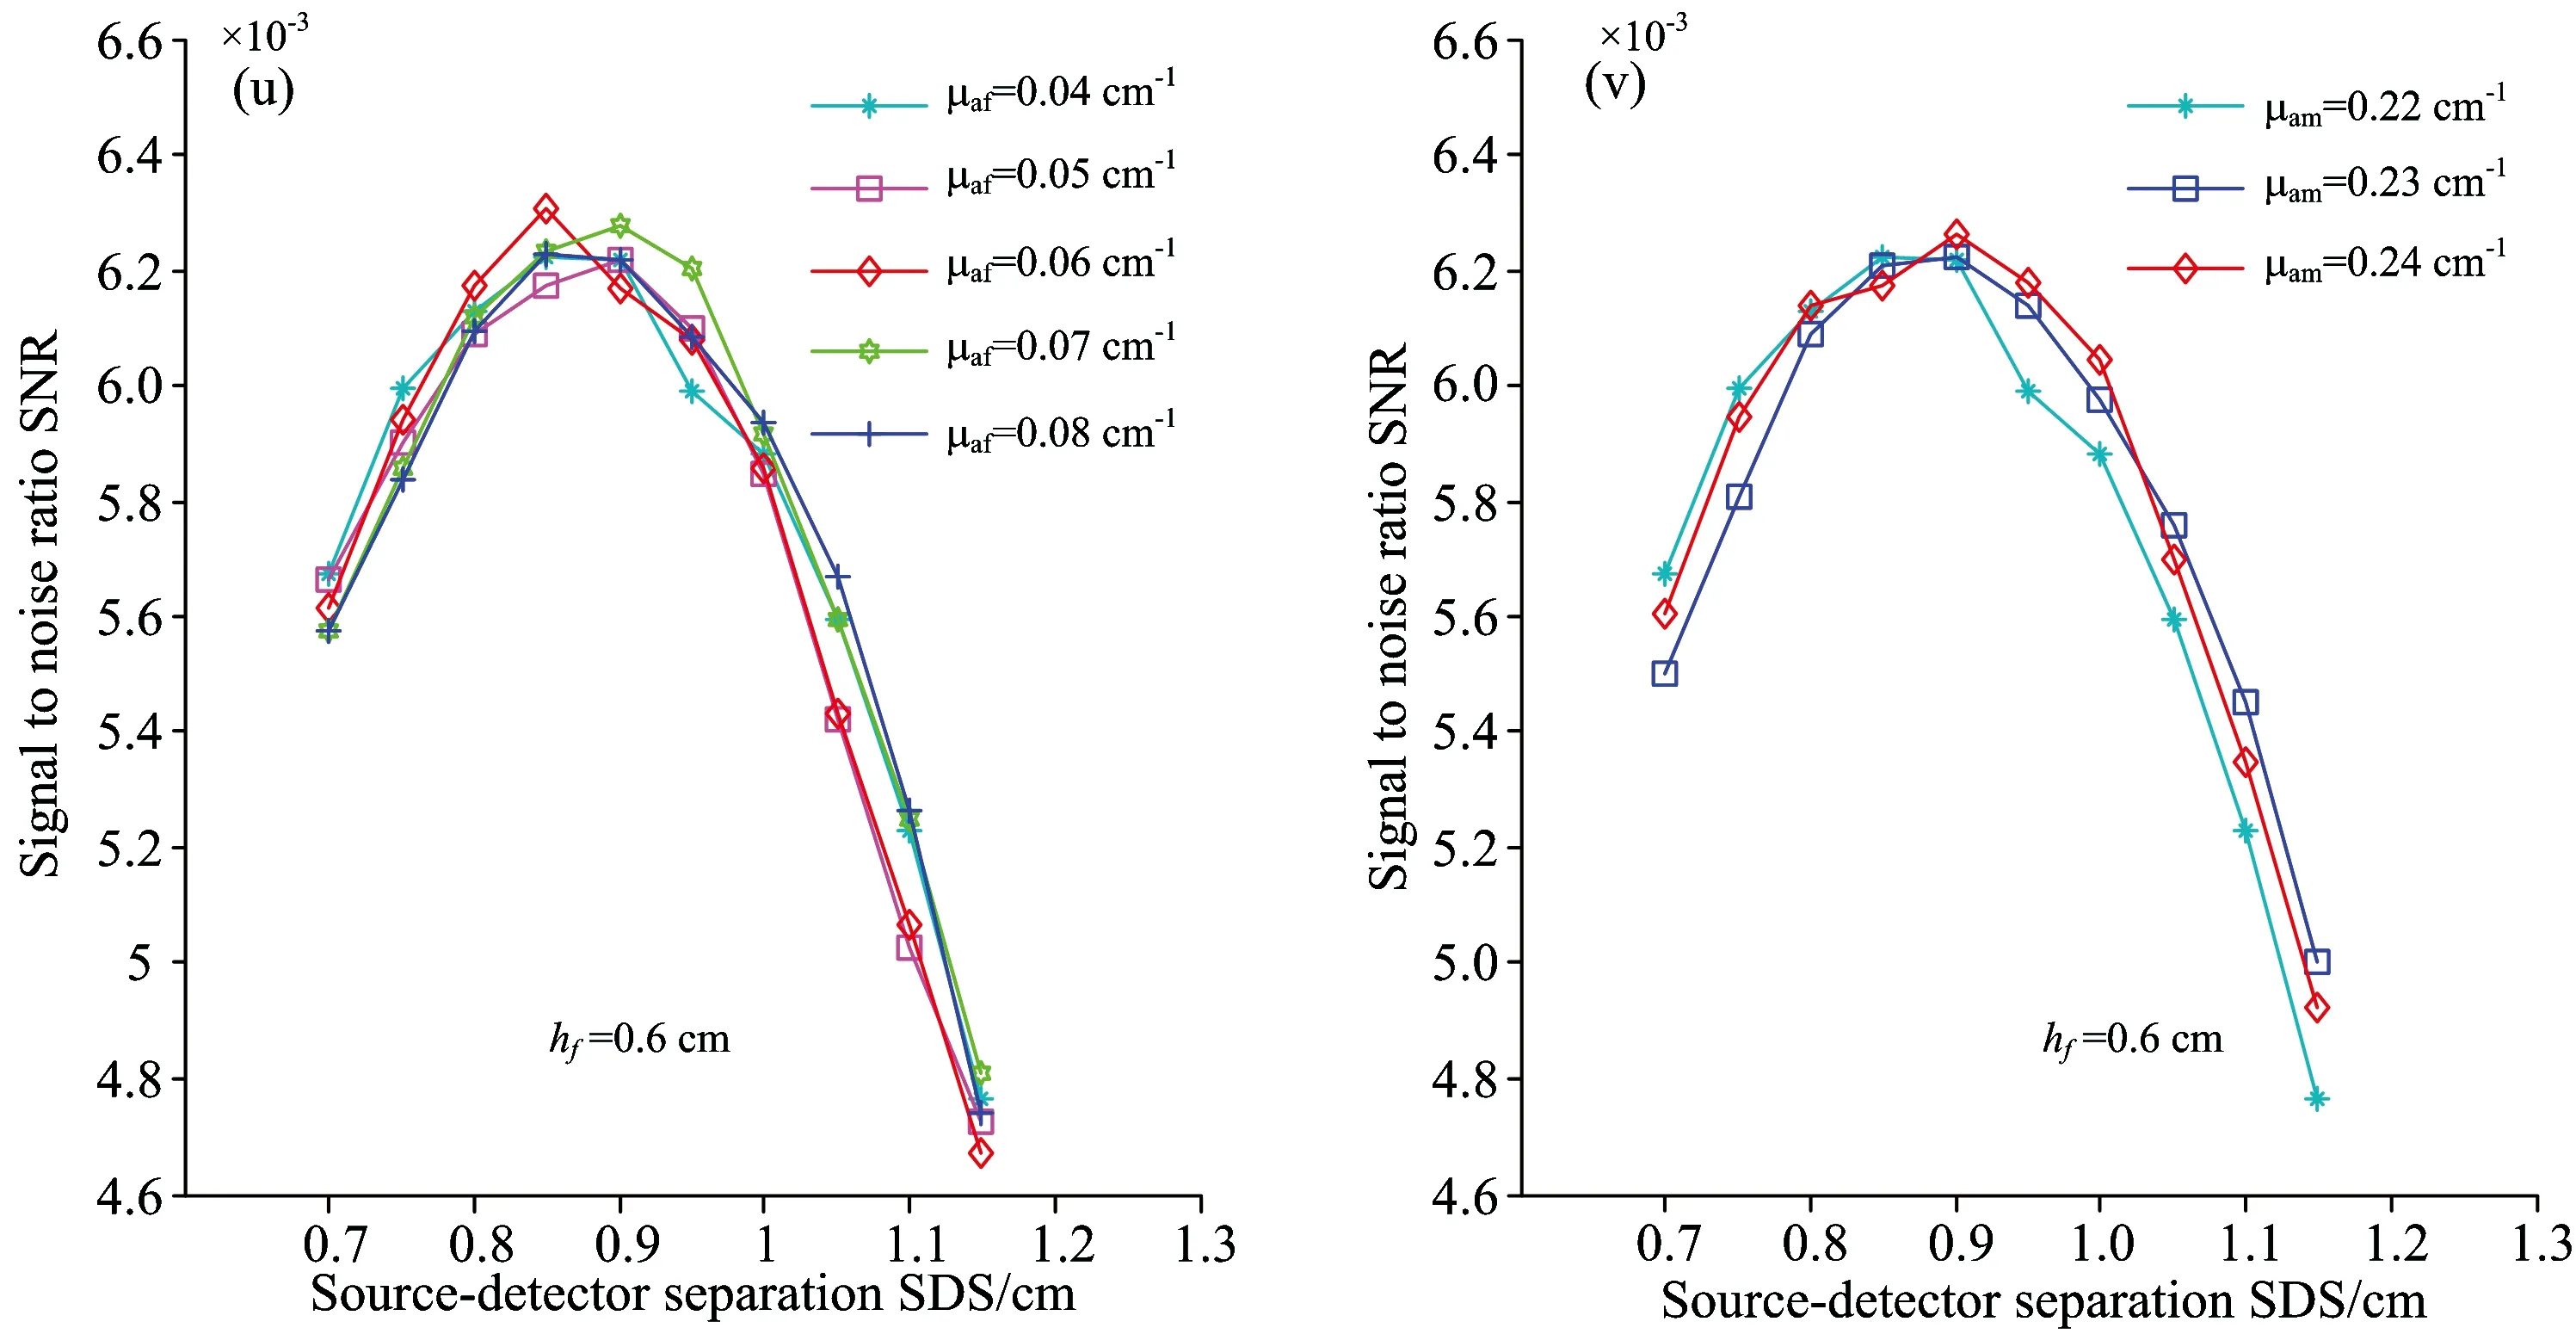
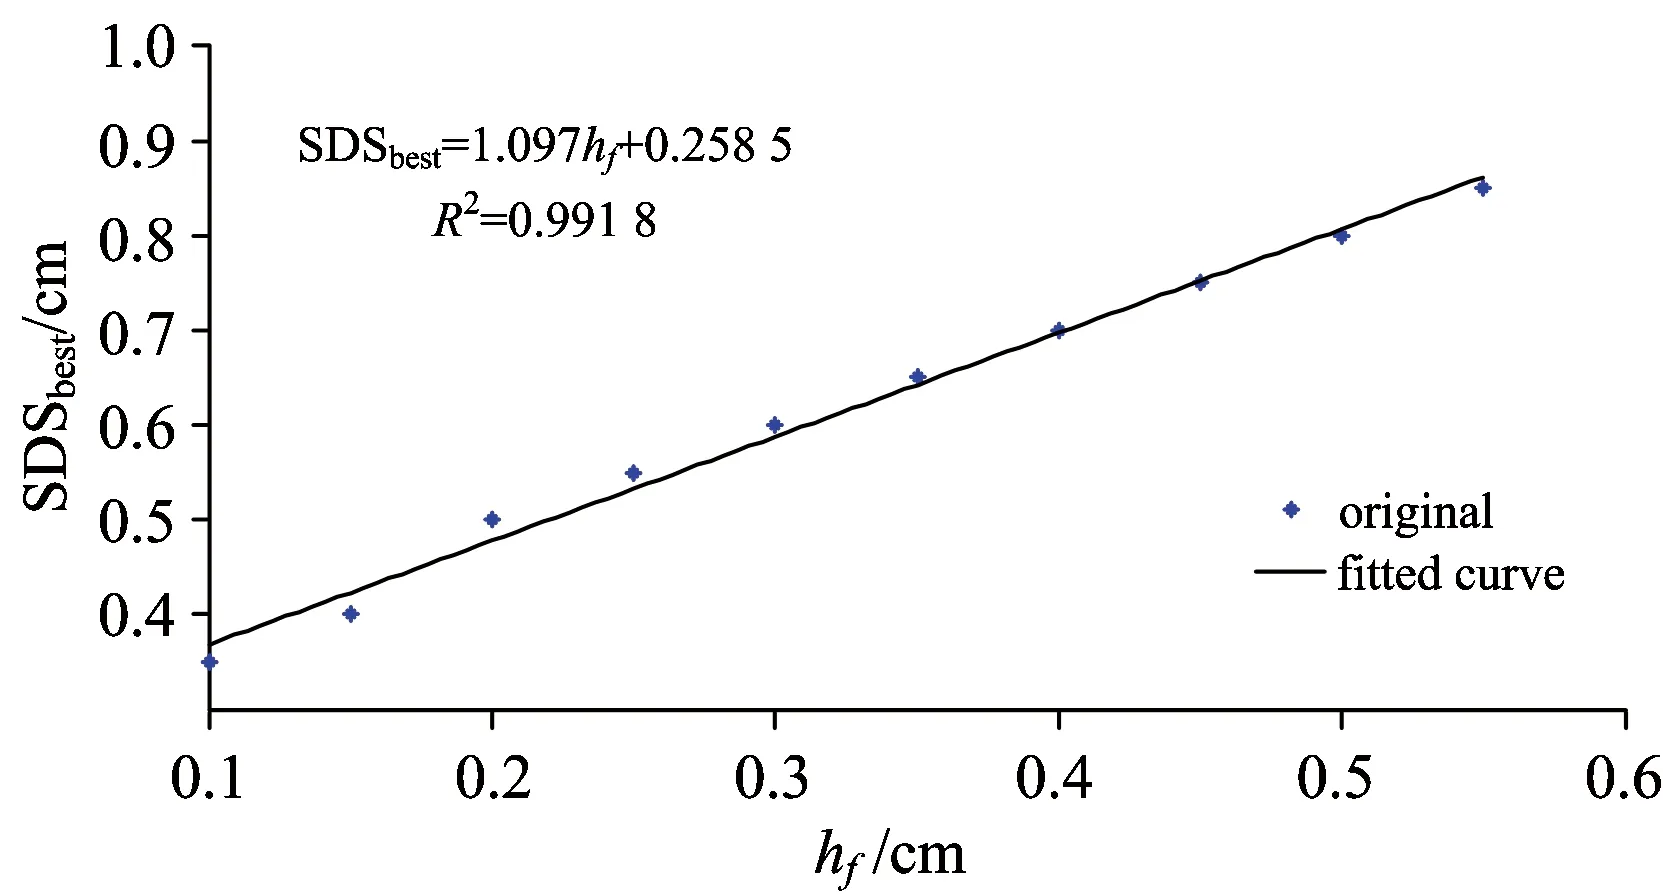
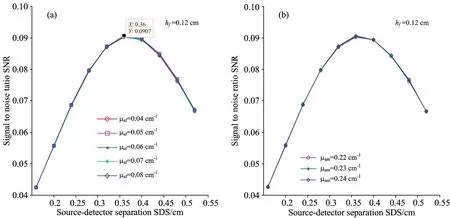
As to most methods of detecting the inner information of inhomogenous tissue, a significant issue is that the detection position is ambiguous because of the complexity of human tissue structure and discrepancies among individuals. This paper studies the best source-detector distance (SDSbest) to detect internal information of a fat-muscle tissue with spatially resolved diffuse reflectance spectra. In order to weaken the measurement error caused by the discrepancies among individuals and multiple backscattered photons, and according to the transmission model of light in complex biological tissue, then we added the constraint condition——two ideal “banana shape”paths——to define the effective photon ratio(SNR), which was used to select the best source-detector separations (SDSbest), and the results from Monte Carlo simulation modified by adding constraint condition were statistically analyzed, and we regard the SNR as a basis and analyze the relationship between the fat thickness (hf),the absorption coefficient of a fat layer (μaf),the absorption coefficient of a muscle layer (μam) and the source-detector distance (SDS), andhfis used as the independent variable to develop a linear regression model to predict SDSbest. The result showed thatμafandμamhave no effect on SDSbestwhen 0 Fat-muscle tissue; Inner information of tissue; Best Source-detector Distance; Spatially diffuse reflectance spectra; Monte Carlo simulation Introduction Spectral analysis technique has been widely used to analyze compositions of the scattering liquids such as milk[1], blood, etc, which is of great importance to food safety[2], disease detection[3]and non-invasive measurement of tissue oxygenation[4-5]. Nevertheless, in recent years, one strategy to gain internal information of the measured tissue from reflected photons is using multiple source-detector separations (SDSs)[6], which can obtain a wealth of optical and structural information, however, a significant challenge is that the detection position is ambiguous. Near-infrared spectroscopy is a non-invasive optical technique to monitor tissue oxygenation, but the thickness of the fat layer has great difference between people or people subjects, that is, the individual discrepancy which is the most difficult problem may influence the measured spectrum, thus it is significant and necessary to eliminate the interference of the individual discrepancy[7]; in addition, previous publications[8]have supported that multiple backscattered photons has lost the accurate information, subsequently, although some photons may travel through the target layer, they are still considered as non-effective photons because it depends on the amount of scattering acts in the investigated media, especially for thick tissues, where multiple scattering is severe. Moreover, the multiple backscattered photons[9]are often ignored in recent years. Therefore, here, to minimize the individual discrepancies and the interference of the multiple backscattered photons, the effective photon ratio (SNR) was defined as a basis for selecting the best detection position. The aim of the present work is to analyze the relationship between the fat layer thickness, the absorption coefficient of the fat layer, the absorption coefficient of the muscle layer and the best detection position based on the modified Monte Carlo simulation which is developed by Lihong V. Wang[10]. By selecting the best source-detector distance can achieve the selected measurement for the specific target layer and improve the efficiency. This not only provides the early auxiliary function for researching the internal information, but also conducive to the further study on more complex biological tissue, and can help identify the precise position. To make sure the effective information from the muscle layer, as shown in Figure.1, for example, we define the two typical “banana shape”paths as ideal boundary: (1) pathⅠensures that the incident photons go through the effective area of the target layer, its path length ispi1; (2) path Ⅱ ensures that the photons are limited scattering photons, its path length ispi2. When the two conditions above are satisfied, in other words, wherepi1 (1) (2) (3) Wherebiis the half of the source-detector separations (SDS). According to the elliptic arc length formula,ai1,ai2,biare used respectively as a semi-major axis and semi-minor axis to calculate the length of path Ⅰ and Ⅱ, as shown in Eq. (4) and (5). (4) (5) Fig.1 Fat-muscle schematic for Monte Carlo simulation,lrepresents the space between the fibers.hfis the thickness of the fat layer Whereiis the receiver fiber at positioni. Monte Carlo is a flexible approach to calculate of a large number of random trajectories of photons migrating in the scattering medium basing on its optical properties. In this paper, we introduced the constraint conditionpi1 (6) Where,Nnis non-effective photons. In order to obtain the diffuse reflectance, tissue as illustrated in Fig.1 was measured by inserting several independent optical fibers held by a fixed support with a separation distancelamong them. The optical parameters of the fat and muscle layer are from previous publications[11-12], and the thickness of the muscle layer is not limited. From Eq. (3),kis a variable, whereas the aim of this paper is to study the relationship between the fat layer thickness (hf),the absorption coefficient of a fat layer (μaf),the absorption coefficient of a muscle layer (μam) and the source-detector distance (SDS), so we focused on a particular case ofk=3, and the optical parameters are stated in Table 1, and a packet of 108photons is launched per simulation, and repeat 6 times per simulation. Table 1 Optical parameters of the fat and muscle layers at 760 nm Experiences can be separated into the following steps: (1)hf=0.1 cm, the relationship between SDS and SNR is demonstrated in Fig.2(a) withμafspecified in the range [0.04, 0.05, 0.06, 0.07, 0.08] cm-1; and withμamspecified in the range [0.22, 0.23, 0.24] cm-1, the relationship between SDS and SNR is demonstrated in Fig.2(b); (2) In the same way, the value ofhfincreases by 0.1 cm untilhfequals to 0.6 cm, as shown in Fig.2(c)—(v); (3) According to Fig.2(a)—(v),hfis used as the independent variable to develop a linear regression model to predict SDSbest.[Fig.3]; (4) Randomly selecthf=0.12, 0.22 cm to predict the precision of the model [Fig.4 (a),(b) and Fig.5 (a),(b)]. From Fig.2, when 0.1 cm Fig.2 The graphs on the left study the influence ofμafon the relationship between SDS and SNR whenhfis 0.1, 0.2~0.6 cm respectively; the graphs on the right study the influence ofμamon the relationship between SDS and SNR whenhfis 0.1, 0.2~0.6 cm respectively In this paper,hfis used as the independent variable to develop a linear regression model to predict SDSbest., as shown in Eq. (7), the correlation coefficientR2is 0.991 8. SDSbest=1.097hf+0.258 5 (7) Randomly selecthf=0.12, 0.22 cm, the prediction error is 0.030 14 and 0.020 16 respectively, the error can be controlled within 5%. Fig.3hfis used as the independent variable to develop a linear regression model to predict SDSbest. Fig.4 (a) represents the influence ofμafon the relationship between SDS and SNR whenhf=0.12 cm; (b) represents the influence ofμamon the relationship between SDS and SNR whenhf=0.12 cm Fig.5 (a)represents the influence ofμafon the relationship between SDS and SNR whenhf=0.22 cm; (b) represents the influence ofμamon the relationship between SDS and SNR whenhf=0.22 cm The present paper addresses experimental design considerations, in particular the selection of source-detector separations used. The constraint condition is introduced into the MC simulation to obtain the effective photons (Ns), and the non-effective photons (Nn), and the effective photon ratio (SNR). Simulations are used to characterize the link between the fat layer thickness (hf),the absorption coefficient of a fat layer (μaf),the absorption coefficient of a muscle layer (μam) and the source-detector distance (SDS). The result suggested thatμafandμamhave no effect on SDSbestwhen 0 [1] Bogomolov A, Melenteva A. Chemometrics and Intelligent Laboratory Systems,2013, 126(15): 129. [2] Poliana M Santors, Edenir R Pereira-Filho, Luis E Rodriguez-Saona. Agricultural and Food Chemistry,2013, 61(6): 1205. [3] Georg Hennig, Herbert Stepp, Ronald Sroka. Applied Optics(USA),2013, 52(5): 1066. [4] Lorilee S L Arakaki, Kenneth A Schenkman, Wayne A Ciesielski. Analytica Chimica Acta, 2013, 785: 27. [5] Michelle L Davis, Thomas J Barstow. Respiratory Physiology & Neurobiology, 2013, 186(2): 180. [6] Kung-Bin Sung, Kuang-Wei Shih, Fang-Wei Hsu. Journal of Biomedical Optics,2014, 19(7): 077002-1. [7] Li Chenxi, Zhao Huijuan, Zheng Jiaxiang. Acta Optica Sinica, 2012, 32(7): 0717001-1. [8] Wu Kai-jie, Li Gang, Lin Ling. Journal of Tianjin University, 2012, 32(3): 755. [9] Wang Liyun, Li Gang, Li Zhe. Spectroscopy and Spectral Analysis,2014, 34(4): 1026. [10] Wang L, Jacques S L, Zheng L. Computer Methods and Programs in Biomedicine, 1995, 47: 131. [11] Ye Yang, Olusola O Soyemi, Michelle R Landry. Optics Express, 2005, 13(5): 1570. [12] Lin Ling, Chen Yaqin, Li Gang. Chinese Journal of Biomedical Engineering, 2003, 23(5): 419. *通讯联系人 O657.3 A 基于漫反射光谱法下层组织信息的最佳探测位置的研究 刘 妍1,2,杨 雪1,2,赵 静3,李 刚1,2,林 凌1,2* 1. 天津大学精密测试技术及仪器国家重点实验室,天津 300072 2. 天津大学天津市生物医学检测技术与仪器重点实验室,天津 300072 3. 天津中医药大学中医药工程学院,天津 300193 由于人体组织结构的复杂性和个体差异性,采用光谱分析技术实现组织内部信息的检测方法中,仍存在着检测位置不明确的问题。采用多位置空间分辨漫反射光谱法对脂肪肌肉组织中内部信息的最佳探测位置进行了研究。由于目标组织为肌肉组织,为了消除由于不同人体皮下脂肪层厚度的差异以及目标层中多次后向散射光对测量结果引起的较大误差,并根据光在复杂生物组织中的传输模型,通过增加约束条件——两条理想的“香蕉型”路径—来定义有效光子比SNR,并以SNR作为评价最佳探测位置SDSbest的标准,对优化后的Monte Carlo仿真结果进行统计分析,分别研究了脂肪层厚度hf、脂肪层吸收系数μaf和肌肉层吸收系数μam与光源探测器间距SDS之间的关系,并以hf为自变量与SDSbest建立线性回归模型。研究表明,(1)当0 脂肪肌肉组织;内部组织信息;最佳检测位置;空间漫反射光谱;Monte Carlo模拟 2015-07-07, 2015-11-20) 10.3964/j.issn.1000-0593(2016)10-3434-08 Received:2015-07-07; accepted:2015-11-20 *Corresponding author e-mail: linling@tju.edu.cn1 Spatially Resolved Diffuse Reflectance Spectra
2 Modified Monte Carlo Simulation
3 Results and Discussion


4 Conclusion
猜你喜欢
杂志排行

光谱学与光谱分析的其它文章
- Gd靶激光等离子体光源离带辐射及其等离子体演化的研究
- Probing the Binding of Torasemide to Pepsin and Trypsin by Spectroscopic and Molecular Docking Methods
- Mn(Ⅱ)-5-Br-PADAP共沉淀-火焰原子吸收光谱法测定虾、贝样中的镉
- Near Infrared Spectroscopy Study on Nitrogen in Shortcut Nitrification and Denitrification Using Principal Component Analysis Combined with BP Neural Networks
- 内蒙古草原植被最大光能利用率取值优化研究
- 健康和糖尿病大鼠红细胞荧光光谱非线性程度差异