The Application of THz Spectroscopy and GA-BP in Methanol Concentration Detection
2016-07-12TANHongyingZHENGDezhongLIXueXUZhengxia
TAN Hong-ying,ZHENG De-zhong,LI Xue,XU Zheng-xia
Hebei Provincial Key Laboratory on Measurement Technology and Instrumentation, School of Electrical Engineering, Yanshan University, Qinhuangdao 066004, China
The Application of THz Spectroscopy and GA-BP in Methanol Concentration Detection
TAN Hong-ying,ZHENG De-zhong,LI Xue,XU Zheng-xia
Hebei Provincial Key Laboratory on Measurement Technology and Instrumentation, School of Electrical Engineering, Yanshan University, Qinhuangdao 066004, China
At ambient temperature and atmospheric pressure, making use of a photoconductive-antenna terahertz time-domain spectrograph and a self-designed air chamber, the terahertz time-domain spectroscopy (THz-TDS) technique test of methanol gas in the range of 0.1~3.0 THz shows that the methanol gas has no obvious absorption peaks in the range of 0.1~3.0 THz and has obvious absorption peaks in the range of 0.1~1.0 THz. In order to improve the determination accuracy of the concentration of the methanol gas, the author detected 15 groups of methanol gas with different concentrations on the basis of the relationship between the strengths of 15 characteristic absorption peaks of different locations and the concentration of the methanol gas, and obtained the difference curve of the of the characteristic absorption peaks. Based on the function approximation of BP neural network, the author optimized the initial weights and biases of the BP neural network by using the GA the genetic algorithm, which has higher rate of convergence to prevent from getting into local optimum easily, and constructed the mathematical model with the purpose of predicting the methanol gas concentration. The test results show that the neural network is applicable to predict methanol gas in the volume concentration range of 0.028 3~0.424 6 m3·L-1, the average relative standard deviation of the 2 sets of samples is 1.7%, the average recovery rate is 98%, the error precision of the neural network is 10-1, and correlation coefficient of the measured values and the predicted values is 0.996 77. The test basically achieved ideal predicted results. The research results obtained experimental data of methanol gas in the terahertz frequency band and found that the method of combining terahertz time-domain spectroscopy with GA-BP neural network can effectively detect the volume concentration of methanol gas, and provided a new method for the detection of concentration of methanol gas.
Spectroscopy; Terahertz time-domain spectroscopy; Genetic algorithm; BP neural network; Methanol
Introduction
Terahertz ray is in the far-infrared band, and it can realize nondestructive recognition for its little damage when it penetrates samples. Furthermore, because terahertz ray locates between infrared spectrum and microwave, both the electromagnetic wave amplitude and phase can be acquired when the broadband terahertz pulses are used to irradiate samples. Therefore, in recent years there are many researches scholars home and abroad used terahertz waves to detect organic molecules because the electromagnetic waves of this wave band can obtain the absorption spectrums of pure rotational transitions and vibration-rotation transitions of molecules. For example, John C. Pearson[1]et al. analyzed rotation spectrum in ground-state methanol, J. P. Laib[2]et al. conducted the experiment of terahertz absorption curve on alkanes such as pentane; and in China, for instance, Zhao Hui[3]et al. analyzed characteristics of 1,3-dinitrobenzene in terahertz band, Hou Dibo[4]et al. analyzed the absorption coefficient and refractive index of endosulfan in the range of 0.1~3.0 THz. The research results demonstrate that the terahertz time-domain spectroscopy can be applied to detect organic substances. In terahertz-spectroscopy tests on organic gases, however, owing to the interference by gases such as H2O and CO2, the experimental cannot provide obvious results and relatively big errors[5-6]of predicted gas concentration were existing. Furthermore, based on the literature[7-8], a C—H…O of methanol has a hydrogen bond, and the vibration of the intermolecular hydrogen bonds can easily leads to characteristic absorptions in terahertz band. Based on the reason above, regarding methanol, which is a kind of organic gases, as the experimental subject, this thesis obtains the characteristic absorption spectrum of methanol gas in the range of 0.1~3.0 THz through experiments by using photoconductive-antenna terahertz spectrograph that is produced by the BATOP Company and employs the improved GA-BP neural network to give predictions of methanol gas concentration.
1 The Experiment Principle and the Modeling Theory
1.1 The Experiment Principle
Figure 1 shows the schematic light path diagram of the test system. The femtosecond laser pulse that is emitted by a photoconductive antenna is divided into two beams of light by a beam splitter. One of the beams goes through a chopper of 33 kHz with its repetition frequency being reset to 33kHz, and the beam of light forms a pump beam after reflected by a retroreflector of one-dimensional translation platform. Then the beam passes through a specimen chamber. The other beam of light is called the probe beam, which passes through a light path of the same length as the former beams passes through without moving through the air chamber, and converges together with the pump beam in the detector. The detector can simultaneously acquire the terahertz reflected light that passed through the gas which needs to be measured and the terahertz pulse that did not pass through the chamber, and that causes a difference signal. The relationship of strength and time of the terahertz electric field can be output after disposed by a postpositional signal current amplifier and a lock-in amplifier. After transformed with Fourier, the relationship can provide the relationship of amplitude and phase, and a signal of terahertz time-domain spectroscopy of the sample to be tested can be obtained in the end.

Fig.1 Principle picture of experimental optical path
A photoconductive-antenna terahertz spectrograph with its spectral range between 0.1~3.0 THz is chosen as an experimental device. An organic glass cylinder works as an air chamber, which has air guide pipelines on both ends, and the material of the windows on its two sides is polytetrafluoroethylene with the thickness of 2 mm. The air chamber possesses good transparency and low absorption rate[9]to terahertz waves. The appearance of the chamber is shown as Figure 2. In the experiment, the spectrum resolution is equal or lesser than 10 GHz, and the scan times are less than 50.

Fig.2 Air chamber
Methanol gas is chosen as the sample while N2is chosen as the reference gas. Introduce methanol gases of 100~1 500 mL respectively into the air chamber with its volume of 3.532 5×10⁻³m3, and conduct the experiment 15 times in the same conditions. The experiment is conducted at ambient temperature and atmospheric pressure, and uses N2to flush the chamber at the speed of 10 m3·s-1for 5 minutes before every beginning of the experiment.
2.2 The Modeling Theory
The BP neural network, which comprises the forward propagation process and the back propagation process[9], has strong abilities of fault-tolerance, adaptive and self-learning[10]. The three-layer BP neural network comprises the input layer, the single hidden layer and the output layer[11]. The structure of the neural network is shown in Figure 3.

Fig.3 The single hidden layer BP neural network
In the input layer,
qk=f(netk)k=1,2,…,l
(1)
(2)
Intheoutputlayer,
yj=f(netk)j=1,2,…,m
(3)
(4)
Theformulasabovejointlyconstitutethemathematicalmodelofthethree-layerBPperceptron.Nevertheless,theBPneuralnetworkisonlyappropriateforgradientdescentoflocalareas.Therefore,thenetworklacksofcomprehensiveandgetsintoalocaloptimumextremumeasily[12-13].ButtheGAisaglobaloptionalalgorithmthatisbasedontherandomsearchofthetheoryofbiologicalevolution,anditcanoptimizetheinitialweightvaluesandthresholdvaluesoftheBPnetworkintraining.Sothealgorithmcanpreventthenetworkfromgettingintolocalminimumsandensurethenetworktopossessreasonableconvergencespeed[14].
TheindividualselectionprobabilityoftheGAisshowninthefollowingformula,
(5)
Thefiindicates the match value of the individuali, andfiis measured by squared error andE. The expression is,
E(i)=∑p∑k(Vk-Tk)2
(6)
Intheexpression,theiis the chromosome number; thekis the input node number; thepis the learning sample number; theTkis the output signal. Then use the cross operation and the mutation operation to insert a new individual into the species group and calculate the evaluation function. It ends if it find the satisfactory individual otherwise, it is proceed with the cross operation and the mutation operation until find the optimal individual decoding in the species group.
2 The Experiment Results and the Analysis
2.1 The Experiment Results
The experimental curve of methanol gas of 0.028 3 mL·m-3is shown in Figure 4. From Figure 4, the terahertz spectrogram of the methanol in the range of 0~1.0 THz has 15 absorption peaks, the number of which is close to the 17 terahertz peaks that reported in the literature[15]. Substract the reference spectrum of N2and the spectrum of the methanol sample, remove baselines and background noises, and use Lorentz fit to obtain the fitting curve the methanol gas that is shown in Figure 5. Under same experimental conditions, successively input methanol gases in the range of 0.028 3~0.424 6 m3·L-1, observe the results, which show that the locations of the absorption peaks are accordant while the peak heights and the absorption intensities are different. To facilitate comparison, put the fitting curves of absorption peaks in the location 0.245 4 THz of 5 kinds of methanol gases with different concentrations in one diagram. As shown in Figure 6, peak heights are correlative with volume concentrations, and higher concentration of methanol gas has, the higher peak height is, namely absorption efficiency is higher.
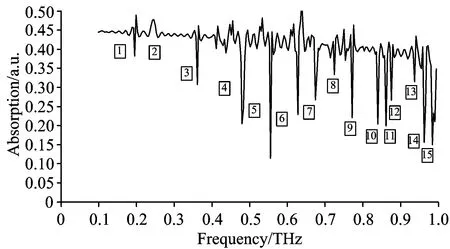
Fig.4 Experimental curve of CH3OH(0.028 3 mL·m-3)

Fig.5 Experimental fitting of CH3OH(0.028 3 mL·m-3)
2.2 Analysis and the Identification of the GA-BP Neural Network
In the BP network, the height of peaks is the input and the concentration data is the output. The first 3 groups of samples are training sets, and the last 2 groups of samples are test sets. In the process of network training, input is the absorption intensities that correspond to 15 characteristic peaks, and the output is a predicted concentration of the sample. Set the number of hidden-layer nodes to 13, the number of maximum training times to 5 000, the learning efficiency to 0.05, the noiseless training error to 10-1.

Fig.6 THz spectra of methanol at different concentrations
In the GA, set the number of species groups to 50, the hereditary algebra to 100, and the crossover rate and the mutation rate are 0.95 and 0.005 respectively. After computation, we can get the changing curve of fitness that is shown as Figure 7 and the optimal fitness that is 2.505×10⁻³.

Fig.7 Relationship curve of fitness and genetic generation
After the training, we can obtain the mean square error curve that is shown as Figure 8. The result of linear regression analysis of the network output value and expected value is shown as Figure 9, and the correlation coefficient is 0.996 77, which demonstrates!the degree of fitting of network output value and expected value is high. The two values are basically concord, and the results prove that the network is competent to predict methanol concentrations accurately.
From Figure 9, the more sample points a location has, the better the approximation effect is. Although the terahertz spectrum test on methanol gases is affected by numerous interfering factors, the GA-BP algorithm can utilize the ability of fast searching in the negative gradient direction of the BP algorithm and the global-optimization characteristic of the GA algorithm, and the GA-BP algorithm is a timesaving and reliable prediction technique with excellent abilities of adaptive, fault-tolerance and self-learning. The algorithm is qualified to deal with multi-factor conditions and data processing with imprecise information in predicting methanol concentrations. Based on GA-BP neural network, the author acquired data results of predicted sample concentrations. The results are shown in Table 1.

Fig.8 Neural network training mean variance curve

Fig.9 Linear regression analysis of neural network
Table 1 Neural network forecast results

SampleRealconcentration/(L·m-3)EstimatingconcentrationRecovery/%Averagerecovery/%RelativestandarderrorAveragerelativestandarderror10.11320.109897981.881.7020.14150.140099981.521.70
From Table 1, prediction of test samples by using a well-trained neural network can provide us results that are shown in Table 1. The actual concentrations of the 2 groups are 0.113 2 and 0.141 5 L·m-3. The recoveries are 97% and 99% and the relative standard deviations are 88% and 1.52%. The recovery of 2 groups of forecast samples is 98%, and the average relative standard deviation is 1.70%.
3 Conclusion
The thesis acquires the absorption spectrum of methanol gases in spectral range between 0.1~3.0 THz with the experimental methods and 15 apparent absorption peaks. The thesis establishes the GA-BP neural network model according to the pertinence of absorption intensities and concentrations of 5 groups of methanol gases with different concentrations at the same location. The results of predicting are: the average relative standard deviation of the 2 groups of test samples is 1.70%, and the average relative standard deviation is 1.70%. The results of neural network training are: the error precision of measured value and expected value reaches 10-1, and the correlation coefficient is 0.996 77. The test basically achieved ideal predicted results. The method can be used to detect methanol gases in the range of 0.028 3~0.141 5 m3·L-1, and it can provide with new ideas in detecting concentrations of volatile organic contaminants in the environment.
[1] Pearson J C, Yu S, Drouin B J. Journal of Molecular Spectroscopy, 2012, 280(4): 119.
[2] Laib J P, Mittleman D M. Journal of Infrared Millimeter & Terahertz Waves, 2010, 31(9): 1015.
[3] Zhao Hui, Wang Gao, Ma Tiehua. Spectroscopy and Spectral Analysis, 2012, 32(4): 902.
[4] Hou Dibo, Yue Feiheng, Kang Xusheng, et al. Spectroscopy and Spectral Analysis, 2012, 32(5): 1170.
[5] Andersen J. Journal of Chemical Physics, 2014, 140(9): 1964.
[6] Ohno K, Shimoaka T, Akai N, et al. Journal of Chemical Physics, 2008, 112: 7342.
[7] Laurette S, Treizebre A, Bocquet B. 14th International Conference on Miniaturized Systems for Chemistry and Life Sciences, Groningen, The Netherlands, 2010. 1964.
[8] Gan Tingting, Zhang Yujun, Zhao Nanjing, et al. Spectroscopy and Spectral Analysis, 2015, 35(1).
[9] Xiao Wei Li, Sung Jin Cho, Seok Tae Kim, Journal of Optics Communications, 2014, 315: 147.
[10] Lei Meng, Li Ming, Wu Nan, et al. Spectroscopy and Spectral Analysis, 2013, 33(1): 65.
[11] Atlas Khan, Jie Yang, Wei Wu. Journal of Neurocomputing, 2014,128: 113.
[12] Luo Yong, Chen Shu-wei, He Xiao-juan, et al. International Journal of Computational Intelligence Systems, 2013, 6(6): 1108.
[13] Wang Jing, Jing Yuanshu, Huang Wenjiang, et al. Spectroscopy and Spectral Analysis, 2015, 35(6): 1649.
[14] Duan Qianqian, Yang Genke, Pan Changchun, et al. The Scientific World Journal, 2014.
[15] Ma Chunqian, Xu Xiangdong, Ding Lian, et al. Spectroscopy and Spectral Analysis, 2014, 34(4): 952.
O433
A
太赫兹光谱法和GA-BP在甲醇浓度检测的应用
谈宏莹,郑德忠,李 雪,徐正侠
燕山大学电气工程学院河北省测试计量技术及仪器重点实验室,河北 秦皇岛 066004
在常温常压下,利用光电导天线式太赫兹时域光谱仪和自行设计的气室,在0.1~3.0 THz范围内对甲醇气体进行太赫兹时域光谱测试,测试结果表明,甲醇气体在1.0~3.0 THz没有明显的吸收峰,但是在0.1~1.0 THz波段存在明显的吸收峰。为了准确测定甲醇气体的浓度,根据甲醇气体在0.1~1.0 THz范围内的15处不同的位置处的特征吸收峰强度和甲醇气体浓度的关系,对十五组不同浓度的甲醇气体进行检测,获得了在特征吸收峰处的差异曲线。基于误差反向传播(BP)神经网络的函数逼近特点,并利用遗传算法(GA)收敛速度较快,不宜陷入局部极值的优点,采用GA优化BP神经网络的初始的权值和阈值,构建了以预测甲醇浓度为目的的数学模型。结果表明,该网络模型适用于体积浓度范围为0.028 3~0.424 6 m3·L-1的甲醇的浓度预测,两组样本的平均相对标准误差为1.7%,平均回收率为98%,神经网络误差精度10-1,实测值与期望值的相关系数为0.996 77,基本达到理想预测结果。本成果不仅获得了甲醇气体在太赫兹频段的实验数据,而且发现太赫兹时域光谱法和GA-BP神经网络相结合的方法能有效地检测甲醇气体的体积浓度,为检测甲醇气体浓度提供新的方法。
光谱学: 太赫兹时域光谱: 遗传算法: 误差反向传播神经网络: 甲醇
2015-09-08,
2016-01-20)
Foundation item: Young Scientistis Fund of the National Natural Science Foundation of China (51408528)
10.3964/j.issn.1000-0593(2016)11-3752-06
Received: 2015-09-08; accepted: 2016-01-20
Biography: TAN Hong-ying, (1979—), female, PhD, Yanshan University e-mail: sumeertree@163.com