Optimization ofhydrogen networks with multiple impurities and impurity removal☆
2016-05-30XuexueJiaGuilianLiu
Xuexue Jia,Guilian Liu*
SchoolofChemicalEngineering and Technology,Xi'an Jiaotong University,Xi'an 710049,China
1.Introduction
In recentyears,on accountof the increasing process ofhigh-sulfurand heavier crude oil,re fineries need to increase their capacity of hydrotreating and hydro-cracking to produce high-quality products to satisfy stricterenvironmentalregulations.As a result,the hydrogen consumption is soaring rapidly.Therefore,the effective utilization ofhydrogen and the optimization ofhydrogen network have vitalsigni ficance for re fineries.
The fresh hydrogen consumption can be minimized with the match between sinks and sources,by integrating the hydrogen network as a whole.However,the amount ofreuse is limited as the hydrogen purity of some sources is low or the impurity concentration is high.To overcome this problem and decrease the fresh hydrogen consumption,puri fiers are often introduced.
Methods for hydrogen networks with puri fication reuse mainly include pinch-based conceptual ones and mathematical programming ones.In terms ofconceptualmethods,Agrawaland Shenoy[1]proposed a pinch-based approach,which can be used in hydrogen/water network with puri fication/recycle.Zhang et al.[2]proposed a triangle rule based on the mass balance ofpuri fication process to targetthe minimum fresh hydrogen consumption for hydrogen networks with puri fication reuse.Yang etal.[3,4]simpli fied and improved this method.Liu etal.[5,6]identi fied the optimalpuri fication feed flowrate based on the concept ofhydrogen surplus.These methods are for hydrogen networks with single impurity,and cannot be applied to that with multiple impurities.
As to mathematicalmethods,Liu and Zhang[7]proposed a model to select appropriate puri fiers for hydrogen networks.Jiao et al.[8]and
2.Problem Statement
Jagannath and Almansoori[9]focused on the optimization of puri fication parameters.Deng et al.[10]and Kuo and Chang[11]compared and analyzed hydrogen networks without and with puri fication unit.Although the operation parameters and the cost of puri fication units are considered in these models,the effects to the whole network caused by the change ofimpurity concentrations are ignored.
Fora hydrogen network with single impurity,allkinds ofimpurities in a hydrogen source are treated as a uni fied impurity.A hydrogen source can be reused directly ifits hydrogen concentration or impurity concentration satis fies the demand ofhydrogen sink.In such cases,impurity removaland hydrogen puri fication are the same,and both of them enhance the hydrogen concentration.However,for a hydrogen network with multiple impurities,besides the hydrogen concentration,the concentrations ofimpurities also restrictthe hydrogen reuse.The removalofeach impurity has differenteffects to the hydrogen network.Itis necessary to analyze these effects on a hydrogen network with multiple impurities.
Zhou et al.[12]set a modelto integrate hydrogen sul fide removal units into hydrogen networks.However,to the best ofour knowledge,no report systematically considers the concentration changes of differentimpurities and their effects to the hydrogen networks.
In this work,an MINLP modelis constructed to analyze the removal of different impurities and identify the impurity and source(s)that should be first considered for removal,the optimaltargeted concentration,and the hydrogen network with the minimum annualcost.

Fig.1.Superstructure ofa hydrogen network.
The hydrogen network has m sources(except fresh hydrogen)and n sinks[Fig.1].Allthe components,except hydrogen,are impurities,and the totalnumber is nc.Each sink SKj(j∈[1,n])requires a minimum flow rate FSKj.Itsinletimpurity concentration should notbe higherthan the maximum allowable impurity concentration,and its operation pressure should notbe lower than.The lower limiton hydrogen concentration can be transferred to the upperlimiton the totalconcentration ofimpurities[13],so only concentrations ofimpurity are considered in this work.
Similarly,each source SRi(i∈[1,m])has a flow rate Fiand its pressure is Pi.Its impurity concentrations are Ci,k(k∈[1,nc]).Fresh hydrogen is purchased from other factories or specially produced,and its impurity concentrations and pressure are Cfresh,kand Pfresh,respectively.
In this work,impurity removers are integrated into the hydrogen network.If source SRiis puri fied with impurity k partially removed,the flow rate and pressure ofpuri fied product areand,respectively,and the concentration ofimpurity k is decreased from Ci,kto
For matches between SRiand SKj,pipe is necessary to transport hydrogen to hydrogen sinks,and it is mainly determined by distance Li,jand flow rate Fi,jbetween SRiand SKj.Furthermore,compressor is necessary if the pressure of SRiis lower than that of SKj.
For the hydrogen network,its totalcost consists of operation cost and capitalcost.The operation cost includes those for fresh hydrogen,electricity,and the operating cost of puri fier or impurity remover,while the capitalcost contains the investments ofpuri fier or impurity remover,compressors and pipes.The objective ofthis work is to target the hydrogen network with the minimum totalannualcost(TAC).This is an optimization problem with single objective,and the decision variables are the impurity and source to be removed first,and the match relation between each pair ofsink and source.
3.Mathematical Models
For a multicomponent hydrogen network,the mathematicalmodel consists four parts:(1)impurity remover section;(2)hydrogen distribution network section;(3)compressor section;(4)pipe section.
3.1.Impurity removalsection
In this work,an impurity remover is pre-installed for each stream and can separate its inlet stream(inlet feed)into two outlet streams(product and waste gas).The mass balance in an impurity remover is

where superscripts IN,RE and D represent the inlet feed,removed product and discharge ofwaste gas,respectively.Eqs.(1)and(2)are also suitable for hydrogen puri fiers.
The flow rate offeed should notbe greater than thatof the removed source,

The impurity concentrations ofremoved product cannot be higher than that of the originalsource,

Assuming that the removalprocess does not change the pressure of hydrogen sources,the pressure of the removed product equals that of the inlet feed,

The remover process can be either chemicalabsorption(absorbing H2S by MDEA)or physicaladsorption process(removing CO2by PSA).The operation costs and investments of these two processes are different.
For the chemicalabsorption,the operation cost can be calculated by

where CostREis the operation cost of the removalunit,CostADSis the consumption of energy,and CostREGis the cost of adsorbent regeneration.
Since MDEA adsorbs H2S as a ratio of 1:1,the cost of adsorbent regeneration is
正如陈宝生部长所提出的高等教育要进一步转变理念,做到“四个回归”。同样,阅读推广的最终目的和归宿还是应该回归到促进学生的品德修养和思维能力的提高上面。授人以鱼不如授人以渔,阅读推广也不应只是局限于阅读的图书的推荐,让同学们在较多的浅阅读的同时也能够深阅读,而图书馆更有责任让学生养成良好的深度阅读习惯。

For the removalunit(absorption column),the theoreticalnumber of trays N can be calculated as[14]

where m is 1.45,xINis the concentration ofabsorbents,and c is 0.In this work,the absorption factor A is assumed to be 1.
When the diameter ofremovaltower is taken as 1 m,the investment can be calculated as[15]

For the physical adsorption,its operation cost can be neglected compared with its vast investment.The investment is[16]

In order to understand the effects ofremoving different impurities on hydrogen networks,only one impurity is removed,but the number ofremoved source is not fixed,expressed as

whereis a binary variable representing whether impurity k in SRiis removed or not.
3.2.Hydrogen distribution network
Any source can match with any sink,and a source can be interrupted and mixed to match a sink.For a sink,the total flow rate of all sources matched with it cannot be lower than that of the sink,while the load of an impurity supplied by all sources cannot exceed its upper bound.

where Fi,jis the match flowrate between SRiand SKj,is the match flowrate between SKjand the removed product of SRi.
To remove productef ficiently,allproducts should be matched with hydrogen sinks.

The totalmatch flow rate ofeach hydrogen source cannotexceed its maximum flow rate.

3.3.Pipe section
Allmatches need pipe to transport hydrogen from sources to sinks.In other words,pipe is needed if the match flowrate is not 0,and whether the pipe is needed can be determined as follows.

whereis a binary variable indicating whether the pipe exists,is the upper bound of Fi,j+andis the lower bound when pipe is necessary.Note thatthe distance between sources and sinks is assumed to be the same after removing impurity.
The cost of pipe can be calculated by

where aPIPEand bPIPEare constant.
3.4.Compressor section
When the pressure ofa source is lower than thatofa sink,the source cannot be fed to the equipment corresponding to the sink,unless its pressure is lifted by compressor.The pressure difference between SKjand SRican be determined as follows[7].

whereis a binary variable representing whether the pressure of SRiis lower than thatof SKj;andare the maximum and minimum pressure differences of sources and sinks in the hydrogen network,respectively.
Then the compressed flow rate between SRiand SKjcan be determined by

The energy consumption and investment of a compressor can be calculated by

where Wi,jis the energy consumption of compressor,is the investment cost of compressor,cCOMP,dCOMP,aCOMPand bCOMPare constant,andis a binary variable determining whether a compressor is needed.
3.5.Objective function
The objective of the design is to minimize the total annual cost(TAC),

where PRfreshand PRWare the prices offresh hydrogen and work utility,respectively.
4.Case Study
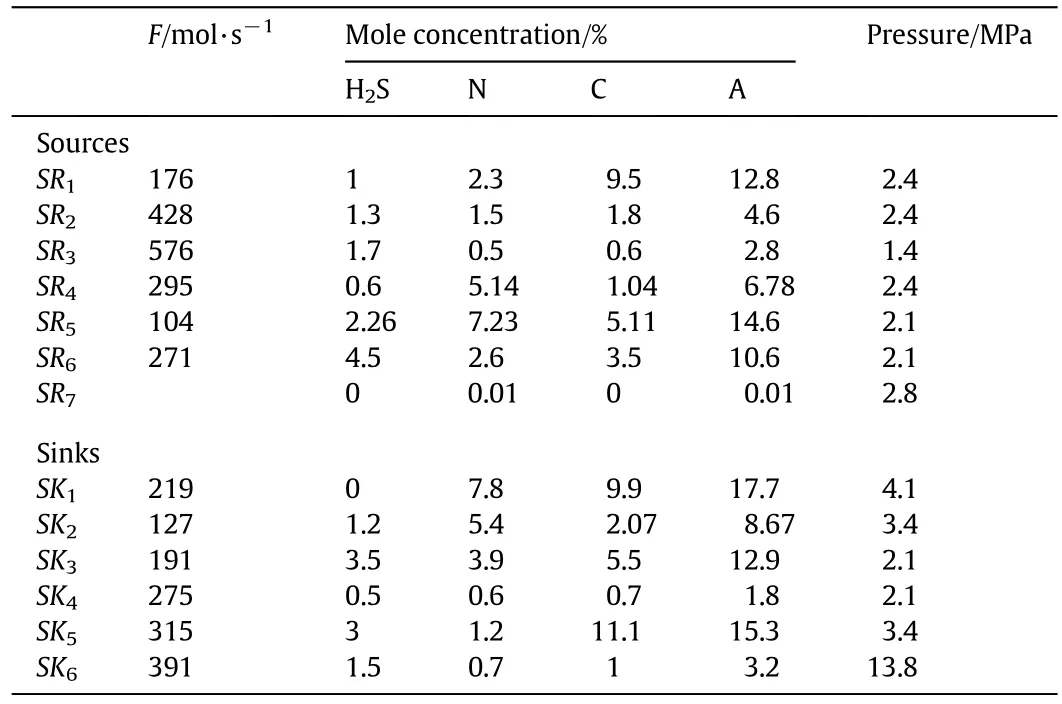
The hydrogen network of a re finery is optimized by the proposed method.The data of streams are shown in Tables 1 and 2.Among these streams,SR7is the fresh hydrogen.There are three impurities:H2S,N(represents nitride)and C(represents carbide).The concentration of impurity A represents the totalconcentration of allimpurities.The price offresh hydrogen is 0.004 USD·mol-1and thatofwork utility is 0.115 USD·(kW·h)-1.The investmentcostis averaged in 5 years.

Table 1 Data of sources and sinks[17]

Table 2 Distance between each source and sink
4.1.Hydrogen network without impurity removal
For the hydrogen network without removal unit,the hydrogen network is shown in Fig.2.The fresh hydrogen cost,compression cost,pipe cost,and totalannualcost are listed in Table 3.
Next,different scenarios for removing impurities H2S,N,and C are analyzed and compared.H2S is absorbed by EDMA and other impurities are removed by PSA.As the change ofimpurity concentration has small effect on the flow rate of source,it is neglected to simplify the MINLP model.
4.2.Removalofimpurity H2S
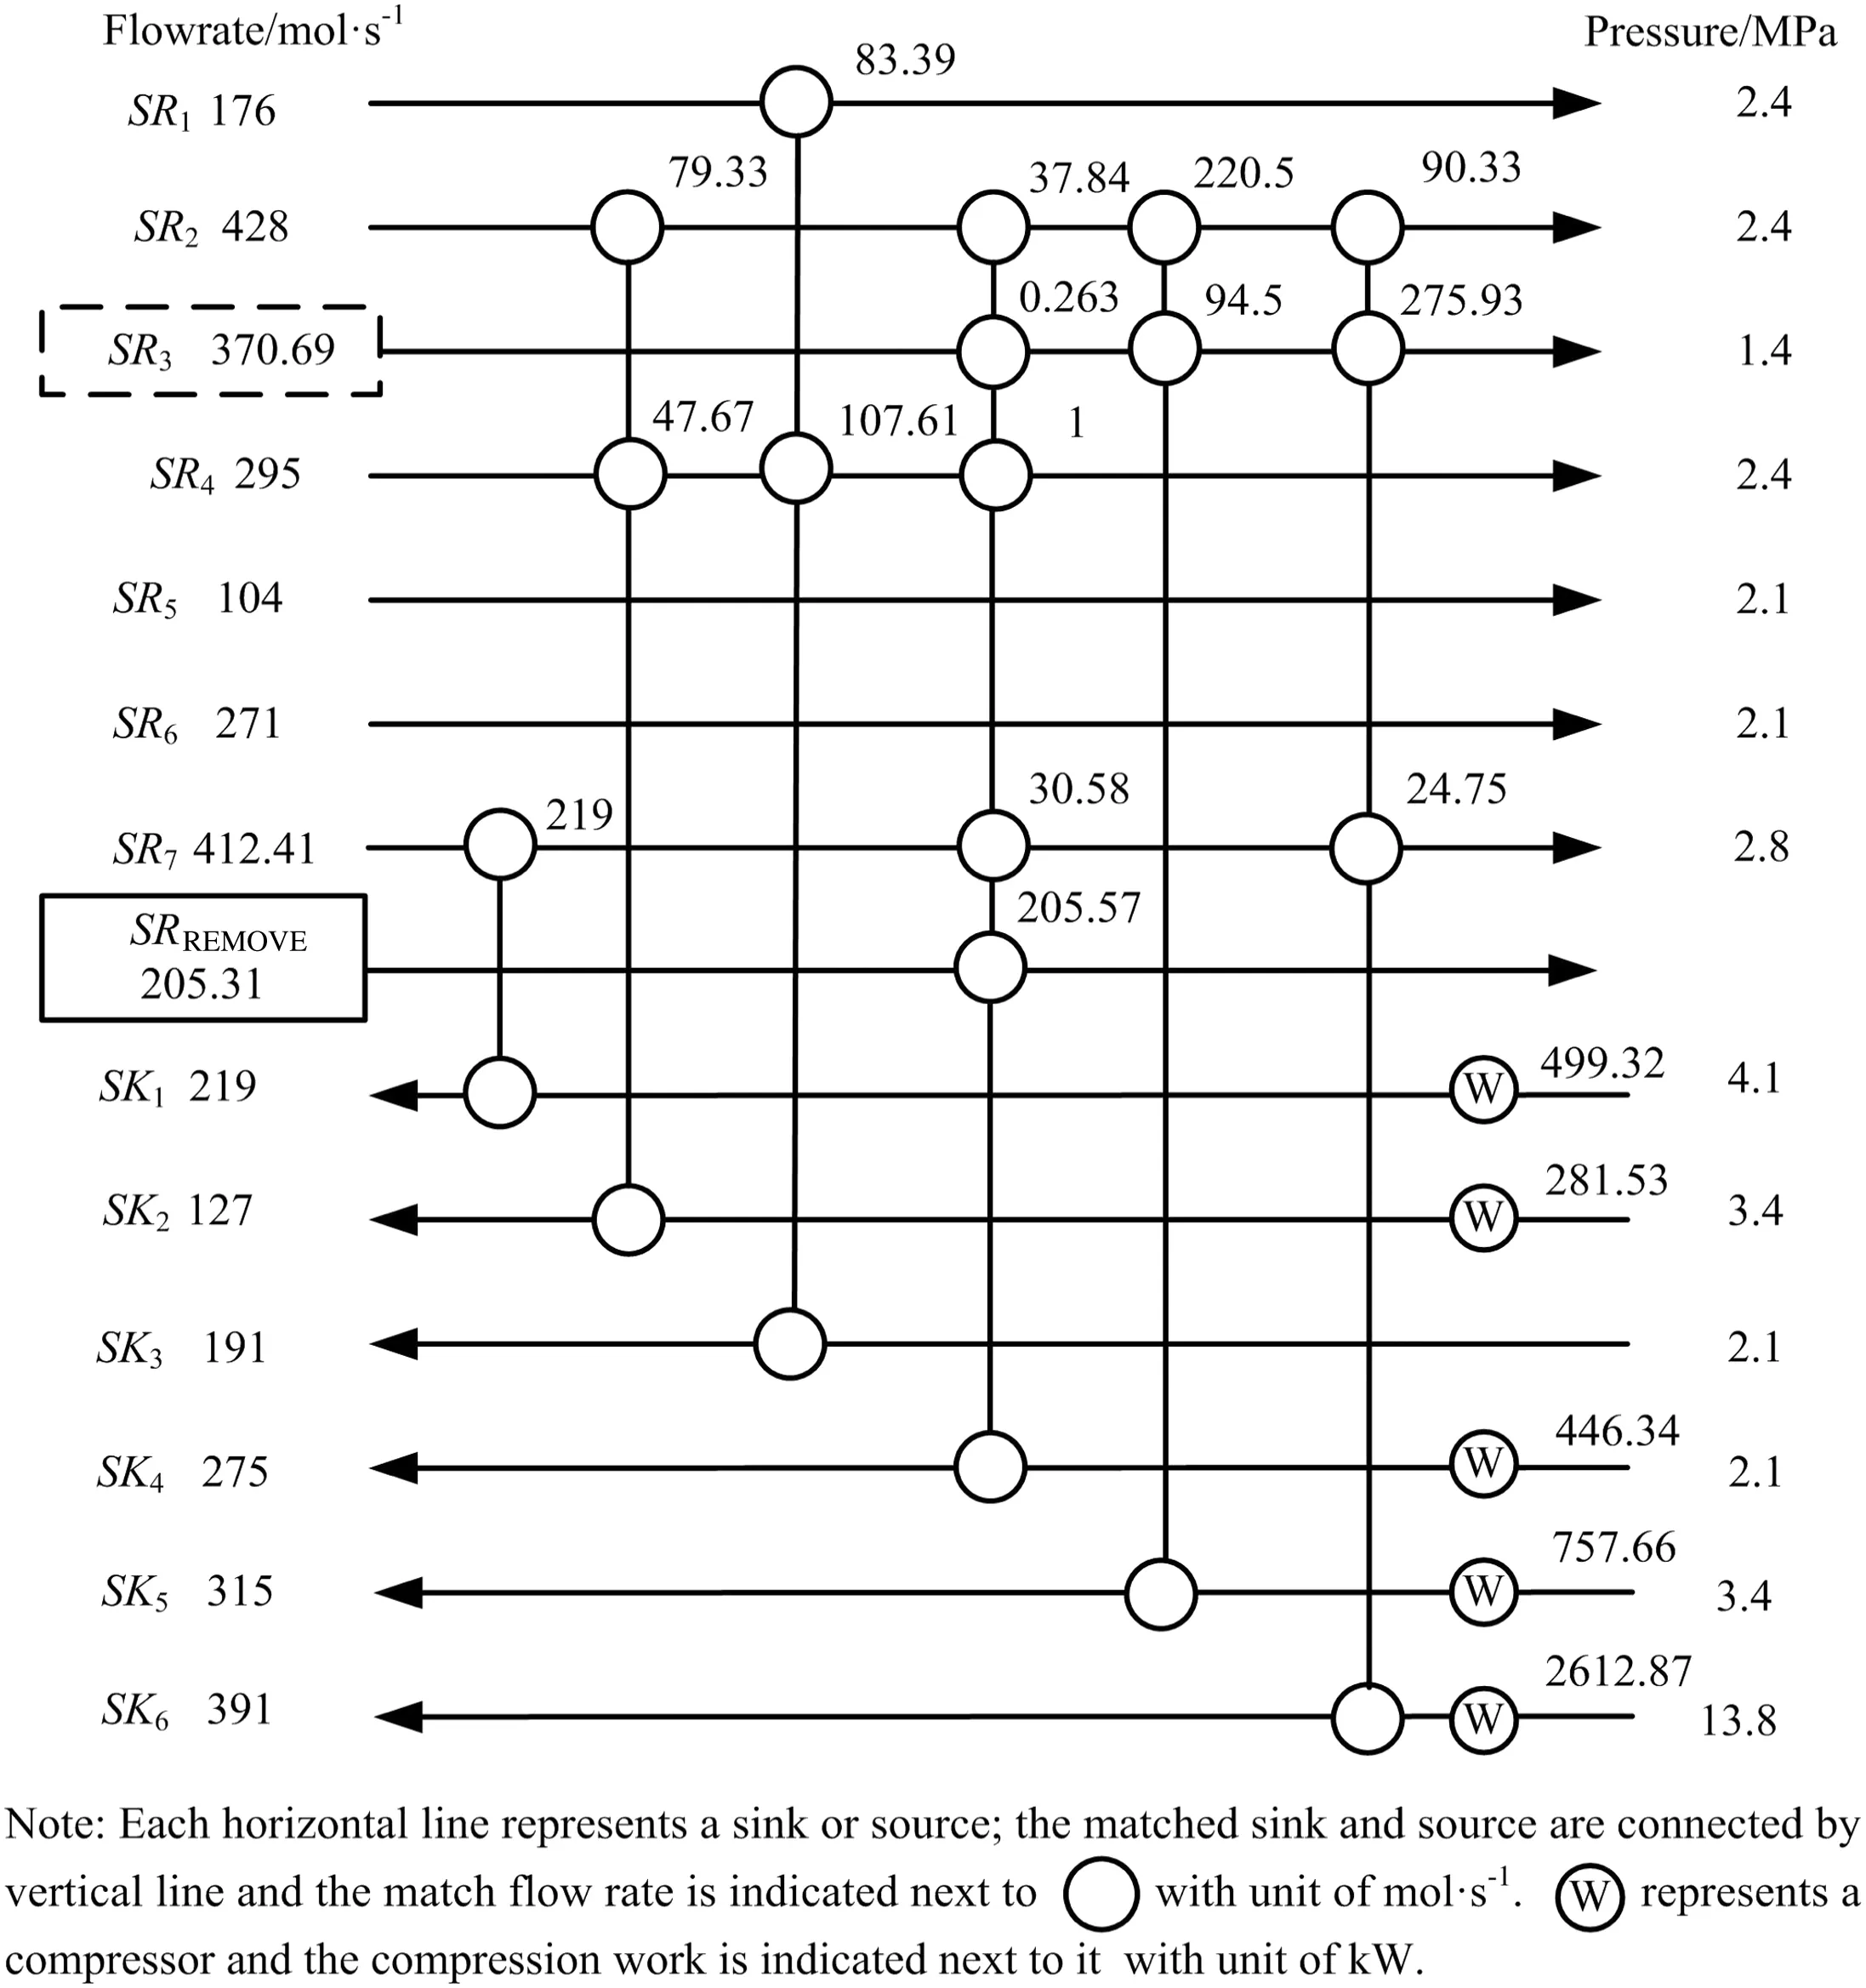
The effect ofremoving H2S is explored by the proposed model,and the MINLP problem is solved in GAMS software using solver Baron.The corresponding costs are listed in Table 4 and the hydrogen network is shown in Fig.3.The source to be treated first is SR3and the optimal flowrate of inlet feed is 205.31 mol·s-1.The targeted impurityconcentration ofH2S is 0.425%.Consequently,the costoffresh hydrogen is decreased by 14.21%and TAC is decreased by 28.44%.

Table 3 Cost without impurity removal(unit:USD·a-1)
4.3.Removalofimpurity N
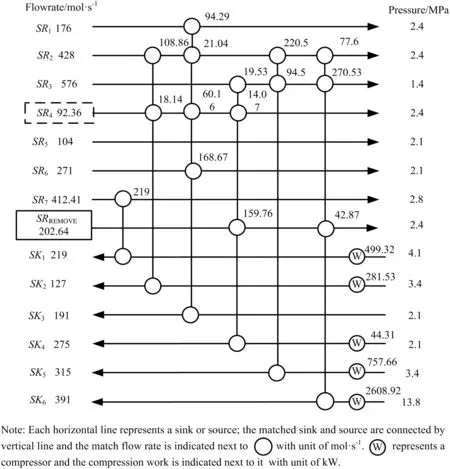
With the proposed model,the hydrogen network is optimized when impurity N is removed by PSA.The corresponding costs are listed in Table 5 and the hydrogen network is shown in Fig.4.The source to be treated first is SR4,the optimal flowrate ofinlet feed is 202.64 mol·s-1,and the targeted impurity concentration is 0.51%.The cost of fresh hydrogen decreases by 14.21%and TAC decreases by 8.14%.
Form Tables 4 and 5,although the operation cost is 0 when removing impurity N,the capitalcost is much higher than that ofremoving H2S.Because of this,removing H2S is more cost-effective than removing N.
4.4.Removalofimpurity C
The effect of removing impurity C is explored by the same way as impurity N.The hydrogen network is the same as that in Fig.2 and removing impurity C cannot decrease the totalcost.

Fig.2.Hydrogen network without removal.

Table 4 Cost ofremoving H2S(unit:USD·a-1)
4.5.Hydrogen puri fication
The effect of hydrogen puri fication is explored by the proposed model.Hydrogen is puri fied by PSA unit.The concentration ofhydrogen is denoted by that ofimpurity A.The result shows that increasing the hydrogen concentration by puri fication cannot bene fit the hydrogen network.
The results of removing different impurities are listed in Table 6.Removing impurities H2S and N reduces TAC,while removing H2S gives less TAC,so the impurity to be removed first for the hydrogen network is H2S and the corresponding stream is SR3,the optimal flowrate ofinlet feed is 205.31 mol·s-1,and the targeted impurity concentration is 0.425%.As a result,the cost of fresh hydrogen is reduced by 1.59 × 10⁷USD·a-1and the total annual cost is saved by 1.51× 10⁷USD·a-1.
5.Conclusions
An MINLP modelis developed for evaluating the removaleffect of different impurities and optimizing the hydrogen network with multiple impurities.This method can identify the impurity and source(s)that should be removed first,the optimaltargeted concentration,corresponding hydrogen network and its totalannualcost.Case study shows that the total annual cost can be reduced by 1.51×10⁷USD·a-1when the H2S concentration of SR3is decreased to 0.425%.Removal of an impurity may lead to a more cost-effective hydrogen network than purifying hydrogen.

Fig.3.Hydrogen network with H2S removed.

Table 5 Cost ofremoving N(unit:USD·a-1)

Fig.4.Hydrogen network with removing N.
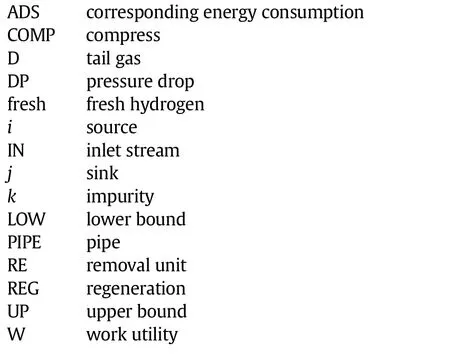
Nomenclature


Table 6 Comparison ofcosts for removing different impurities(unit:USD·a-1)
Superscripts and Subscripts

[1]V.Agrawal,U.V.Shenoy,Uni fied conceptual approach to targeting and design of water and hydrogen networks,AIChE J.52(3)(2006)1071–1082.
[2]Q.Zhang,X.Feng,G.L.Liu,K.H.Chu,A novelgraphicalmethod for the integration of hydrogen distribution systems with puri fication reuse,Chem.Eng.Sci.66(4)(2011)797–809.
[3]M.B.Yang,X.Feng,K.H.Chu,G.L.Liu,Graphicalmethod for identifying the optimal puri fication process of hydrogen systems,Energy 73(2014)829–837.
[4]M.B.Yang,X.Feng,Change rules of pinch point for hydrogen distribution systems with puri fication reuse,Huagong Xuebao/CIESC J.64(12)(2013)4544–4549.
[5]G.L.Liu,H.Li,X.Feng,C.Deng,K.H.Chu,A conceptualmethod for targeting the maximum puri fication feed flow rate of hydrogen network,Chem.Eng.Sci.88(2013)33–47.
[6]G.L.Liu,H.Li,X.Feng,C.Deng,Novelmethod for targeting the optimalpuri fication feed flow rate of hydrogen network with puri fication reuse/recycle,AIChE J.59(6)(2013)1964–1980.
[7]F.Liu,N.Zhang,Strategy ofpuri fier selection and integration in hydrogen networks,Chem.Eng.Res.Des.82(10)(2004)1315–1330.
[8]Y.Q.Jiao,H.Y.Su,Z.W.Liao,W.F.Hou,Modeling and multi-objective optimization of re finery hydrogen network,Chin.J.Chem.Eng.19(6)(2011)990–998.
[9]A.Jagannath,A.Almansoori,Modeling of hydrogen networks in a re finery using a stochastic programming appraoch,Ind.Eng.Chem.Res.53(51)(2014)19715–19735.
[10]C.Deng,H.M.Pan,Y.Li,Y.Zhou,X.Feng,Comparative analysis ofdifferent scenarios for the synthesis of re finery hydrogen network,Appl.Therm.Eng.70(2)(2014)1162–1179.
[11]C.C.Kuo,C.T.Chang,Improved modelformulations for multiperiod hydrogen network designs,Ind.Eng.Chem.Res.53(52)(2014)20204–20222.
[12]L.Zhou,Z.W.Liao,J.D.Wang,B.B.Jiang,Y.R.Yang,Hydrogen sul fide removalprocess embedded optimization of hydrogen network,Int.J.Hydrog.Energy 37(23)(2012)18163–18174.
[13]X.Jia,L.Li,G.Liu,M.Yang,Y.Liu,An extended evolutionary design method for the optimization of hydrogen networks with pressure constraint,Can.J.Chem.Eng.(2015).
[14]E.Treybal Robert,Mass-transfer operations,McGraw-Hill Book Company,1981.
[15]C.L.Chen,P.S.Hung,Simultaneous synthesis of mass exchange networks for waste minimization,Comput.Chem.Eng.29(7)(2005)1561–1576.
[16]G.P.Towler,R.Mann,A.J.L.Serriere,C.M.D.Gabaude,Re finery hydrogen management:Cost analysis of chemically-integrated facilities,Ind.Eng.Chem.Res.35(7)(1996)2378–2388.
[17]X.F.Wang,Z.Wang,H.P.Zhao,Z.Y.Liu,A procedure for design ofhydrogen networks with multiple contaminants,Chin.J.Chem.Eng.23(9)(2015)1536–1541.
猜你喜欢
杂志排行
Chinese Journal of Chemical Engineering的其它文章
- Heat transfer ofnano fluidics in hydrophilic pores:Insights from molecular dynamics simulations☆
- Numericalsimulation ofstirred tanks using a hybrid immersed-boundary method☆
- Numericalsimulation ofmicromixing effect on the reactive flow in a co-rotating twin screw extruder☆
- Coalescence behaviour ofwater droplets in water-oilinterface under pulsatile electric fields
- Effects of Sn residue on the high temperature stability of the H2-permeable palladium membranes prepared by electroless plating on Al2O3 substrate after SnCl2–PdCl2 process:A case study☆
- Application ofdiffusive transport modelfor better insight into retardation mechanisms involved in ion-imprinted membrane transport
