MR定量磁敏感图评估大脑灰质核团的引流静脉磁敏感值与铁沉积的相关性研究
2016-04-17左超柴超夏爽
左超,柴超,夏爽*
MR定量磁敏感图评估大脑灰质核团的引流静脉磁敏感值与铁沉积的相关性研究
左超1,柴超2,夏爽2*

目的 采用MR定量磁敏感图测量不同年龄正常志愿者大脑灰质核团引流静脉的磁敏感值,观察其随年龄的变化趋势,以及与大脑灰质核团铁沉积的相关性。材料与方法使用Siemens 3.0 T MR,对57名正常志愿者进行磁敏感加权成像(SWI)扫描,获得相位图及幅度图,采用磁敏感图像成像与相位伪影消障工具(SMART)软件对相位图和幅度图进行处理得到定量磁敏感图(QSM),利用核磁共振信号处理(SPIN)软件在QSM上画出双侧大脑灰质核团引流静脉(丘脑纹状体静脉、透明隔静脉、大脑内静脉、基底静脉)及双侧大脑灰质核团(尾状核、苍白球、壳核、背侧丘脑、黑质、红核)的感兴趣区,然后分别测出不同静脉及灰质核团的磁敏感值。结果57名正常志愿者左右两侧大脑灰质核团引流静脉磁敏感值无统计学差异(P值均>0.05)。57名正常志愿者两侧尾状核、黑质、红核的磁敏感值差异具有统计学意义,右侧高于左侧(t值分别为3.34、5.12、3.91, P值均<0.05)。右侧丘脑纹状体静脉的磁敏感值与年龄呈正相关(r=0.33, P<0.05)。左侧尾状核与左侧大脑内静脉、左侧壳核与左侧大脑内静脉、左侧红核与左侧大脑内静脉的磁敏感值呈正相关(r值分别为0.29、0.31、0.28, P值均<0.05)。结论右侧丘脑纹状体静脉磁敏感值随年龄增长有增加的趋势,大脑灰质核团引流静脉磁敏感值无侧别差异。部分大脑灰质核团铁沉积与其引流静脉磁敏感值呈正相关。
定量磁敏感图;血氧饱和度;铁沉积;年龄分布
Received 22 Dec 2015, Accepted 25 Jan 2016
ACKNOWLEDGMENTSThis study was supported by Grants the National Natural Science Foundation of China (No. 81501457). Tianjin Municipal Health Bureau Key Research Fund (No. 14KG103).
静脉血氧饱和度是评估脑功能及脑组织发育程度的重要指标[1],氧代谢是脑的能量需求的主要来源,大脑占体重的2%,但是却消耗总能量的20%[2]。铁元素是人脑必不可少的元素之一,其主要以非血红素铁的形式分布于脑组织中[3]。脑铁含量的测定具有重要的意义,可以进一步的了解脑的生长发育及退变过程,同样对相关神经系统疾病的诊疗具有重要作用。有研究表明,脑铁含量与静脉血氧饱和度,有一定相关性,脑铁沉积的过程是一个耗氧的过程[4]。MR定量磁敏感图不仅可以对脑铁含量进行定量分析[5-7],同时也可以对静脉血氧饱和度进行定量分析[8],静脉的血氧饱和度可以通过测量静脉的磁敏感值获得[9],Δχveintissue代表磁敏感值,Y代表血氧饱和度,Δχdo代表每单位血球容积内缺氧血与全氧血的磁敏感值(4πχ 0.27 ppm)[10],κ是一个常量,依赖于几何和磁场强度。Hct代表软脑膜静脉的红细胞容积分数,Δχ与Y可以通过以下公式进行换算:Δχvein-tissue= KΔχdo. Hct(1-Y)。
从而可以对脑铁沉积与脑静脉血氧饱和度的关系进行评估。本研究收集正常志愿者并对灰质核团铁沉积与相应引流静磁敏感值进行评估,从而探讨二者之间的相关性。
1 材料与方法
1.1 临床资料
2012年11月至2014年9月招募57名健康志愿者,男22名,女35名,年龄20~70岁,平均年龄(38±13)岁。
1.2 纳入及排除标准
所有志愿者均为右利手并且年龄大于18岁。所有入组志愿者行常规MR扫描未见明显异常,且经临床检查排除精神神经及其他影响神经系统的躯体疾患。本研究经医院伦理委员会同意,所有志愿者均被告知研究内容并签署知情同意书。
1.3 MR设备及检查方法
本研究采用德国Siemens Magnetom Trio Tim 3.0 T超导磁共振扫描仪,8通道标准头线圈。行T1WI、T2WI等常规MR及磁敏感加权成像(SWI)检查。
1.3.1 常规MR扫描参数
横断面FSE T2WI:TR 6000.0 ms,TE 93.0 ms,反转角120°,采集时间1.25 min,FOV 179 mm× 220 mm,采集层数25,层厚4.0 mm,层间距1.2 mm,像素大小0.7 mm×0.7 mm×4.0 mm;横断面SE T1WI:TR 500.0 ms,TE 8.9 ms,反转角120°,采集时间2.83 min,FOV 206 mm×220 mm,扫描层数25,层厚4.0 mm,层间距1.2 mm,像素大小0.9 mm× 0.9 mm×4.0 mm。
1.3.2 SWI扫描参数
横断面SWI:TR 29.0 ms,TE 20.0 ms,反转角15°,采集时间5.34 min,FOV 129 mm× 230 mm,扫描层数56层,层厚2.0 mm,层间距0.4 mm,像素大小0.5 mm×0.5 mm×2.0 mm。
1.4 图像处理及统计分析
1.4.1 SWI图像处理
采用美国韦恩州立大学提供的磁敏感图成像与相位伪影消障工具(susceptibility mapping and phase artifacts remova1 too1box,SMART)软件对SWI原始相位图和幅度图进一步处理,获得定量磁敏感图(quantitative susceptibility mapping, QSM)[11]。处理步骤[12]:(1)通过SWI序列获得高分辨率的3D SWI数据;(2)利用SWI中的原始相位图和幅度图,对相位图进行32×32的高通滤波;(3)使用内插技术,将0填充到相位图的k空间,使3个方向的矩阵大小为512×512×128,从而保持FOV在X、Y、Z三个方向的纵横比为1∶1∶4,同时消除傅里叶转换及使用反转滤波产生的伪影;(4)进行颅骨剥离及算法,采用复合阈值消除相位图上非组织区域的伪影[13];(5)对高通滤波相位图的傅里叶转换过程中施加标准反转滤波。
1.4.2 感兴趣区的选取
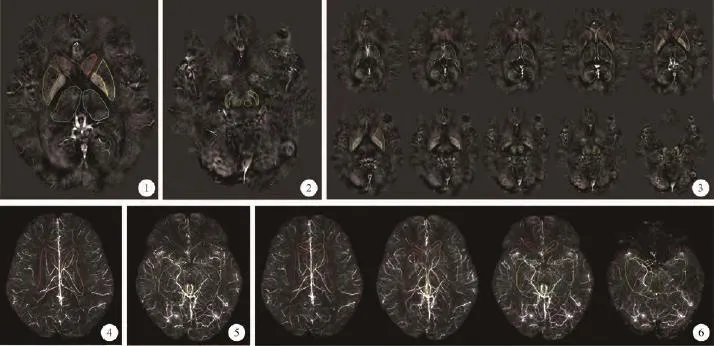
采用核磁共振信号处理(signal processing innuclear magnetic resonance, SPIN)软件定量测量磁敏感图中兴趣区 (region of interest, ROI)的磁敏感值。ROI包括双侧灰质核团(尾状核、苍白球、壳核、背侧丘脑、黑质、红核)(图1~3)及双侧灰质核团的引流静脉(透明隔静脉、丘脑纹状体静脉、大脑内静脉、基底静脉)(图4~6)。核团ROI的选择标准[7]:参考核团的解剖结构,根据在磁敏感图上显示的核团边界的连续层面 ,同时避开因核团周围铁的双极效应产生的高信号。大脑灰质核团引流静脉ROI选择标准:在磁敏感图上能够清晰显示大脑静脉的连续层面,同一半球的丘脑纹状体静脉(图4)、透明隔静脉(图4)、大脑内静脉(图5)、基底静脉(图5),将每组静脉作为一个整体,采用同一颜色表示(图6)。ROI的选取范围为包括相应静脉全长的封闭区域,同时应注意避开测量区气颅交界区及脑室系统的影响。ROI的选取主要是考虑到测量的可操作性,血管显示清晰、走行较固定,可对每名志愿者进行测量等因素。
1.5 统计学方法
采用SPSS17.0软件。所有数据的正态性检验采用单样本K-S检验。左右两侧大脑灰质核团引流静脉的磁敏感值差异、左右两侧大脑灰质核团的磁敏感值差异采用配对t检验比较,双侧大脑灰质核团引流静脉的磁敏感值与年龄的相关性、双侧大脑灰质核团磁敏感值与其引流静脉磁敏感值的相关性采用Pearson相关分析。P<0.05为差异有统计学意义。
2 结果
2.1 两侧大脑灰质核团引流静脉的磁敏感值比较
双侧丘脑纹状体静脉、透明隔静脉、大脑内静脉、基底静脉磁敏感值差异均无统计学意义(P>0.05)(表1)。

图1 ~3 大脑灰质核团磁敏感值测量的ROI示意图。图1显示从前向后依次为双侧尾状核、苍白球(内侧)及壳核(外侧)、背侧丘脑ROI。图2显示双侧黑质(外侧)、 红核(内侧)ROI。图 3显示每组核团作为一个整体,连续画出核团的ROI,同一颜色代表同一核团 图4~6 大脑灰质核团引流静脉磁敏感值测量的ROI示意图。图4显示从前向后依次为两侧透明隔静脉、两侧丘脑纹状体静脉ROI。图5显示从前向后依次为两侧基底静脉、两侧大脑内静脉(内侧)ROI。图6显示每组静脉作为一个整体,连续画出静脉的ROI,同一颜色代表同一静脉Fig. 1—3 The ROIs of gray nuclei for the measurement of susceptibility. Fig.1: Front to back, there were the ROIs of bilateral caudate nucleus, globus pallidus, putamen and dorsal thalamus. Fig.2: Front to back, there were the ROIs of bilateral substantia nigra and red nucleus. Fig.3: Each of the gray nuclei was considered as a whole one, the ROIs of gray nuclei were drawn on the continuous slices, the same colour indicated the same gray nuclei. Fig.4—6 The ROIs of drainage veins for the measurement of cerebral venous susceptibility. Fig.4: Front to back. There were the ROIs of bilateral septal veins and thalamostriate veins. Fig.5: Front to back. There were the ROIs of bilateral basal veins and internal cerebral veins. Fig. 6: Each of the veins was considered as a whole one, the ROIs of cerebral veins was drawn on the continuous slices, the same colour indicated the same cerebral veins.

表1 57名志愿者左、右侧大脑灰质核团引流静脉磁敏感值比较 [ppb(×10–9)]Tab. 1 The comparison of susceptibility of the right and left draining veins of cerebral gray nuclei in 57 healthy individuals [ppb(×10–9)]
2.2 两侧大脑灰质核团的磁敏感值比较
双侧尾状核、黑质、红核的磁敏感值差异具有统计学意义,均为右侧高于左侧(表2)。

表2 57名志愿者大脑灰质核团左、右侧磁敏感值比较[ppb(×10–9)]Tab. 2 The comparison of susceptibility of the right and left cerebral gray nuclei in 57 healthy individuals [ppb(×10–9)]
2.3 两侧大脑灰质核团引流静脉磁敏感值与年龄的相关性
右侧丘脑纹状体静脉磁敏感值与年龄呈正相关(r值为0.33, P<0.05)(图7),其余脑静脉的磁敏感值与年龄均无相关性(P值均>0.05)。
2.4 两侧大脑灰质核团引流静脉磁敏感值与灰质核团铁沉积的相关性
左侧尾状核与左侧大脑内静脉、左侧壳核与左侧大脑内静脉、左侧红核与左侧大脑内静脉的磁敏感值均呈正相关(r值分别为0.29、0.31、0.28; P值均<0.05)(图8)。
3 讨论
基底节区的灰质核团包括两侧的尾状核、壳核、苍白球及背侧丘脑,根据人脑血管解剖研究[14],其引流静脉包括两侧透明隔静脉、丘脑纹状体静脉及大脑内静脉,两侧红核、黑质的引流静脉包括两侧基底静脉及两侧大脑中深静脉,由于两侧大脑中深静脉走行区伪影较重,因而两侧红核、黑质的引流静脉仅选取两侧基底静脉。MR定量磁敏感图可以定量、无创提供氧代谢的信息[15]。目前,已经应用于脑卒中、创伤性颅脑损伤等临床疾病的研究,Xia等[8]利用定量磁敏感图观察卒中病人的患侧大脑皮层静脉增粗、信号增高,并与对侧及正常人群大脑皮层静脉对比,血氧饱和度明显减低。Liu等[12]采用定量磁敏感图测量创伤性颅脑损伤病人静脉内的血氧饱和度及不规则微出血的铁含量,通过对两者的比较分析,能够鉴别微出血灶与静脉及周围组织。这些研究均证实了定量磁敏感图对脑内静脉血氧饱和度测量的可行性。
3.1 左右两侧大脑灰质核团引流静脉磁敏感值的差异
本研究结果显示,正常志愿者左右两侧大脑灰质核团引流静脉磁敏感值没有差异,即两侧血氧饱和度存在一致性,唐乐梅[16]、冯洁[4]的研究表明,正常人群中的大脑深静脉血相位值无侧别的差异,本研究中的大脑灰质核团引流静脉均属于大脑深静脉,考虑原因为左右两侧大脑灰质核团引流静脉对称性分布,其起始点面积均相似,即无引流优势[17]。从解剖学上看,血管的管径相似,且血管的走行位置相对固定,受周围组织的影响差别不大,因此两侧无明显差异。
3.2 左右两侧大脑灰质核团铁含量的分布
正常志愿者的尾状核、黑质、红核的铁含量均右侧高于左侧,表明左右两侧大脑灰质核团铁含量存在不对称性。有研究通过对人脑标本的组织化学分析,表明脑铁分布不均匀[18]。夏爽等[7]研究表明尾状核、黑质、红核及齿状核的铁含量均为右侧大于左侧,表明左右两侧脑铁含量存在不对称性。有学者研究认为此现象可能与多巴胺系统及人脑的偏侧运动优势有关[19]。另外,ROI的选取、成像方式的选择及志愿者的选取,可能都会对本结果造成相应的影响。
3.3 大脑灰质核团引流静脉磁敏感值与年龄的相关性
本研究发现,右侧丘脑纹状体静脉的磁敏感值与年龄存在弱相关性,余灰质核团引流静脉的磁敏感值均与年龄均不存在相关性。丘脑纹状体静脉是基底节区灰质核团的主要引流静脉,引流尾状核、壳核、苍白球及背侧丘脑等静脉血,冯洁[4]的研究表明丘纹上静脉的静脉血相位值与双侧尾状核、壳核、苍白球铁含量呈正相关,夏爽等[7]的研究表明双侧尾状核、壳核的铁含量随年龄有增长的趋势,考虑右侧丘脑纹状体静脉磁敏感值随年龄增长与这些因素有关。然而,唐乐梅[16]的研究表明脑静脉血相位与年龄不存在相关性,即不同年龄的正常人群静脉血氧饱和度没有明显差异,刘铁利等[20]研究表明同一静脉血相位值在各年龄组间无统计学意义,即年龄对静脉血氧饱和度不存在明显影响。另外,考虑在测量过程中,受血管走行方向、区域等因素的影响,使得测量结果存在误差,因而,本研究结果需要进一步证实。

图7 57名志愿者右侧丘脑纹状体静脉磁敏感值与年龄相关性的散点图,右侧丘脑纹状体静脉磁敏感值与年龄呈正相关(r=0.33,P<0.05) 图8 左侧尾状核与左侧大脑内静脉(A)、左侧壳核与左侧大脑内静脉(B)、左侧红核与左侧大脑内静脉(C)的磁敏感值均呈正相关(r值分别为0.29、0.31、0.28,P值均<0.05)Fig. 7 The scatter diagram of the correlation between the susceptibility of right thalamostriate vein and age. There was a positive correlation between age and the susceptibility of right thalamostriate vein (r=0.33, P<0.05). Fig. 8 There were positive correlations between the susceptibility of left caudate nucleus and left internal cerebral vein (A), left putamen and left internal cerebral vein (B), left red nucleus and left internal cerebral vein (C)(r value was 0.29, 0.31, 0.28, P<0.05).
3.4 大脑灰质核团引流静脉磁敏感值与大脑灰质核团铁沉积的相关性
本研究结果显示,左侧尾状核与左侧大脑内静脉、左侧壳核与左侧大脑内静脉、左侧红核与左侧大脑内静脉的磁敏感值呈正相关,表明大脑灰质核团铁沉积是一个耗氧的过程。解剖学上[14],基底节区的引流静脉包括左右两侧的透明隔静脉,丘脑纹状体静脉,大脑内静脉,红核、黑质的引流静脉包括基底静脉,大脑内静脉主要由丘脑纹状体静脉、透明隔静脉及脉络膜上静脉组成,收纳来自透明隔、丘脑、内囊、基底神经节、胼胝体、侧脑室以及第三脑室脉络丛的静脉血。组织学研究表明,由于脑组织具有血脑屏障,铁蛋白由血液进入脑组织主要是由位于毛细血管上皮细胞上的转铁蛋白载体,受体介导的胞饮过程来完成的,而这是一个耗氧的生物过程。冯洁[4]的研究表明基底静脉、丘纹上静脉血相位值与双侧尾状核头、苍白球、壳核呈正相关(P<0.05),部分研究结果也印证了本研究的结果。
3.5 不足与展望
本研究尚存在一些不足,考虑在测量磁敏感值的过程中,受血管走行方向、区域等因素的影响,使得测量结果存在误差。另外,本研究样本量少,性别、年龄分布不均,因而使统计结果有所偏倚,今后的研究中进一步增加样本量,并使性别年龄分布均匀,以掌握健康人群大脑灰质核团与其引流静脉血氧饱和度的关系,从而为临床疾病的预测及治疗提供更准确的依据。
[References]
[1]Fan AP, Benner T, Bolar DS, et al. Phase-based regional oxygen metabolism (PROM) using MRI. Magn Reson Med, 2012,67(3):669-678.
[2]Magistretti PJ, Pellerin L. Cellular mechanisms of brain energy metabolism and their relevance to functional brain imaging. Philos Trans R Soc Lond B Biol Sci,1999, 354(1387): 1155-1163.
[3]Hingwala DR, Kesavadas C, Thomas B, et al. Susceptibility weighted imaging in the evaluation of movement disorders. Clin Radiol, 2013, 68(6): e338-e348.
[4]Feng J. The correlation study of intracranial venous blood oxygen level and iron deposition of deep gray nuclei in multiple sclerosis. Dalian Med University, 2013.
冯洁. 多发性硬化患者颅内静脉血氧水平和深部灰质核团铁沉积的关联性研究. 大连医科大学, 2013.
[5]Xia S, Zheng G, Shen W, et al. Quantitative measurements of brain iron deposition in cirrhotic patients using susceptibility mapping. Acta Radiol, 2015, 56(3): 339-346.
[6]Chai C, Yan S, Chu Z, et al. Quantitative measurement of brain iron deposition in patients with haemodialysis using susceptibility mapping. Metab Brain Dis, 2015, 30(2): 563-571.
[7]Xia S, Chai C, Shen W, et al. Preliminary study of distribution and age-related changes of iron-content in the brain using MR quantitative susceptibility mapping. Chin J Radiol, 2014, 48(9): 730-735.
夏爽, 柴超, 沈文, 等. MR定量磁敏感图评估正常人脑铁含量的初步研究. 中华放射学杂志, 2014, 48(9): 730-735.
[8]Xia S, Utriainen D, Tang J, et al. Decreased oxygen saturation in asymmetrically prominent cortical veins in patients with cerebral ischemic stroke. Magn Reson Imaging, 2014, 32(10): 1272-1276.
[9]Haacke EM, Lai S, Reichenbach JR, et al. In vivo measurement of blood oxygen saturation using magnetic resonance imaging: a direct validation of the blood oxygen level-dependent concept in functional brain imaging. Hum Brain Mapp, 1997, 5(5): 341-346.
[10]Fernández-Seara MA, Techawiboonwong A, Detre JA, et al. MR susceptometry for measuring global brain oxygen extraction. Magn Reson Med, 2006, 55(5): 967-973.
[11]Haacke EM ,Tang J, Neelavalli J, et al. Susceptibility mapping as a means to visualize veins and quantify oxygen saturation. J Magn Reson Imaging, 2010, 32(3): 663- 676.
[12]Liu J, Xia S, Hanks RA, et al. Susceptibility weighted imaging and mapping of micro-hemorrhages and major deep veins after traumatic brain injury. J Neurotrauma, 2016, 33(1): 10-21.
[13]Pandian DS, Ciulla C, Haacke EM, et al. Complex threshold method for ldentifying pixels that contain predominantly noise in magnetic resonance images. J Magn Reson Imaging, 2008, 28(3): 727-735.
[14]Monica P, Lydia G, Dheeraj G. Cerebral venous development in relation to developmental venous anomalies and vein of Galen aneurysmal malformations. Semin Ultrasound CT MR, 2011, 32(3): 252-263.
[15]Jensen KU, Böhm R. Asymmetrically hypointense veins on T2w imaging and susceptibility-weighted imaging in ischemic stroke. World J Radiol, 2013, 5(4): 156-165.
[16]Tang LM. Susceptibility-weighted image, MRV and PC-cine studies of healthy people and patients with multiple sclerosis. Tianjin Med University, 2014.
唐乐梅. 磁敏感加权成像、磁共振静脉成像及相位对比电影法对健康人与多发性硬化的研究. 天津医科大学, 2014.
[17]Li WH. The study on deep cerebral vein with 64-slice spiral CT angiography and clinical application. Luzhou Med College, 2012.
李文欢. 大脑深静脉的64层螺旋CT成像研究及临床应用. 泸州医学院, 2012.
[18]Rouault TA. Iron on the brain. Nat Genet, 2001, 28(4): 299-300.
[19]Zhang JG, Hu CH. Susceptibility weighted imaging study on the distribution and age-related changes of iron content in brain nuclei. J Pract Radiol, 2012, 28(8): 1159-1163.
张京刚, 胡春洪. 正常人脑核团铁含量分布及年龄相关性MR磁敏感成像初步研究. 实用放射学杂志, 2012, 28(8): 1159-1163.
[20]Liu TL, Zhang JW, Tan YM, et al. Assessment of cerebral venous phase values in healthy adults with susceptibilityweighted imaging. Chin J Med Imaging Technol, 2013, 28(2): 197-201.
刘铁利, 张竞文, 谭艳梅, 等. 磁敏感加权成像技术评估正常人群脑静脉血相位值. 中国医学影像技术, 2013, 28(2): 197-201
The correlation between iron deposition of deep gray nuclei and cerebral venous susceptibility of drainage veins in healthy people using susceptibility mapping
ZUO Chao1, CHAI Chao2, XIA Shuang2*1Tianjin University of Traditional Chinese Medicine, Tianjin 300193, China
2Tianjin First Center Hospital, Department of Radiology, Tianjin 300192, China
Objective:To evaluate age-related changes of cerebral venous susceptibility and the relationship between iron deposition of deep gray nuclei and the susceptibility of cerebral drainage veins in healthy people using MR quantitative susceptibility mapping (QSM).Materials and Methods:Fifty-seven right-handed healthy individuals underwent SWI scanning to get phase images and magnitude images. QSM were reconstructed from the phase images and magnitude images using SMART software. The regions of interest include the bilateral cerebral veins (thalamostriate veins, septal veins, internal cerebral veins, basal veins) and the bilateral gray nuclei (caudate nucleus, globus pallidus, putamen, dorsal thalamus, substantia nigra, red nucleus) were drawn manually, and the susceptibility of cerebral gray nuclei and cerebral draining veins was measured using SPIN software.Results:There was no significant difference in susceptibility between the right and the left draining veins of cerebral gray nuclei in 57 healthy individuals (P>0.05). The susceptibility of right caudate nucleus, substantia nigra, red nucleus was higher than that of left sides (t value was 3.34, 5.12, 3.91, P<0.05). There was positive correlation between age andthe susceptibility of right thalamostriate vein (r=0.33, P<0.05). There were positive correlation of susceptibility between left caudate nucleus and left internal cerebral vein, left putamen and left internal cerebral vein, red nucleus and left internal cerebral vein (r value was 0.29, 0.31, 0.28, P<0.05). Conclusions: The susceptibility of right thalamostriate vein increased with aging.There was no side-difference in susceptibility between bilateral cerebral veins. The susceptibility of some draining veins has positive correlation with iron deposition of some gray nuclei.
Quantitative magnetic susceptibility maping; Oxygen saturation; Iron deposition; Age distribution
国家自然科学基金(编号:81501457);天津市卫生局重点攻关基金(编号:14KG103)
1. 天津中医药大学,天津 300193
2. 天津市第一中心医院放射科,天津300192
夏爽,E-mail: xiashuang77@163.com
2015-12-22接受日期:2016-01-25
R445.2;R742
A
10.12015/issn.1674-8034.2016.05.006左超, 柴超, 夏爽. MR定量磁敏感图评估大脑灰质核团的引流静脉磁敏感值与铁沉积的相关性研究. 磁共振成像, 2016, 7(5): 347–352.
*Correspondence to: Xia S, E-mail: xiashuang77@163.com
