捕捉微通道内Taylor流特性的一种渐变网格划分方法
2016-04-10李根浩袁希钢宋文琦
李根浩,袁希钢,宋文琦
(天津大学化工学院,化学工程联合国家重点实验室,天津 300072,中国)
1 Introduction
Taylor flow is the main flow pattern in microchannels(diameter<1mm)[1-5]. Taylor flow consists of series of gas bubbles which are separated by liquid slugs. The length of gas bubble is larger than the channel diameter and a thin liquid film separates bubble from the channel wall. Taylor flow has advantage in intensifying heat and mass transfer because of the recirculation within liquid slugs and the weakening of axial mixing between liquid slugs[6-10].
CFD simulation has been extensively used as and shown to be a tool in detailed study of flow characteristics of Taylor flow in microchannels.In earlier studies,some researchers[11-13]assumed a bubble shape and set the flow conditions around the bubble using periodic boundary conditions to simulate Taylor flow. With the development of various interface capturing techniques, the volume of fluid (VOF) model[9,14], level-set method[15]and phase-field method[16]were applied. The literatures reveal that the liquid film near the wall, which is an important fluid dynamic character in microchannels, could not be properly captured if the mesh resolutions for the CFD computing was low[14,17-19]. Some researchers were able to seize the liquid film, but at the expense of a veritable increase in computing resources[9,17]. Therefore, a trade-off between the fine resolution for the liquid film and the computing efficiency is an issue for the research of fluid dynamic of Taylor flow by CFD method.
The aim of the present paper is to numerically study the hydrodynamic characteristics of Taylor flow(i.e. liquid film thickness, gas hold-up, bubble velocity, pressure drop per unit length and slug length) in microchannels with a gradient mesh approach.Simulations are performed to propose proper rules for the gradient mesh approach so as to capture the liquid film. The simulations are validated by comparing the results with correlations and experimental data. Through analyzing the influence of liquid film on gas and liquid slug lengths,new correlations of slug length based on the previous correlations and our simulation data are also proposed.
2 Modeling of Taylor flow in a T-junction microchannel
2.1 Geometry model
As shown in Fig.1, the gas and liquid phases are fed separately into the two inlets of the vertical mixing zone prior to entering the horizontal flow zone. The cross-sectional width of the channel is represented bydand the length of mixing zone and flow zone is 9dand 27d, respectively.
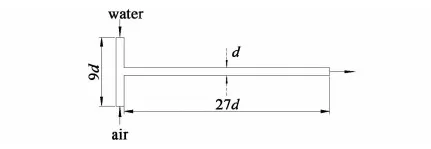
Fig.1 A T-junction microchannel model used in our simulations
The assumptions adopted in the present work are as follows:Because the cross-sectional size of microchannel is small, the fluid flow is considered as laminar.Both the gas and liquid phases are incompressible since the pressure drop along the channel is relatively small.The physical properties of both phases are constant.As Hazel and Heil[20]stated, the influence of gravity can be ignored whenBo<1, which is the case in the present work.And the system is assumed to be isothermal.
2.2 Governing equations
In order to track the gas-liquid interface and capture the liquid film between the bubbles and the channel wall, the volume of fluid (VOF) method is adopted in our computation.The governing equations of the VOF formulations on two-phase flow are as follows:
Continuity equation:
(1)
Momentum equation:
p+
·[μ(
(2)
Volume fraction equation:
αG=0
(3)
In the present work, the continuum surface force (CSF) proposed by Brackbill is adopted as the surface tension model[21].
2.3 Proposed gradient mesh approach
Different mesh approaches have been adopted in various numerical simulation cases by many researchers[9, 14,17-19], including uniform coarse mesh, uniform fine mesh and non-uniform mesh.
However, it is still hardly achievable to predict the hydrodynamics of Taylor flow accurately with a high computing efficiency. In the present work, a gradient mesh approach is proposed to tackle this issue
The proposed gradient mesh is shown in Fig.2. The meshed region for the computing is divided into two zones, the uniform mesh zone and near wall refined mesh zone. The size of the meshes in the uniform mesh zone ish. In the refined mesh zone, the size of the finest mesh nearest to the wall isφand the size of the second row meshes near the wall isφ×k1, the size of the third row isφ×k2and so forth. Thus, the width of the refined mesh zone is given by
(4)
whereiis the number of the last row of the refined mesh zone as shown in Fig.2. According to the definition of the two zones, we also have
h=φ×ki
(5)
There are five parameters in equations (4) and (5), and thus three of them need to be specified in order to define the gradient mesh system. In general,h, the mesh size in the uniform zone, can be determined by checking the mesh independency of the simulated results on the Taylor flow characters, like bubble length.
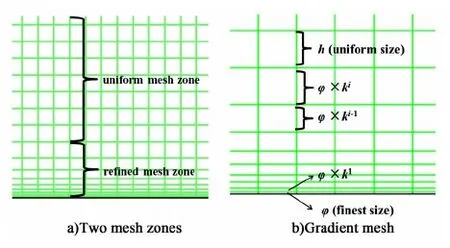
Fig.2 The gradient mesh approach adopted in the present study a) Two mesh zones b) Gradient mesh
According to this rule, last raw width multiplied by coefficientkis equal to next raw width until the raw widthφ×kiapproaches or equals toh.In the present work,iis set as eight to ensure that the liquid film is all in the grid refinement region. Through checking grid independence, the uniform mesh size (h) is finally set as 1/25 of the cross-sectional width (d) which is 0.1, 02, 0.3, 0.4, 0.5, 0.8 and 1.0 mm, respectively.
2.4 Numerical algorithm
In the present work,a finite volume method (FVM) based commercial CFD software, ANSYS FLUENT (Release 6.3.26, 2007), is used to simulate two-dimensional, double precision, unsteady, two-phase Taylor flow in microchannels.The boundary conditions are specified as follows: velocity inlet for gas and liquid feeds and pressure outlet for the microchannel outlet. The no-slip wall condition is applied to the walls. The implicit body force treatment for the body force formulation in the multiphase model panel is selected to improve solution convergence by accounting for the partial equilibrium of the pressure gradient and body forces in the momentum equations. Table 1 shows the properties of the gas and liquid phases used in the present study. To obtain more realistic looking rounded bubbles with low grid density, a contact angle of 0° is set for all cases. The pressure staggering options (PRESTO!) method is used for the discretization of the pressure interpolation. The momentum equations and the interface interpolation are discretized by second order upwind scheme and geometric reconstruction scheme respectively. The pressure-implicit with splitting of operators(PISO) scheme is chosen for pressure-velocity coupling and the initial value of water volume fraction is set as 1. In addition, the residual values, the time step and the maximum number of iterations per time step are properly adjusted to ensure convergence.
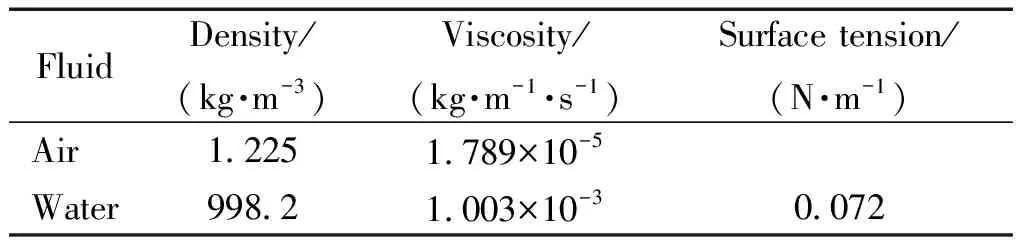
Table 1 Properties of the gas and liquid phase used in our simulations
3 Results and discussion
The simulations are carried out on a workstation, four AMD Opteron CPUs (two cores and 2.2 GHz each) and 8 GB RAM. The air and water superficial velocities are determined based on the different flow regimes identified in microchannels[1-5]and the value is mainly set as 0.1 m/s and 0.15 m/s, respectively.
3.1 Determine a mesh arrangement
In order to precisely capture the liquid film, series of simulations are conducted with different gradient mesh arrangements and the numerical results of the liquid film thickness are displayed in Table 2.According to the table, with the decrease ofφ, the liquid film thickness becomes thinner. However, whenφis equal to or less than 1.5 μm, the liquid film thickness maintains a stable value. In summary, whenφis less thanδ, the liquid film can be captured. Ifφis equal to or less than 1/5 ofδ,a stable film thickness can be obtained.Thus, based on the numerical accuracy and computational efficiency,φandkis determined as 1.5 μm and 1.38, respectively.
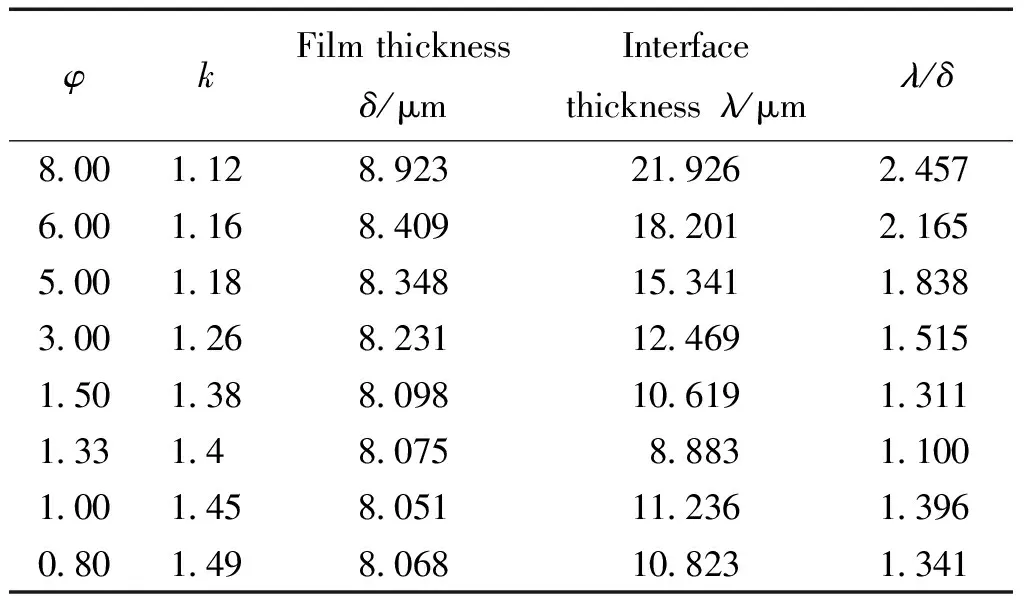
Table 2 Comparison of liquid film thickness in simulations with different mesh arrangements (d=0.5 mm, UG=0.1 m/s, UL=0.15 m/s)
3.2 Comparison of numerical methods
Square grids size of 5 μm×5 μm in the uniform mesh region and rectangular grids size of 2.4 μm×5.0 μm in the liquid film region, shown in Fig.3a) were adopted in the study of Gupta[9]. In the present research, the gradient mesh approach is applied,as shown in Fig.3b). A single bubble and the adjacent liquid slug are defined as a unit cell.The computing time needed to acquire one unit cell with Gupta′s mesh approach would be considerable longer than that with our gradient mesh approach with the same computing resources, which is due to the reason that the grids number used in Gupta′s mesh approach is eleven times larger than that used in our gradient mesh approach.According to Fig.3b), in the liquid film region, our simulation result turns out to be in good agreement with that from Gupta. However,it is hard to capture the gas-liquid interface accurately in the uniform mesh region. In curved microchannels, the finer meshes were used in the streamwise direction and the clearer gas-liquid interface could be seized[18].Thus, the grid size is decreased to 10 μm along the direction ofx-axis to investigate the effect of mesh size, as displayed in Fig.3c). It is obvious that the numerical result of refined mesh resolution along the direction ofx-axis is in good agreement with that from Gupta. However, the refined mesh resolution does not have significant influence on the hydrodynamic characteristics compared with the original mesh resolution. For instance, the bubble velocity is 0.260 m/s and 0.265 m/s in Fig.3b) and Fig.3c), respectively.As there is no chemical reaction in the microchannel, the mesh does not need to be refined in the streamwise direction.
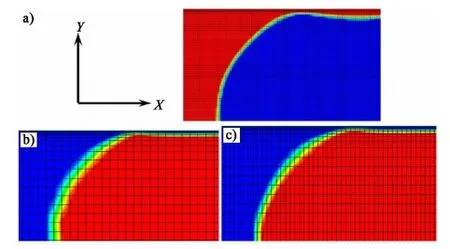
Fig.3 a) Refined mesh near the wall in the liquid film region cited from Gupta [9] (red color-water, blue color-air,d=0.5 mm,UG=0.245 m/s, UL=0.255 m/s);b) Gradient mesh near the wall in the liquid film region (red color-air, blue color-water, d=0.5mm, UG=0.1 m/s, UL=0.15 m/s); c) Gradient mesh near the wall and refined mesh along the direction of x-axis (red color-air, blue color-water, d=0.5 mm, UG=0.1 m/s, UL=0.15 m/s).
3.3 Model validation
To confirm the validity of the model applied in the present study, comparisons of the hydrodynamic characteristics of Taylor flow between our simulation results and experimental data or correlation values are carried out, as discussed below.
3.3.1Liquidfilmthickness
In the research of Han[22], measurement of liquid film thickness in a micro parallel channel was conducted. Through analyzing liquid film theoretically and experimentally, a conclusion was drawn that the liquid film thickness in a parallel channel can be predicted well by the circular tube correlations[22]. In their experiments, parallel channel was represented by the channel with a high aspect ratio (i.e. wide shallow microchannel).In the present work,series of 2D numerical simulations that simulate flow in an infinitely wide channel are performed in a plane of 500 μm high.Thus, the liquid film thickness of 2D simulation can be accurately predicted by the empirical correlations for circular tubes and can match well with the experimental data from experiments for circular tubes.
The correlation 2δ/d=1.34Ca2/3proposed by Bretherton[23]is commonly used to predict the liquid film thickness and the correlation value under our simulation condition is 8.069 μm which is almost identical to our numerical prediction (8.098μm).
In the study of Han and Shikazono[24],the liquid film thickness was measured in micro tube slug flow. Their experimental data are compared with our numerical results at the same bubble velocity in the present paper,as exhibited in Fig.4.The simulation results are in good agreement with the experimental data. When bubble velocity is larger than 1.3 m/s, the simulation results and the experimental data are almost the same.

Fig.4 Comparison of liquid film thickness between simulation results and experimental data obtained from Han and Shikazono[24] (Note: Exp-Experimental data; Sim-Simulation results; d=0.5 mm)
3.3.2Gashold-up
The gas hold-up can be estimated based on a unit cell. However, to avoid incidental error that may arise by relying on just one unit cell, the value of gas hold-up is calculated in the present work by dividing the volume of three gas bubbles by that of the three unit cells at different development time, as shown in Fig.5.

Fig.5 Unit cells used in the calculations of gas hold-up (red color-air, blue color-water, d=0.5 mm, UG=0.1 m/s, UL=0.15 m/s, t=0.072 s)


Table 3 Comparison of the gas hold-up between simulation results and formula value
Note: Uniform mesh approach (d=0.5 mm,d/25=h=20 μm, grid snumber: 22500).Gradient mesh approach(d=0.5 mm,d/25=h=20 μm,φ=1.5,k=1.38, grid snumber: 30200).
3.3.3Bubblevelocity
The velocity of the intersection point of central line and bubble front line is regarded as the bubble velocity.To calculate the bubble velocity, two different moments are selected asT1andT2, as shown in Fig.6.His the distance that the first Taylor bubble passes fromT1toT2. The value is thus calculated by dividing the distanceHby the time differenceT2-T1.
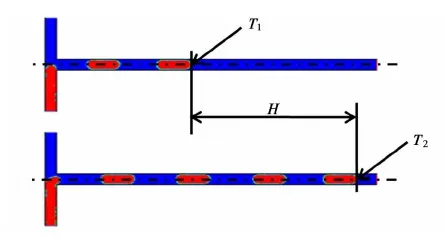
Fig.6 Method forcalculating bubble velocity used in this paper (red color-air, blue color-water, d=0.5 mm, UG=0.1 m/s, UL=0.15 m/s)
Table 4 shows the simulation result and the value of formulaUB=UG/εGused by Warnier[25].According to the table, the simulation result differs within 1% from the formula value.
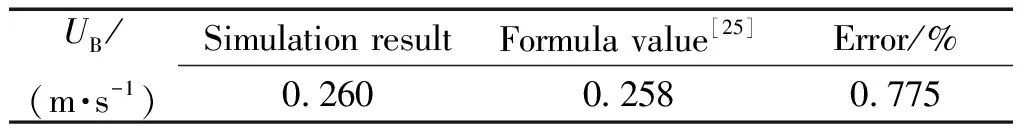
Table 4 Comparison of bubble velocity between simulation result and formula value (d=0.5 mm, UG=0.1 m/s, UL=0.15 m/s, grid size: 30200 cells)
3.3.4Pressuredropperunitlength
Fig.7 shows the pressure profile at the center line for a specific simulation condition, and the pressure drop of the microchannel is represented by that across a unit cell.

Fig.7 Pressure distribution for Taylor flow in microchannel along x-axis direction (d=0.5 mm, UG=0.1 m/s, UL=0.15 m/s, t=0.072 s)
The expression for pressure drop of Taylor flow proposed by Kreutzer[26]is listed below:
whereεL, the dynamic liquid hold-up, is the fraction of channel length occupied by the liquid slugs. The friction factorfis given by
whereLLis the liquid slug length,Re=d(UL+UG)ρL/μLis the Reynolds number andα1is a constant. According to Kreutzer[26], the value ofα1was found to be 0.07 and 0.17 for numerical simulations and experimental data, respectively. As discussed in the literature[26], such a large difference on the value ofα1was attributed to the Marangoni effects generated by the existence of liquid impurity in the experiments.The pressure drop per unit length calculated by the correlation is 32.08 Pa/mm and 49.80 Pa/mm using the numerical and experimental value ofα1.Our simulation result is 23.12 Pa/mm while the prediction changes to 15.72 Pa/mm with uniform mesh approach. Thus, the simulation result with gradient mesh approach is closer to the correlation value than that with uniform mesh approach.The difference between these two predictions may result from the reason that the velocity gradient linear to shear force with uniform mesh approach is not captured as accurate as that with gradient mesh approach, while the pressure drop is dominated by shear force in microchannels.
3.3.5Sluglength
Table 5 shows the comparison between the experimental bubble lengths from Santos and Kawaji[27]and the simulation results obtained under the identical condition.Even though the structure of the inlet T-junction used by Santos and Kawaji[27]is different from that in the present work, there is not much difference in the slug length between the channels with these two inlets, which was reported by Qian and Lawal[14]. However, Table 5 reveals a large discrepancy between numerical predictions and experimental data. This discrepancy is likely due to the flow disturbances produced in the experiments that is not considered in simulations using the incompressible model and the fixed velocity boundary condition[27]. Still,our simulations support the trend of the slug lengths’ variation with the increase ofULobtained from the experimental data.According to the table, our simulation results are much closer to the experimental data than those from Santos and Kawaji[27].

Table 5 Comparison of slug length between simulation results and experimental data
4 Newly developed correlations of slug length
Mass transfer and pressure drop in microchannels are highly dependent on slug length. Some researchers[28-30]had proposed mass transfer coefficients that were related to slug length and some researchers[25, 30-32]had measured slug length using various methods (MRI method, conductivity method and photographic method). Laborie[33]measured bubble and liquid slug length and realized that slug lengths were correlated withReandEo. Qian and Lawal[14]performed the numerical simulations of Taylor flow in T-junction microchannels with varying cross-sectional width (1~3 mm), using commercial CFD soft ware and VOF model. Qian and Lawal proposed the slug length correlationsand illustrated the decisive influence of gas hold-up and the limited effects ofReandCa.Kumar[18]and Sobieszuk[34]conducted experimental studies of the bubble and liquid slug length in Taylor flow. The measurements agreed well with the values obtained from the correlation of Qian and Lawal[14]. Sobieszu kimproved and simplified Qian and Lawal′s correlation and derived a new correlation only concerningεGandWe.
According to the formula used by Warnier[25],gas hold-up is dependent on the liquid film thickness.Moreover, the dimensionless slug length is mainly depended on the gas hold-up in the study of Qian and Lawal[14].Therefore, liquid film thickness in directly influences slug length.On the basis of dimensional analysis method and the numerical simulation results, Qian and Lawal[14]proposed the correlations of gas and liquid slug length in a T-junction microchannel. However, the liquid film was not captured in the numerical simulations performed by Qian and Lawal,which resulted in a 20%—30% difference between the slug length ratio and the volume flow rate ratio,causing the numerical slug lengths to be in consistent with the experimental data. Thus,new correlations of slug length in a T-junction microchannel are further developed based on the correlations of Qian and Lawal and the simulation results in the present work. The influences of gravity, viscosity, density and contact angle are not considered.Dimensional analysis method (the details can be found in the research of Qian and Lawal[14]) is used and the dimensionless slug length has the following dependence:
L*=L*(Re,Ca,εG)
(6)
Through analyzing 28 sets of numerical data, the following correlations of the dimensionless slug length are determined:
(7)
εG-1.34Ca2/3)Re-0.0908Ca-0.1303
(8)
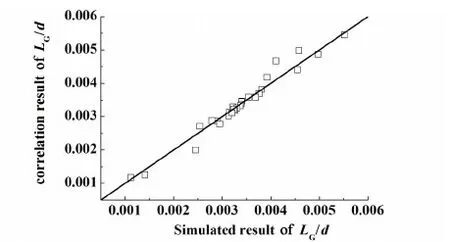
Fig.8 Comparison between our numerical predictions and the correlation values
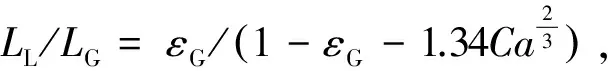

Fig.9 Comparison of the slug length between correlation values and experimental data (d=113 μm, red line-UG=0.04 m/s, black line-UG=0.079 m/s, blue line-UG=0.317 m/s)
5 Conclusions
In the present study, a gradient mesh approach is applied to simulate Taylor flow in a T-junction microchannel using the VOF method. Series of numerical simulations are performed to generate proper rules for the approach and determine an effective mesh arrangement to capture the liquid film steadily and the comparison of numerical methods is also carried out. The validity of our model is confirmed through comparing the numerical predictions with experimental data and correlation values.Finally, through analyzing 28 sets of numerical simulation data, new correlations of slug length in a T-junction microchannel are further developed.The conclusions of this research are as follows:
1) The gradient mesh approach with our newly proposed rules can capture the liquid film steadily. The mesh arrangement is able to make a good balance between the computing accuracy and efficiency for predicting the hydrodynamic characteristics of Taylor flow.
2) When the finest mesh size (φ) is less than the liquid film thickness(δ), the liquid film can be captured. If the finest mesh size (φ) is less than 1/5 of the film thickness(δ), an accurate and stable film thickness can be achieved.
3) The newly derived correlationsof slug length are able to accurately predict the gas and liquid slug length in the microchannel under some certain conditions.
Acknowledgement:
The authors would like to thank the National Natural Science Foundation of China for supporting this research under the grant of 20911130358.
Notation:
A——channel cross-sectional area, m2;
AB——Taylor bubble cross-sectional area, m2;
Bo——Bond number (=ρgd2/4σ);
Ca——Capillary number (=μL(UG+UL)/σ);
d——channel cross-sectional width, m;
Eo——Eotvos number (=(ρL-ρG)d2g/σ);
f——friction factor;
F——volume force, N/m3;
g——gravitational acceleration, N/kg;
H——distance, m;
h——uniform mesh size, m;
k——the ratio of rows in gradient mesh;
L——unit cell length, m;
L*——dimensionless slug length;
LG——Taylor bubble length, m;
LL——liquid slug length, m;
p——static pressure, Pa;
Re——Reynolds number (=ρL(UG+UL)d/μL);
t——time, s;
T1——moment one, s;
T2——moment two, s;
UB——bubble velocity from correlation, m/s;
UG——gas superficial velocity, m/s;
UL——liquid superficial velocity, m/s;
We——Weber number (=ρLdUB2/σ);
Δp——pressure drop, Pa.
Greekletters:
α——volume fraction of one phase;
α1——empirical constant;
ε——hold-up of one phase;
μ——viscosity of one phase, mixture viscosity (=(1-αG)μL+αGμG),Pa·s;
ρ——density of one phase, mixture density (=(1-αG)ρL+αGρG),kg/m3;
δ——film thickness, m;
λ——Interface thickness,μm;
σ——surface tension, N/m;
υ——velocity vector, m/s;
φ——the finest mesh size in gradient mesh, m.
Subscriptsandsuperscripts:
B——Taylor bubble;
G——gas phase;
L——liquid phase.
参考文献:
[1]Abdul-Razzak A, Shoukri M, Chan A M C.Two-Phase flow regimes during the rewetting and refilling of hot horizontal tubes[J]. Exp Therm Fluid Sci, 1990, 3(3): 330-337
[2]Cha J, Ahn Y, Kim M. Flow measurement with an electromagnetic flowmeter in two-phase bubbly and slug flow regimes[J].Flow Meas Instrum, 2002, 12(5/6): 329-339
[3]Jassim E W, Newell T A,Chato J C. Prediction of two-phase condensation in horizontal tubes using probabilistic flow regime maps[J]. Int J Heat Mass Transfer, 2008, 51(3/4): 485-496
[4]Triplett K A,Ghiaasiaan S M,Abdel-Khalik S I,etal. Gas-liquid two-phase flow in microchannels Part I: Two-phase flow patterns[J].Int J Multiphase Flow, 1999, 25(3): 377-394
[5]Akbar M K, Plummer D A, Ghiaasiaan S M. On gas-liquid two-phase flow regimes in microchannels[J].Int J Multiphase Flow, 2003, 29(5): 855-865
[6]Thulasidas T C, Abraham M A, Cerro R L. Flow patterns in liquid slugs during bubble-train flow inside capillaries[J]. Chem Eng Sci, 1997, 52(17): 2 947-2 962
[7]Salman W, Gavriilidis A,Angeli P. A model for predicting axial mixing during gas-liquid Taylor flow in microchannels at low Bodensteinnumbers[J]. Chem Eng J, 2004, 101(1/3):391-396
[8]Adeosun J T,Lawal A. Numerical and experimental studies of mixing characteristics in a T-junction microchannel using residence-time distribution[J]. Chem Eng Sci, 2009, 64(10):2 422-2 432
[9]Gupta R, Fletcher D F, Haynes B S.On the CFD modelling of Taylor flow in microchannels[J]. Chem Eng Sci, 2009, 64(12): 2 941-2 950
[10]Aubin J, Ferrando M,Jiricny V. Current methods for characterising mixing and flow in microchannels[J]. Chem Eng Sci, 2010, 65(6): 2 065-2 093
[11]Giavendoni M D, Saita F A. The rear meniscus of a long bubble steadily displacing a Newtonian liquid in a capillary tube[J]. Phys Fluids,1999, 11 (4): 786-794
[12]van Baten J M, Krishna R. CFD simulations of mass transfer from Taylor bubbles rising in circular capillaries[J]. Chem Eng Sci, 2004, 59(12): 2 535-2 545
[13]Irandoust S,Andersson B.Simulation of flow and mass transfer in Taylor flow through a capillary[J].Comput Chem Eng,1989, 13(4/5): 519-526
[14]Qian D,Lawal A.Numerical study on gas and liquid slugs for Taylor flow in a T-junction microchannel[J].Chem Eng Sci, 2006,61(23): 7 609-7 625
[15]Olsson E,Kreiss G. A conservative level set method for two phase flow [J]. J Comput Phys, 2005, 210(1): 225-246
[16]Yue P, Zhou C, Feng J J,etal. Phase-Field simulations of interfacial dynamics in viscoelastic fluids using finite elements with adaptive meshing[J]. J Comput Phys, 2006, 219(1): 47-67
[17]Yu Z, Hemminger O, Fan L. Experiment and lattice Boltzmann simulation of two-phase gas-liquid flows in microchannels[J]. Chem Eng Sci,2007, 62(24): 7 172-7 183
[18]Kumar V, Vashisth S, Hoarau Y,etal. Slug flow in curved microreactors: Hydrodynamic study[J]. Chem Eng Sci, 2007, 62(24): 7 494-7 504
[19]Kashid M N, Agar D W. Hydrodynamics of liquid-liquid slug flow capillary microreactor: Flow regimes, slug size and pressure drop[J]. Chem Eng J, 2007, 131(1): 1-13
[20]Hazel A L, Heil M. The steady propagation of a semi-infinite bubble into a tube of elliptical or rectangular cross-section[J]. J Fluid Mech, 2002, 470: 91-114
[21]Brackbill J U, Kothe D B, Zemach C. A continuum method for modeling surface tension[J]. J Comput Phys, 1992, 100(2): 335-354
[22]Han Y, Shikazono N, Kasagi N. Measurement of liquid film thickness in a micro parallel channel with interferometer and laser focus displacement meter[J]. Int J Multiphase Flow, 2011, 37(1): 36-45
[23]Bretherton F P. The motion of long bubbles in tubes[J]. J Fluid Mech, 1961, 10(2): 166-188
[24]Han Y, Shikazono N. Measurement of the liquid film thickness in micro tube slug flow[J]. Int J Heat Fluid Flow, 2009, 30(5): 842-853
[25]Warnier M J F, Rebrov E V, De Croon M,etal. Gas hold-up and liquid film thickness in Taylor flow in rectangular microchannels[J]. Chem Eng J, 2008, 135: S153-S158
[26]Kreutzer M T, Kapteijn F, Moulijn J A,etal. Inertial and interfacial effects on pressure drop of Taylor flow in capillaries[J]. AIChE J, 2005, 51(9): 2 428-2 440
[27]Santos R M, Kawaji M. Numerical modeling and experimental investigation of gas-liquid slug formation in a microchannel T-junction[J]. Int J Multiphase Flow, 2010, 36(4): 314-323
[28]Berěiě G, Pintar A. The role of gas bubbles and liquid slug lengths on mass transport in the Taylor flow through capillaries[J]. Chem Eng Sci, 1997, 52(21): 3 709-3 719
[29]Vandu C O, Liu H, Krishna R. Mass transfer from Taylor bubbles rising in single capillaries[J]. Chem Eng Sci, 2005, 60(22): 6 430-6 437
[30]Heiszwolf J J, Kreutzer M T, van den Eijnden M G,etal. Gas-Liquid mass transfer of aqueous Taylor flow in monoliths[J]. Catal Today, 2001, 69(1): 51-55
[31]Mantle M D, Sederman A J, Gladden L F,etal. Dynamic MRI visualization of two-phase flow in a ceramic monolith [J]. AIChE J, 2002, 48(4): 909-912
[32]Kreutzer M T, Eijnden M G, Kapteijn F,etal. The pressure drop experiment to determine slug lengths in multiphase monoliths[J]. Catal Today, 2005, 105(3): 667-672
[33]Laborie S, Cabassud C, Durand-Bourlier L,etal. Characterisation of gas-liquid two-phase flow inside capillaries[J]. Chem Eng Sci, 1999, 54(23): 5 723-5 735
[34]Sobieszuk P, Cygański P, Pohorecki R. Bubble lengths in the gas-liquid Taylor flow in microchannels[J]. Chem Eng Res Des, 2010, 88(3): 263-269