Single nucleotide polymorphisms linked to quantitative trait loci for grain quality traits in wheat
2016-04-05ChunlinLiGuihuBiShiomnChoBrttCrvrZhonghuWng
Chunlin Li, Guihu Bi*, Shiomn Cho, Brtt Crvr, Zhonghu Wng
aCollege of Agronomy, Northwest A&F University, Yangling, Shaanxi 712100, ChinabState Key Laboratory of Crop Stress Biology for Arid Areas, Northwest A&F University, Yangling, Shaanxi 712100, ChinacAgronomy Department, Kansas State University, Manhattan, KS 66506, USAdHard Winter Wheat Genetics Research Unit, USDA-ARS, Manhattan, KS 66506, USAeCereal Crops Research Unit, USDA-ARS, Fargo, ND, USAfDepartment of Plant and Soil Science, Oklahoma State University, Stillwater, OK 74078, USA
Single nucleotide polymorphisms linked to quantitative trait loci for grain quality traits in wheat
Chunlian Lia,b,c, Guihua Baic,d,*, Shiaoman Chaoe, Brett Carverf, Zhonghua Wanga
aCollege of Agronomy, Northwest A&F University, Yangling, Shaanxi 712100, China
bState Key Laboratory of Crop Stress Biology for Arid Areas, Northwest A&F University, Yangling, Shaanxi 712100, China
cAgronomy Department, Kansas State University, Manhattan, KS 66506, USA
dHard Winter Wheat Genetics Research Unit, USDA-ARS, Manhattan, KS 66506, USA
eCereal Crops Research Unit, USDA-ARS, Fargo, ND, USA
fDepartment of Plant and Soil Science, Oklahoma State University, Stillwater, OK 74078, USA
A R T I C L E I N F O
Article history:
Received 3 September 2015
Received in revised form
29 October 2015
Accepted 27 November 2015
Available online 4 December 2015
Keywords:
Triticum aestivum
Epistasis
Grain quality traits
QTL×environments interaction SNP
A B S T R A C T
Wheat (Triticum aestivum L.) grain quality traits that are controlled by quantitative traits loci (QTL) define suitable growing areas and potential end-use products of a wheat cultivar. To dissect QTL for these traits including protein content (GPC); test weight (TW); single kernel characterization system (SKCS)-estimated kernel weight (SKW); kernel diameter (KD); kernel hardness measured by near-infrared reflectance spectroscopy (NIRS) hardness index (NHI); and SKCS-hardness index (SHI), a high-density genetic map with single nucleotide polymorphism (SNP) and simple sequence repeat (SSR) markers was developed using recombinant inbred lines (RILs) derived from Ning7840×Clark. The RILs were evaluated for these quality traits in seven Oklahoma environments from 2001 to 2003. A total of 41 QTL with additive effects on different traits were mapped on most wheat chromosomes, excluding 1A, 2A, 3D, 4D, 6D, and 7B. Seven chromosome regions showed either tightly linked QTL or QTL with pleiotropic effects on two to four traits. Ten pairs of QTL showed additive×additive effects (AA), four QTL were involved in additive×environment (AE) effects, and one was involved in AAE effects. Two to eleven QTL for each of the six traits and 139 tightly linked markers to these QTL were identified. The findings shed light on the inheritance of wheat grain quality traits and provide DNA markers for manipulating these important traits to improve quality of new wheat cultivars.
Production and hosting by Elsevier B.V. on behalf of Crop Science Society of China and Institute of Crop Science, CAAS. This is an open access article under the CC BY-NC-ND license (http://creativecommons.org/licenses/by-nc-nd/4.0/).
* Corresponding author at: Hard Winter Wheat Genetics Research Unit, USDA-ARS, Manhattan, KS 66506, USA.
E-mail addresses: gbai@ksu.edu, guihua.bai@ars.usda.gov (G. Bai).
Peer review under responsibility of Crop Science Society of China and Institute of Crop Sciences, CAAS.
http://dx.doi.org/10.1016/j.cj.2015.10.002
2214-5141/Production and hosting by Elsevier B.V. on behalf of Crop Science Society of China and Institute of Crop Science, CAAS. This is an open access article under the CC BY-NC-ND license (http://creativecommons.org/licenses/by-nc-nd/4.0/).
1. Introduction
Grain protein content (GPC), test weight (volumetric grain weight, TW), kernel weight (KW), kernel size (KS), and kernel hardness (KH) are important grain quality traits in bread wheat (Triticum aestivum L.). Quantitative trait locus (QTL) analysis for GPC has been extensively studied and a large number of QTL were reported to cover all 21 wheat chromosomes[1,2,3,4,5,6,7,8,9,10,11]. Previous studies detected many QTL for TW located on almost all 21 wheat chromosomes except for 6D [3,5,8,12,13,14,15,16].KWisanimportantcomponentofnotonly grain yield but also flour yield. Many studies on QTL for KW have been performed and QTL were detected on all chromosomes except 3D and 6D [8,11,14,15,16,17,18,19,20,21,22,23]. The uniformity of KS or its distribution allows for a more efficient milling and quality control. Different QTL were detected in diverse germplasm lines when different methods were used to assess KS. QTL for KS, which is conditioned by genes independently of those for kernel length and width, were mapped to 16 wheat chromosomes excluding 3A, 3D, 4D, 6D, and 7D [14,20,23,24,25,26,27,28]. Pleiotropic QTL were also identified for KS and kernel weight on chromosomes 2A, 5D, 6A [14] and 2B, 2D, 4B, 5B [20]. KH is an important quality trait of bread wheat (Triticum aestivum L.) and determines wheat classification and end-use properties. Previous studies indicated that QTL with large effects on KH were co-located with the Ha locus on chromosome 5DS [2,4,13,24,29]. In addition, a number of QTL that affect wheat KH have been identified in different mapping populations and covered all 21 wheat chromosomes except for 3D and 6A [6,9,30,31,32,33,34].
Although QTL on the 21 chromosomes have been identified for grain quality traits in wheat germplasm, epistatic effects among them have not been well documented despite the importance in understanding the genetic basis of complex traits. Also, environments often influence expression of grain quality traits and genotype×environment interaction significantly contributes to phenotypic variations of such traits. Sun et al. [19] used a Ning7840×Clark recombinant inbred line (RIL) population to construct a SSR and AFLP-based map and identified 25 QTL for quality factors, but they did not consider epistatic effects and QTL×environment interactions. Besides, single nucleotide polymorphisms (SNPs) are the most common polymorphism among individuals of any species with virtually unlimited numbers and constitute the basis of most genetic variation between individuals [35]. The availability of diverse SNP genotyping platforms facilitates genetic dissection, marker discovery and genomic selection of traits in crop plants [36]. In the present study, we used a high-density, SNP and SSR genetic map developed for the Ning7840×Clark RIL population to identify new additive QTL for wheat grain quality traits and SNP markers closely linked to the QTL, and evaluated interaction effects between QTL and between QTL and environments.
2. Materials and methods
2.1. Plant materials and phenotypic data collection
A population of 127 F10–12RILs was developed from the cross Ning7840×Clark by single-seed descent. Ning7840 (Avrora/ Anhui 11//Sumai 3) is a Chinese hard red wheat breeding line. It has relatively low yield potential, but a high level of resistance to various rust pathogens and Fusarium graminearum [37]. Clark is a soft winter wheat cultivar released from Purdue University, IN, with good yield potential [38].
Phenotypic data were collected from field experiments at three Oklahoma locations, Stillwater (ST), Lahoma (LA) and Altus (AL) in three crop years ending in 2001, 2002, and 2003, respectively. The RILs along with the parents were measured for six grain quality traits including GPC, TW, single kernel characterization system (SKCS)-estimated kernel weight (SKW), kernel diameter (KD), SKCS-grain hardness index (SHI), and near-infrared reflectance spectroscopy (NIR)-estimated grain hardness index (NHI). Experiments were conducted in seven combinationsofyearsandlocations:Stillwater2001to2003(ST01 to ST03), Lahoma 2002 and 2003 (LA02 and LA03), and AL02 and AL03 (Altus 2002 and 2003). The RILs were arranged in a replicates-in-sets design with three replicates and a plot size of 1.4 m2plantedatadensityof58 kg ha−1.Thephenotypicdatafor GPC, TW, SKW, KD, SHI, and NHI were collected as previously described [19].
2.2. DNA extraction and marker analysis
Genomic DNA isolation from both the parents and RILs and PCR for SSR were conducted following previously described protocols [39]. PCR fragments were separated with an ABI PRISM 3730 DNA Analyzer (Applied Biosystems, Foster City, CA, USA) and scored using GeneMarker version 1.6 (Soft Genetics LLC, State College, PA, USA).
SNP genotyping was performed using Infinium iSelect SNP genotyping assays containing 9000 wheat SNPs developed by Illumina Inc. (San Diego, CA, USA). The assay was designed under protocols of the International Wheat SNP Consortium [40]. SNP call was performed using GenomeStudio v2011.1 software (Illumina Inc.). The genotyping assay was conducted at the USDA Small Grains Genotyping Laboratory at Fargo, ND.
2.3. QTL identification
A linkage map for QTL mapping of grain quality traits was reported previously [41]. This map consisted of 998 markers (594 SNPs and 404 SSRs) in 47 linkage groups that corresponded to all 21 wheat chromosomes and covered 4225.7cM of total genetic distance. This final map was used to map the QTL for grain quality traits. QTL mapping was performed using inclusive composite interval mapping of additive (ICIM-ADD) and epistatic QTL (ICIM-EPI) functionalities in the software QTL IciMapping version 3.2 [42]. Additive QTL were detected using 1.0cM steps. The significance probability was set at 0.001 for stepwise regression. Significant LOD thresholds were determined for each dataset by 1000 permutations. Type I error to determine the LOD thresholds from permutation tests was set at P<0.05. Epistatic QTL were detected using a scanning step of 5.0cM, a probability of 0.0001 in stepwise regression, and a LOD threshold of 5.0 to claim significance.
QTL×environmentinteractionsweredetectedusingtheMulti-Environment Trials (MET) functionality. Additive×environment (AE) effects and additive×additive×environment (AAE) effects were identified using ICIM-ADD and ICIM-EPI functionalities in the software QTL IciMapping [42]. AE and AAE interactions were detected using 1.0cM steps in scanning, a probability of 0.001 for stepwise regression, and a LOD threshold of 2.5 for claiming significant QTL in each dataset. Significant AE interactions were claimed at P<0.05 (LOD = 3.8) and significant AAE interactions were claimed at P<0.001 (LOD = 10.2).
3. Results
3.1. Additive QTL for wheat grain quality traits
Forty-one putative QTL with additive effects on different traits were distributed on all of the wheat chromosomes except 1A, 2A, 3D, 4D, 6D, and 7A (Table 1, Fig. 1). Five QTL on chromosome arms 2DL, 5AS, 6AL, and 7AL showed simultaneous additive effects on two kernel size traits (SKW-KD), one QTL on chromosome 5DS showed an additive effect on both measurements of kernel hardness (SHI-NHI), and two QTL on chromosome arms 4BS and 5AL showed a simultaneous additive effect on four traits (GPC-TW-SKW-KD). Among the 41 QTL, 17 (41.5%) were located in the A genome, 16 (39.0%) in the B genome, and 8 (19.5%) in the D genome. The numbers of additive QTL on homoeologous groups one to seven were 6, 4, 4, 6, 13, 4, and 4, respectively. A total of 139 markers (106 SNPs and 33 SSRs) showed tight linkage to the QTL, and most of them might be useful for marker-assisted selection.
GPC, SKW, KD, SHI, and NHI were measured in five environments (ST01–ST03, AL02, and LA03), whereas TW was measured in all seven environments. Four QTL for GPC were identified on chromosomes 3A, 4BS, 5AL, and 5BL with the high GPC alleles all from Ning7840 (Table 1). QGpc.hwwgr-4BS was detected consistently across three environments and had the most significant effect on wheat GPC. This QTL was located between SNP markers IWA1846 and IWA4662 on chromosome 4BS and explained 20.1% to 22.0% of the phenotypic variance. Another three QTL, QGpc.hwwgr-3A, QGpc.hwwgr-5AL, and QGpc.hwwgr-5BL were detected in single environments, explaining 11.5% to 21.5% of the phenotypic variance.
Nine additive QTL for TW were detected on chromosomes 1DL, 3BL, 4AS, 4BS, 5AL, 5AS, 5BS, and 7DS with increased TW alleles at QTw.hwwgr-5AS and QTw.hwwgr-5AL.2 from Clark, but from Ning7840 at other QTL. Among these QTL, QTw.hwwgr-4BS with the most significant effect on TW across three environments was flanked by markers IWA4662 and IWA482 on chromosome 4BS, and accounted for 29.5% (AL02), 12.4% (ST03), and 13.3% (ST02) of the phenotypic variance. QTw.hwwgr-5AL.1 in the interval IWA649–IWA6988 and QTw.hwwgr-4AS in interval Xbarc206-Xwmc96 were significant in two environments. QTw.hwwgr-5AL.1 explained 29.4% (ST03) and 15.5% (AL02) of the phenotypic variance, respectively; QTw.hwwgr-4AS explained 11.4% (ST02) and 9.1% (LA03) of the phenotypic variance, respectively. Other QTL detected in single environments explained 8.3% to 26.4% of the phenotypic variance.
Ten QTL for SKW, were mapped to chromosomes 1BL, 1BS, 2DL, 4BS, 5AL, 5AS, 6AL, 6B, 7AL, and 7DL. Among them, QSkw.hwwgr-7AL between the markers IWA7325 and IWA6535 and QSkw.hwwgr-6AL in the interval Xbarc1055–IWA6962 were detected in four and three environments, respectively. Increased SKW alleles of these QTL were contributed by Clark and accounted for 6.2% to 27.6% and 4.9% to 9.6% of the phenotypic variance, respectively. QSkw.hwwgr-4BS between IWA4662 and IWA1846, and QSkw.hwwgr-1BS interval Xwmc818.1–IWA3620 were detected in ST02 and AL02 with increased SKW coming from Ning7840. QSkw.hwwgr-4BS and QSkw.hwwgr-1BS explained 27.6% and 11.7% of the phenotypic variance, respectively, in ST02, and 13.0% and 10.2% in AL02. QSkw.hwwgr-2DL between markers IWA5252 and Xgwm539 was significant in two environments (ST01 and AL02) with an increased SKW allele from Clark that accounted for 12.0% (ST01) and 5.9% (AL02) of the phenotypic variance. Other QTL, QSkw.hwwgr-1BL, QSkw.hwwgr-5AL, QSkw.hwwgr-5AS, QSkw.hwwgr-6B, and QSkw.hwwgr-7DL, were significant in single environments and explained 4.8% to 13.8% of the phenotypic variance.
Eleven QTL for KD were identified on chromosomes 1BL, 2BS, 2DL, 3BS, 4AL, 4BS, 5AL, 5AS, 6AS, 6AL, and 7AL. Among them, QKd.hwwgr-5AL was detected consistently across four environments and had the second largest effect on KD. This QTL was located between markers IWA649 and Xcfa2149.1 with the larger KD allele coming from Ning7840 and explaining 9.7% to 22.9% of the phenotypic variance. QKd.hwwgr-5AS in marker interval Xwmc96.1-IWA4710 was detected in three environments, explaining 7.6% (ST01), 8.9% (ST03) and 9.4% (AL02) of the phenotypic variance with Clark contributing the positive allele. QKd.hwwgr-4AL, QKd.hwwgr-4BS, QKd.hwwgr-6AS, and QKd.hwwgr-7AL were identified in two environments; among them QKd.hwwgr-6AS between markers IWA5239 and IWA731 and QKd.hwwgr-7AL between the markers IWA6670 and IWA6535 contained increased KD alleles from Clark with QKd.hwwgr-6AS explaining 13.9% (AL02) and 24.0% (ST03) of the phenotypic variance and QKd.hwwgr-7AL accounting for 11.7% (ST01) and 7.4% (ST02) of the phenotypic variance; QKd.hwwgr-4BS in the marker interval IWA482–IWA1846 and QKd.hwwgr-4AL in marker interval of Xwmc376.3–Xwmc313 had increased KD alleles from Ning7840 with QKd.hwwgr-4BS explaining 9.0% (ST02) and 13.4% (AL02) of the phenotypic variance and QKd.hwwgr-4AL explaining 6.6% (AL02) and 12.5% (ST03) of the phenotypic variance. QKd.hwwgr-1BL, QKd.hwwgr-2BS, QKd.hwwgr-2DL, QKd.hwwgr-3BS, and QKd.hwwgr-6AL were detected in single environments and explained 5.1 to 8.9% of the phenotypic variance.
QTL on chromosomes 5DS and 1BL were detected with both increased NHI alleles coming from‘Ning 7840'. QNhi.hwwgr-5DS between markers Xgwm190 and Xcfd18 spanning about 7.2cM was significant across all five environments and explained 52.9% to 61.4% of the variance for NHI in different environments. QNhi.hwwgr-1BL was located between loci IWA4151 and Xgwm153 on the chromosome 1BL and explained 5.7% (ST01) and 5.6% (AL02) of the phenotypic variance.
Five additive QTL for SHI were identified on chromosomes 1DL, 2BL, 3AS, 5BL, and 5DS. QShi.hwwgr-5DS was the most significant QTL identified across all five environments. This QTL was located between Xgwm190 and Xcfd18; and the increased SHI allele was from Ning7840 and explained 60.2% to 70.4% of the phenotypic variance in various environments. Three QTL on chromosomes 1DL, 2BL, and 3AS were detected in two environments with the increased SHI alleles at QShi.hwwgr-2BL and QShi.hwwgr-3AS coming from Ning7840, and that at QShi.hwwgr-1DL was from Clark. QShi.hwwgr-2BL between markers IWA8195 and IWA7850 explained 3.6% (ST01) and 4.7% (ST02) of the phenotypic variance, QShi. hwwgr-3AS in the interval IWA6387–Xbarc12 accounted for 4.2% (AL02) and 5.6% (ST03) of the phenotypic variance, andQShi.hwwgr-1DL between Xgdm126 and Xbarc66 explained 6.5% and 7.2% of the phenotypic variation in ST01 and AL02, respectively. The smallest QTL, QShi.hwwgr-5BL, positioned in marker interval IWA5950–IWA2565 was detected in a single environment (ST01), with increased SHI allele from Ning7840 explaining 3.9% of the phenotypic variance.

eeffectsAL),d d dditivAltus(mmonCoLreporteusly[19][19]9][1al.[]9][19][1[19]netal.ndQTnetal.previoal.[]etnetal.etnetal.netal.netal.andaA),aSuSu–LiSuReifSuSuSu%)(Lc VEhomaAE–––––––––by(PLa7,ed38708 xplainwater(ST),A77,IWA7IW4,eeA14863ncts,StillA40]0]al.[]9]9][2[2[1[19]9][1[19][19]9][1[19][1etaetal.aetal.Reifnetal.Sunetal.Sunetal.netal.mymynetal.netal.netal.netal.–SuSuRaRaSu–SuSu–Su––––––––––1.75–––1 641 A264IW0 A25 5,9 IW289 6404615,A140A2A2IWA864A79,IWA2IWIW5 2,ariaer0,IW80075 IW7 02IW7 77885,97IW2,802,783 6,3308335,44picvennmmarkA350IWA4A363WAA3A7A2A4A6WAA3087946A319A4A3A6notyviro1,IW8,IW84,IIWIWIW9,3 IWIW0,IWIWIWIWed508,2,8,2,016868646,351 454,93123,A312502,76,IIW37813,7 7 9140406464enA7A112A4726.1 A4686437A2WAA217heWAWAWA93WAdpma6 0 IWho3,IW0246,I18A48246,I09,IWAA34002,I6,8282828222,IIWm3A5A7A73,gwIWIWA39,8,IWWAA2WAA4IWIWIW47390,2 2 258,75,IIW1,IW422,1 91.209,IIWWA13,I44esOklaanA2WAIWWA1875WA67WAIWIWWAA239WAA4IWA4IWA4IW75WAvalu9,IW063 9,1582,I2,4,hree2,2,2,DbLinkA36682,I49,I97,Imc42A22506,IA4mc96,I66A4A4A6A1A6arc2A466A466A449,IA6ODIWIWIWIWIWIWIWXwIWXbXwIWIWIWIWkers,LarAD0.3 0.3 0.2 0.3 0.4 0.3 0.8 0.5 0.8 0.5 1.0 0.6 0.9 0.9 dmalitytraitsintociatequE%11.522.020.120.521.514.710.510.311.49.1 29.512.413.329.4es,asseatgrainDaPVncwhLO3.9 7.9 5.4 7.3 6.7 5.5 3.7 4.9 4.2 3.5 8.4 3.7 4.0 9.4 valdistadforalcM1.0 1.0 9.6 4.9 8.1 3.4 1.3 0.4 9.6 ntervals,interetecteIntervin11.011.011.011.0cts(AE)dalterv3 026 0 461882A446180975136744A34002A2396 82c982A482A409A4ineffeA275kerinterWAWAWAWA–IwmWAMark9–IW06–I2–IW82–I–I–I499–IW4–IWWA2–IW2–IW2–IW988,A6A126A762258246,IIW98379643m15,0,0,6 1 67676212IWIWA3XwA6IWIWA3A5A5IWA418A6WAA5A6A7gw53A6A6A6A4wm9,mc73,Xmc37IWWAIWIWIWIWIWXg50156,IW5,3,8.1,IWIW8,9,9,9,5,IW057,IW7,16.3,X0,6,6,5,0,A7mc3340mc813953532,6682,I50mc96.1,IIWmc8036404032IWXgwm39Xw5.2,A52,IWXcfdXwwmXgXwA7IWXgwmwmXgA4IWA4IWA7IWXwarc1XbXwA2IWXbarc267A6IWA7IWA7IWA7mc15IWXw0.7 −0.6−0.90.6 0.5 1.0 0.9 0.9 −1.1−0.71.4 1.1 1.1 −0.9−0.8−0.9−0.7−0.7−1.7−0.7−1.2−1.00.6 15.518.026.413.38.3 13.811.710.212.05.9 27.613.011.18.5 9.6 9.5 4.9 12.925.36.2 20.614.24.8 6.3 4.4 9.1 6.2 3.8 5.7 5.0 7.6 7.8 4.6 9.7 9.3 8.0 6.1 4.1 6.9 3.7 3.9 15.24.5 8.2 5.6 3.9 0.8 1.3 1.3 1.7 5.1 2.6 1.7 2.9 10.410.411.01.0 0.8 1.3 4.0 4.0 4.4 6.2 2.5 4.0 4.0 7.7 2.2 8 98563 6.1 3 390 9 9 8 8 751 A6m126422 A34053824698961 91.243m15 0 0 6 1 5367676212mc73mc3737XwwmA76253XgwmwmXgA418WAA6WAA5A6A7A6A6A4wm–I5–IWgwA6–I9–IWgw6682972506–X66666649arns,monmeA3mc42A4IWIWA4IWA4IWIWA6IWA1XwIWXbA6arc226IWA8IWA4IWA4IWA4IWA6ationvir×eaksitionM)65413841409 403 3137373740elocPepo(c111917omditivev C)osadEnGP01STST02AL02ST03ST01ST02ST02ST01ST02LA03AL02ST03ST02ST03omnd03. –CQTtohrLa20content(A BSL.1 ALgr-5BLW)L S Grainproteingr-3(T)for01L QTgr-5gr-4ble1wwwwhtww20weigwwwgr-1DL S wgr-3Bwgr-4Awgr-4Bwgr-5ATa(ADDfrompc.hQGpc.hQGQGpc.hQGpc.hTestw.hwQTQTw.hwQTw.hwQTw.hwQTw.hw50–X225–IW39Xw5.2–mc339–478.1–IWA38–IWXg392–252–252–IW66–I9–IW8250mc96.1057–IWmc807–IW3616.3–X0–IW676–IW406–IW405–IWXg320–IWA7IWA1IWXcfdA52–XwIWXwA6mc81IWA7IWA5IWA5IWA4IWA4IWXwA7Xbarc1XwIWXbA2arc2IWA6IWA7IWA7IWXwA7mc15418 8 6.5 10131 65353614133941410 13891 109388979594692 AL02AL03LA03ST01ST01W)03ST02AL02ST01AL02ST02AL02ST01ST01ST03AL02ST01LA03ST01AL02ST03ST02AL02L.2 wgr-5AS S S wgr-5Awgr-5Bwgr-7Deight(SKSTBLgr-1BSgr-1DLgr-2BSgr-4ALgr-5ASgr-5ALgr-6B ALgr-6gr-7DLgr-7w.hww.hww.hww.hwCS-kernelw.h.hwwww.hww.hww.h.h.hwwwwww.h.hwwww.hwwQTQTQTQTSKQSkwQSkwQSkwQSkwQSkwQSkwQSkwQSkwQSkwQSkw
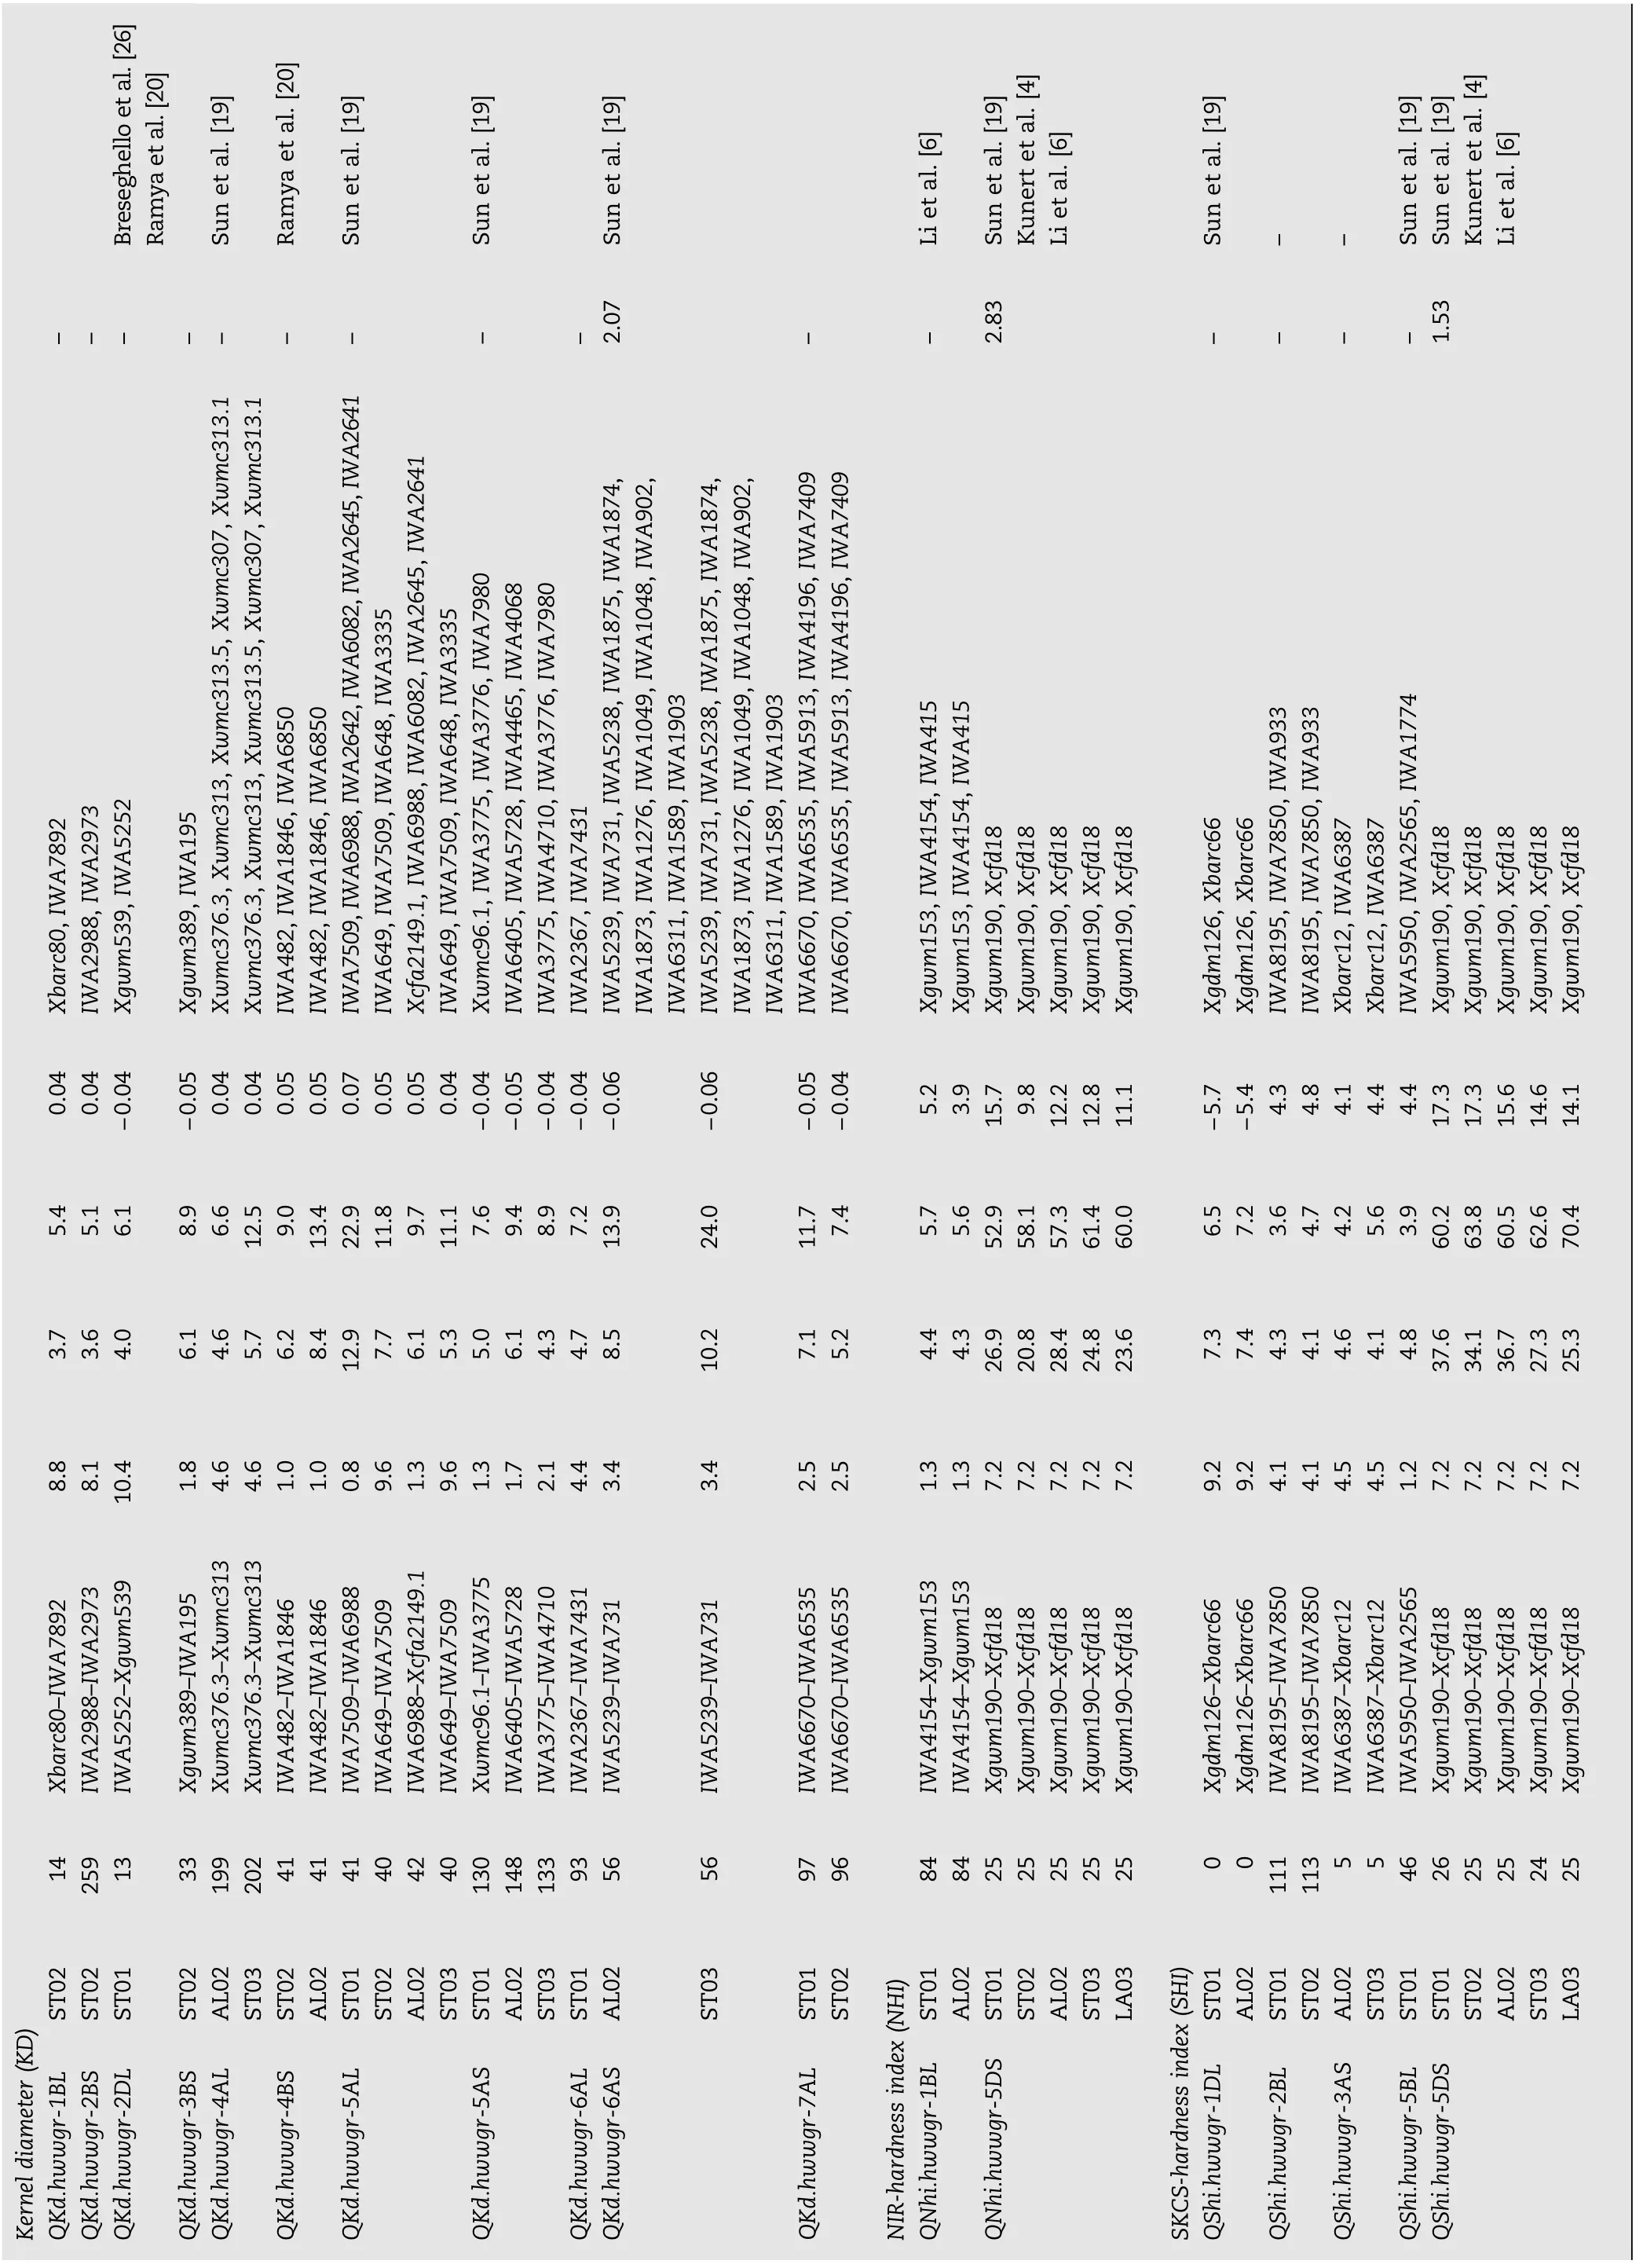
6][20][20][2[19][19][19][19]helloetal.Bresmyegaetal.aetal.Ranetal.SuRamynetal.Sunetal.Sunetal.Su–––––––––2.073.1 1 mc313.1 A264Xwmc31XwIW412674, 02, 9]9]9]9]al.[][1al.[]etal.[][1[1[1etal.[]al.[]Lietnetal.SuKunertLietSunetal.netal.netal.nertet––SuSuKuLi––2.83––––1.5374, 7,7,5,mc30mc30A264WA45,IWA18IWA902, 409 9 40WA18IWXw2,3304IWA9A7IWA7IW75,I8,5 26808 0 75,I8,Xw3.5,A608WA5 337906A718A104196,6,191898mc313.5,mc31A376,IIWIWWAIWA1A4A4WAIWIW82,IA3WAA4IW5,6,XwXw68506864502,8,60WA8,WAWAA464374677A338,I9,3 520490IWIWIW4 38,I9,3 3,3,A1A104909191151552WAA2IWIWA1A1A4A4333377WA643 2 3,3,WAIWWA2 899725950,1 A1mc31mc318,9809,I88,I09,I3772714331,I6,9,2758IWIWA5IWA5IWIWA9A9A14,4,IWIW0,0,IWIW5,31,I6,9,5,5,75,IIW8,A7A2A546,I46,IIWWA69IWIWIWIWXwXw1818A675WAWAWAA575A4A7IWIWA7A1A12758535315A415A418181818186 6 857 7 38561818181818A7IWIWA1A1A6IWWA0,IWWAarc898538,9,9,386.3,6.3,WA82,I82,I9,49.1,Imc96.1,IIW4077IWIWIWA6IWIWarc6arc685A7A738A6A23,3,0,0,0,0,0,IWXcfdXcfdXcfdXcfdXcfdXb6,6,5,5,IWXbIWIWA6IWIWXcfd0,0,0,0,0,0,XcfdXcfdXcfdXcfd5,5,7,9,3,1,9,3,1,0,0,A2wmwmmc3736238731235049,I49,IIWXbmc37IWXgXgXwXwA4IWA4IWA7IWIWXcfaA6A621IWXwIWA6IWA3IWA2IWA5IWA1IWA68731676715151919191919121219192,2,19191919IWA55 0.040.044 −0.0−0.00.040.040.050.050.070.050.050.044 5 4 4 6 −0.0−0.0−0.0−0.0−0.0IWA1IWA6IWA6IWA6XgwmXgwmXgwmXgwmXgwmXgwmXgwmXgdmXgdmIWA8IWXbA8arc1Xbarc19519IWXgA5wmXgwmXgwmXgwmXgwm6 −0.05.4 5.1 6.1 8.9 6.6 12.59.0 13.422.911.89.7 11.17.6 9.4 8.9 7.2 13.95 4 −0.0−0.05.2 3.9 15.79.8 12.212.811.1−5.7−5.44.3 4.8 4.1 4.4 4.4 17.317.315.614.614.124.03.7 3.6 4.0 6.1 4.6 5.7 6.2 8.4 12.97.7 6.1 5.3 5.0 6.1 4.3 4.7 8.5 11.77.4 5.7 5.6 52.958.157.361.460.06.5 7.2 3.6 4.7 4.2 5.6 3.9 60.263.860.562.670.410.28.8 8.1 10.41.8 4.6 4.6 1.0 1.0 0.8 9.6 1.3 9.6 1.3 1.7 2.1 4.4 3.4 7.1 5.2 4.4 4.3 26.920.828.424.823.67.3 7.4 4.3 4.1 4.6 4.1 4.8 37.634.136.727.325.33.4 3 3 8997532 3 9 95mc31mc314646988 0949.109758 0 1 37727143312.5 2.5 1.3 1.3 7.2 7.2 7.2 7.2 7.2 9.2 9.2 4.1 4.1 4.5 4.5 1.2 7.2 7.2 7.2 7.2 7.2 31A7A2wmA1Xw18WA18A6WA7521Xcfa75WAWAA5A4A7A7535 5 53153 3 15181818186 6 0 0 852 2 5 18181818A7–I0–IWarc8988–IWXg2–259–IWXw386.3–mc376.3–WAmc37–I–I9–IW828250–I8–4998–I49mc96.15–IW40775–IW367–IW239–IWA6A6wmXgwm18XgXcfdXcfdXcfdXcfdXcfdarc6Xbarc685XbA7A7arc1arc156XbA218XcfdXcfdXcfdXcfd239–IWXbIWA2IWA5XgwmXwXwIWA4IWA4IWA7IWA6IWA6IWXwA6IWA6IWA3IWA2IWA5670–IW670–IW154–15194–0–190–190–190–190–126–126–195–IW195–IWXb387–387–95190–IWXcfd0–190–190–190–190–IWA5149 2513339 2 19204141414042400 8 3 1314139356IWA6IWA6IWA4IWXgA4wmXgwmXgwmXgwmXgwmXgdmXgdmA8IWIWA8IWA6IWA6IWXgA5wmXgwmXgwmXgwmXgwm0 0 1 3 5 5 560202010202030202010202030102030102979684842525252525111146262525242503D)STSTSTSTALSTSTALSTSTALSTSTALSTSTAL0102I)01020102020303HI) 010201020203010102020303ST(KL S L S L S L S L S eterKernd.hwwgr-1Bwgr-2Bwgr-2Dwgr-3Bwgr-4Awgr-4Bwgr-5Awgr-5Awgr-6Awgr-6AeldiamQKQKd.hwQKd.hwQKd.hwQKd.hwQKd.hwQKd.hwQKd.hwQKd.hwQKd.hwSTSTNHSTALSTSTALSTLA(SexSTALSTSTALSTSTSTSTALSTLAL wgr-7Aindex(BLDSDLASnessgr-1gr-5essindBLgr-2gr-3BLDSgr-5gr-5d.hwNIR-hardwwhi.hwwardngr-1wwwwwwwwwwQKQNQNhi.hSKCS-hQShi.hQShi.hQShi.hQShi.hQShi.h
Notes to Table 1:
aLOD value at the center of the additive QTL.
bAdditive effect; a positive value implies the Ning7840 allele increased phenotypic value, whereas a negative value indicates the Clark allele increased phenotypic value.
cPhenotypic variance explained by the additive QTL×environment interaction.‘−' indicates no additive×environment effect.
dPreviously reported in the same chromosome region.‘−' indicates that the QTL was not reported previously.
3.2. Epistatic QTL for grain quality traits
Ten digenic epistatic QTL for grain quality traits were identified on wheat chromosomes 4BL/5DL, 3BL/3DS, 1DL/ 7DL, and 7BL/3BL for GPC, 7BL/3BS for TW, 2BL/5BS, 5DL/1DS, and 2AS/1DL for SKW, 1BL/3AS for NHI, and 4BL/5DL for SHI (Table 2). Among the four pairs of epistatic loci associated with GPC, three pairs (QGpc.hwwgr-3BL/3DS, QGpc.hwwgr-1DL/ 7DL, and QGpc.hwwgr-7BL/3BL) showed increased GPC and explained 6.9% to 13.8% of the phenotypic variance, whereas one pair (QGpc.hwwgr-4BL/5DL) showed reduced GPC and accounted for 17.7% of the phenotypic variance. QTw.hwwgr-7BL/3BS contributed 6.9% of the phenotypic variance for TW. Among the three pairs of epistatic QTL for SKW, QSkw.hwwgr-2BL/5BS and QSkw.hwwgr-2AS/1DL showed reduced SKW that accounted for 16.0% and 4.2% of the phenotypic variance, respectively, whereas QSkw.hwwgr-5DL/1DS showed increased SKW that explained 4.5% of the phenotypic variance. QNhi.hwwgr-1BL/3AS and QShi.hwwgr-4BL/5DL explained 1.8% and 0.9% of the phenotypic variance for NHI and SHI, respectively.
3.3. Interactions between QTL and environments
Four QTL with AE interactions and one pair of QTL with an AAE interaction were identified for SKW, KD, NHI, SHI, and GPC, respectively (Tables 1 and 2). AE interactions for four QTL (QSkw.hwwgr-6AL, QKd.hwwgr-6AS, QNhi.hwwgr-5DS, and QShi.hwwgr-5DS) accounted for 1.53% to 2.83% of the phenotypic variance (Table 1). The QTL pair, QGpc.hwwgr-1DL/7DL, was involved in an AAE interaction, and explained 0.42% of the phenotypic variation for GPC (Table 2).
4. Discussion
4.1. QTL for grain quality traits
Improved GPC is one of the primary objectives of wheat quality breeding. QTL for GPC were previously identified on several chromosomes [9,10,11], suggesting that multiple loci controlled wheat GPC. Even in studies where parental lines had smalldifferencesin GPC,QTLwerestilldetected.Inourstudy QTL for GPC were identified on chromosomes 4BS, 5AL, 5BL, and 3A, and the parent Ning7840 contributed the alleles for increased GPC.Amongthem,QGpc.hwwgr-4BSand QGpc.hwwgr-3Awerethe sameasthosereportedby Sunetal.[19].QGpc.hwwgr-4BSwasnot reported in other populations and may be a novel QTL for GPC. Four SNP markers were identified to closely link the QTL. We could not determine whether QGpc.hwwgr-5AL and QGpc.hwwgr-3A are the same QTL as reported previously [4,8,28], because different flanking markers were involved. However the QTL on 5BL was the same QTL as previously reported by Li et al. [6] because the QTL detected in both studies were located near SSR markers Xwmc28 and Xbarc59. Zhao et al. [7] identified two pairs of epistatic effects that increased GPC and explained 24.0% of the phenotypic variance. In the present study, we detected four QTL pairswithasignificantepistaticeffect.ThreeoftheQTLincreased GPC, whereas one had the largest negative effect on GPC and explained 17.7% of the phenotypic variance. One pair of epistatic QTL was involved in weak AAE interaction. These results suggested that although there were both additive and epistatic effects for GPC, additive effects played a major role in conditioning wheat GPC.
TW is considered an important trait in determining the market price of wheat. QTL for TW were previously identified on various chromosomes in different populations. For an example, Sun et al. [14] mapped seven QTL on chromosomes 2A, 3B, 4A, 5D, 6A, 6B, and 7B using recombinant inbred lines; Reif et al. [8] used association mapping to identify 12 QTL on chromosomes 1A, 3A, 5A (two), 7A, 1B, 3B, 6B, 1D, 3D, 4D, and 7D. Among them, only one QTL on chromosome 3B was identical in two studies, suggesting that TW was controlled by many genes. Using the Ning7840×Clark RIL population, Sun et al. [19] mapped eight QTL on chromosomes 1DL, 2DL, 4AS, 4B, 5AS, 5AL, 5BS, and 6AS and six of them, except for the QTL on 2DL and 6AS, were found in the present study. In addition, three new QTL were detected on chromosomes 3BL, 5AL, and 7DS. Among of them, QTw.hwwgr-5AL.2 might be the QTL identified by Reif et al. [8] because the two closely linked markers to each QTL were also closely linked. Only one epistatic QTL was found in this study and it explained 6.9% of the phenotypic variation, and AE or AAE interactions were not significant, showing that an additive effect contributed to the major genetic variance of TW.
Ten QTL for SKW were identified on chromosomes 1BL, 1BS, 2DL, 4BS, 5AL, 5AS, 6AL, 6B, 7AL, and 7DL. Ning7840 contributed 4.8%to27.6%ofphenotypicvariationatfive QTLand Clarkalleles contributed 4.9% to 25.3% of phenotypic variation at other five. This result indicated that both parents contributed alleles for increased SKW. The most significant QTL was QSkw.hwwgr-4BS. This QTLexplained27.6%(ST02)and13.0%(AL02)ofthevariation for SKW and is likely the same QTL as reported by Ramya et al. [20]. Another prominent QTL, QSkw.hwwgr-7AL, that explained 6.2% to 20.6% of the phenotypic variance for SKW in this study,had notbeen reported in other populationsand thereforemay be novel. Ramya et al. [20] reported a TKW-associated marker Xgwm539 on 2D, suggesting commonality with QSkw.hwwgr-2DL identified in this study. Three pairs of epistatic QTL were identifiedandexplained4.2%to16.0%ofthephenotypicvariance for SKW. One additive QTL, QSkw.hwwgr-6AL, was involved in AE interaction that contributed 1.75% to the phenotypic variance. Thus, additive QTL mainly controls SKW, however, digenic epistasis and environments may also affect expression of some QTL.
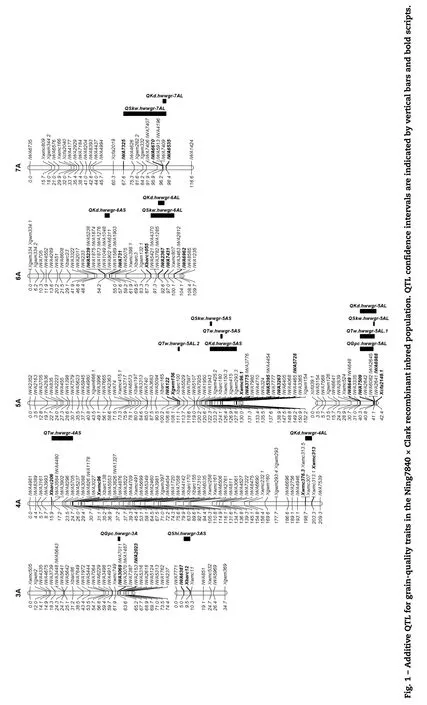
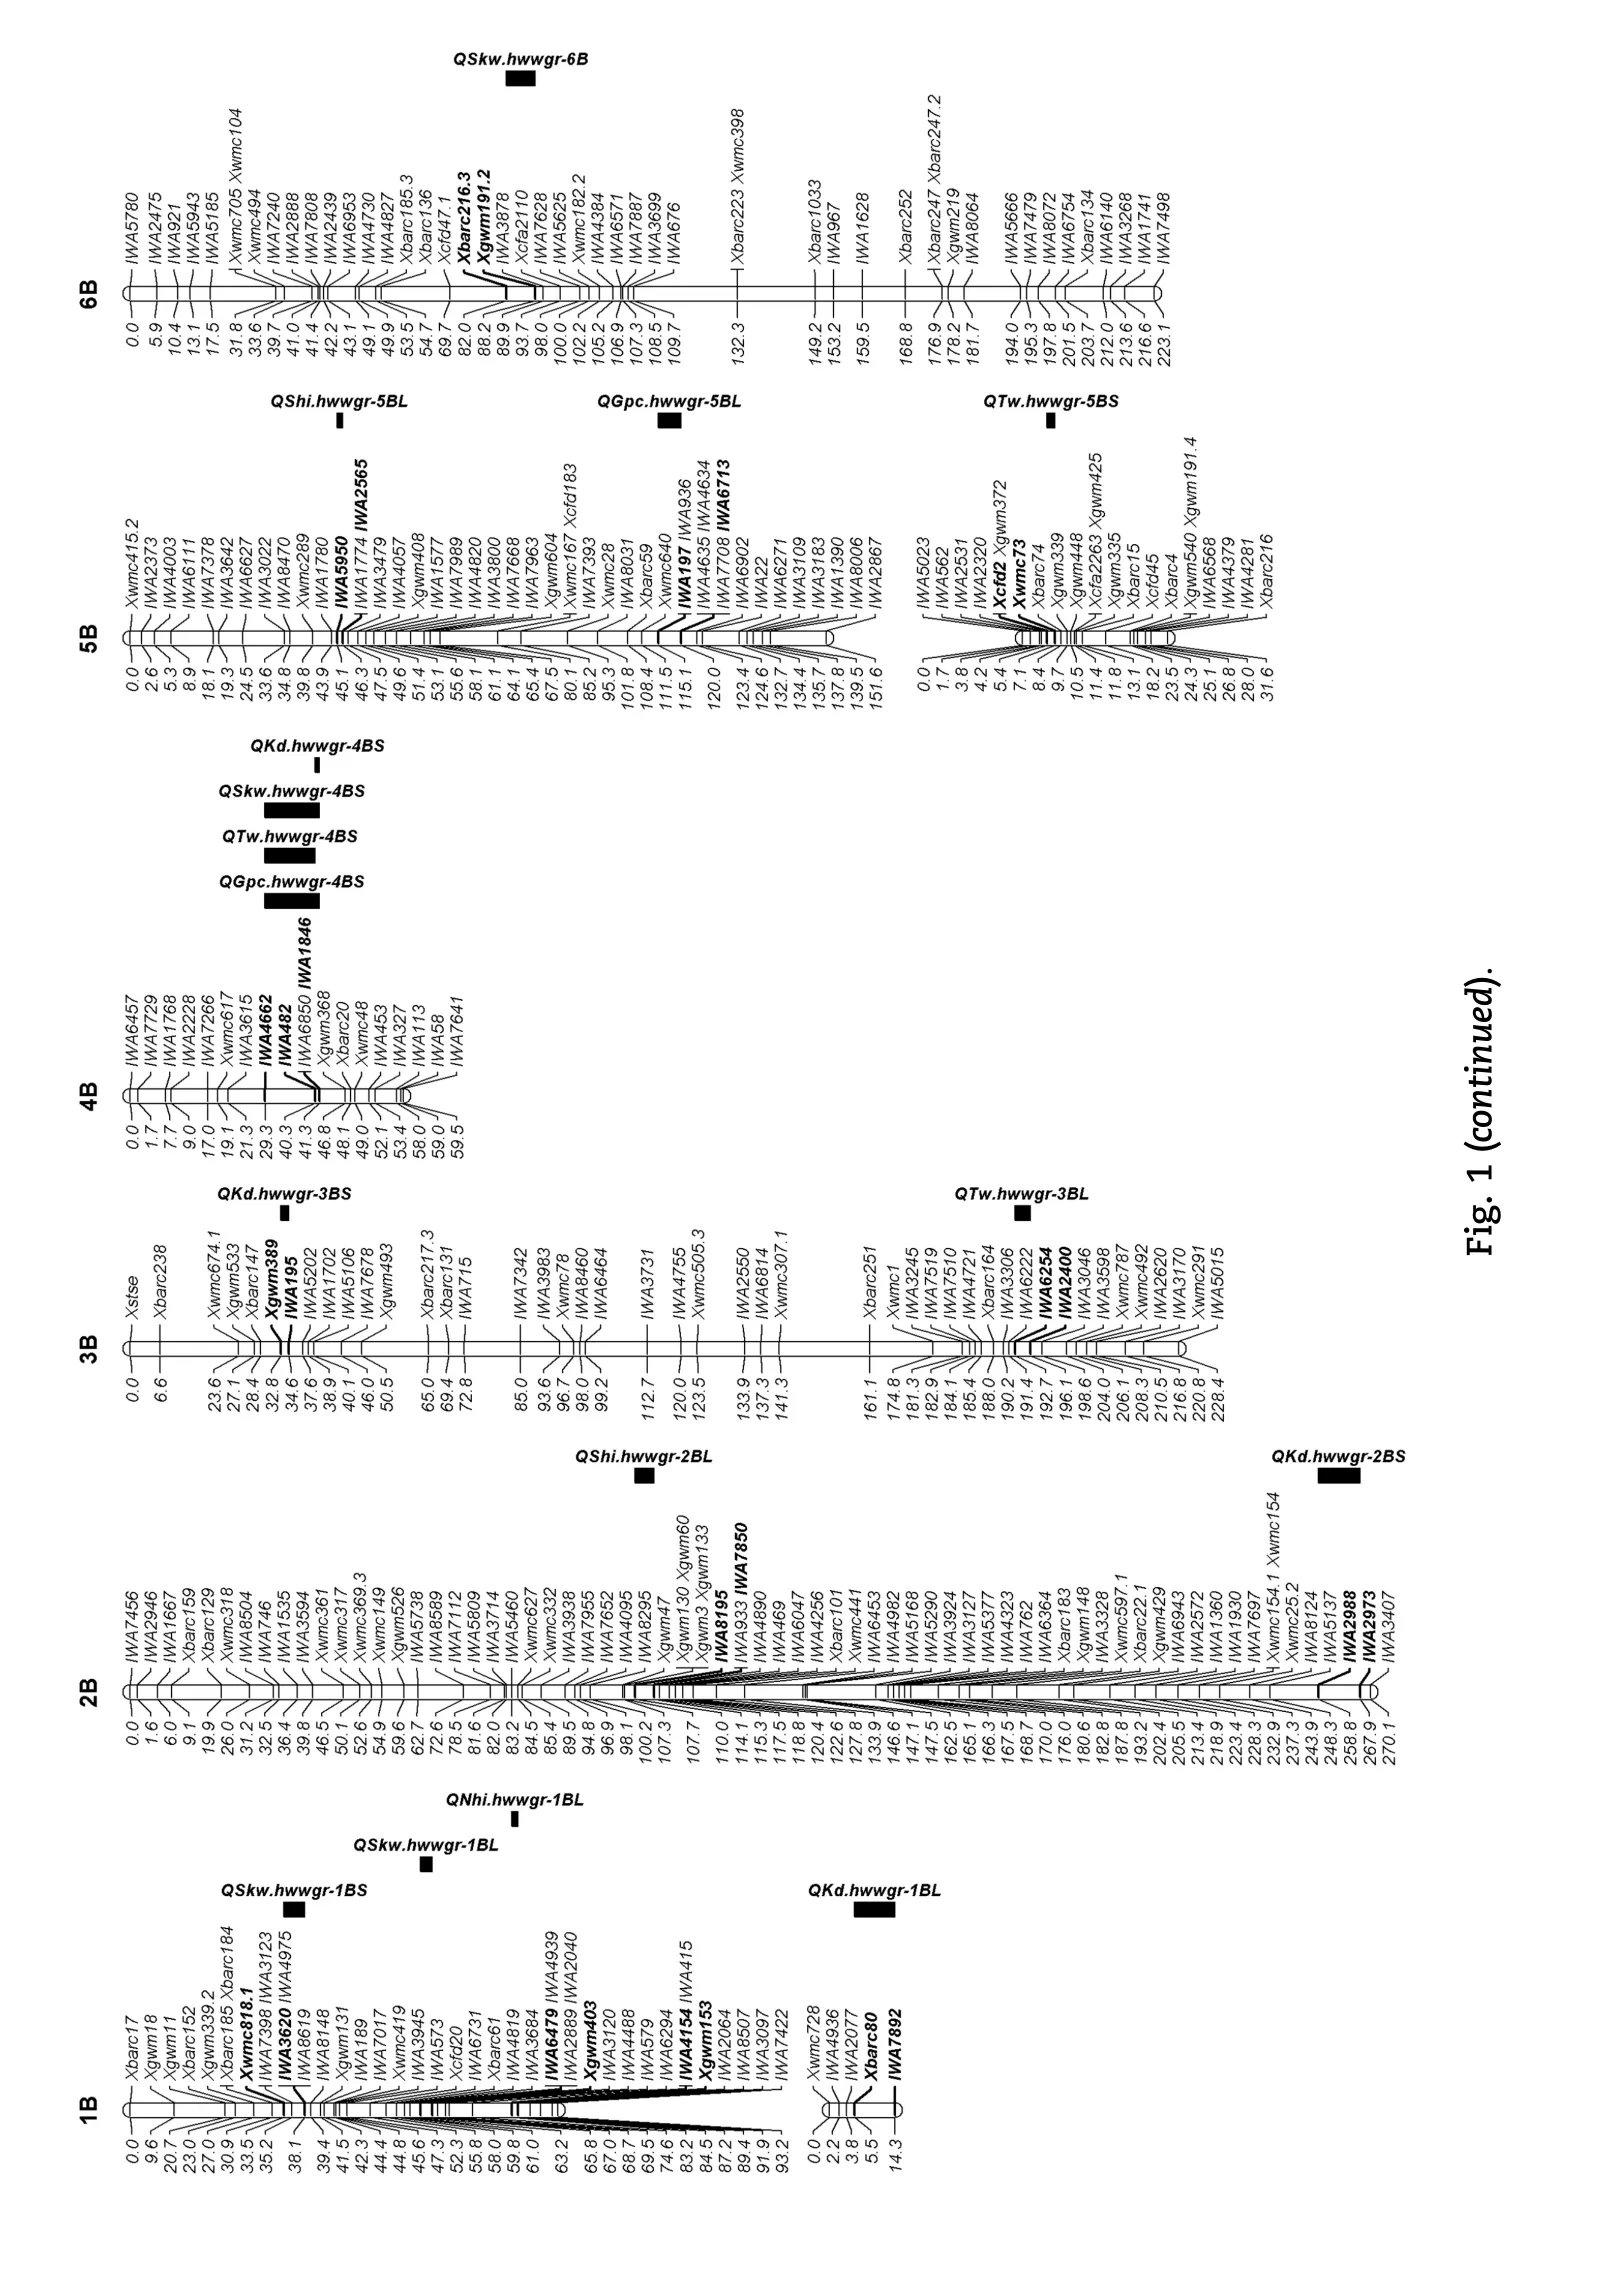

Fig. 1 (continued).
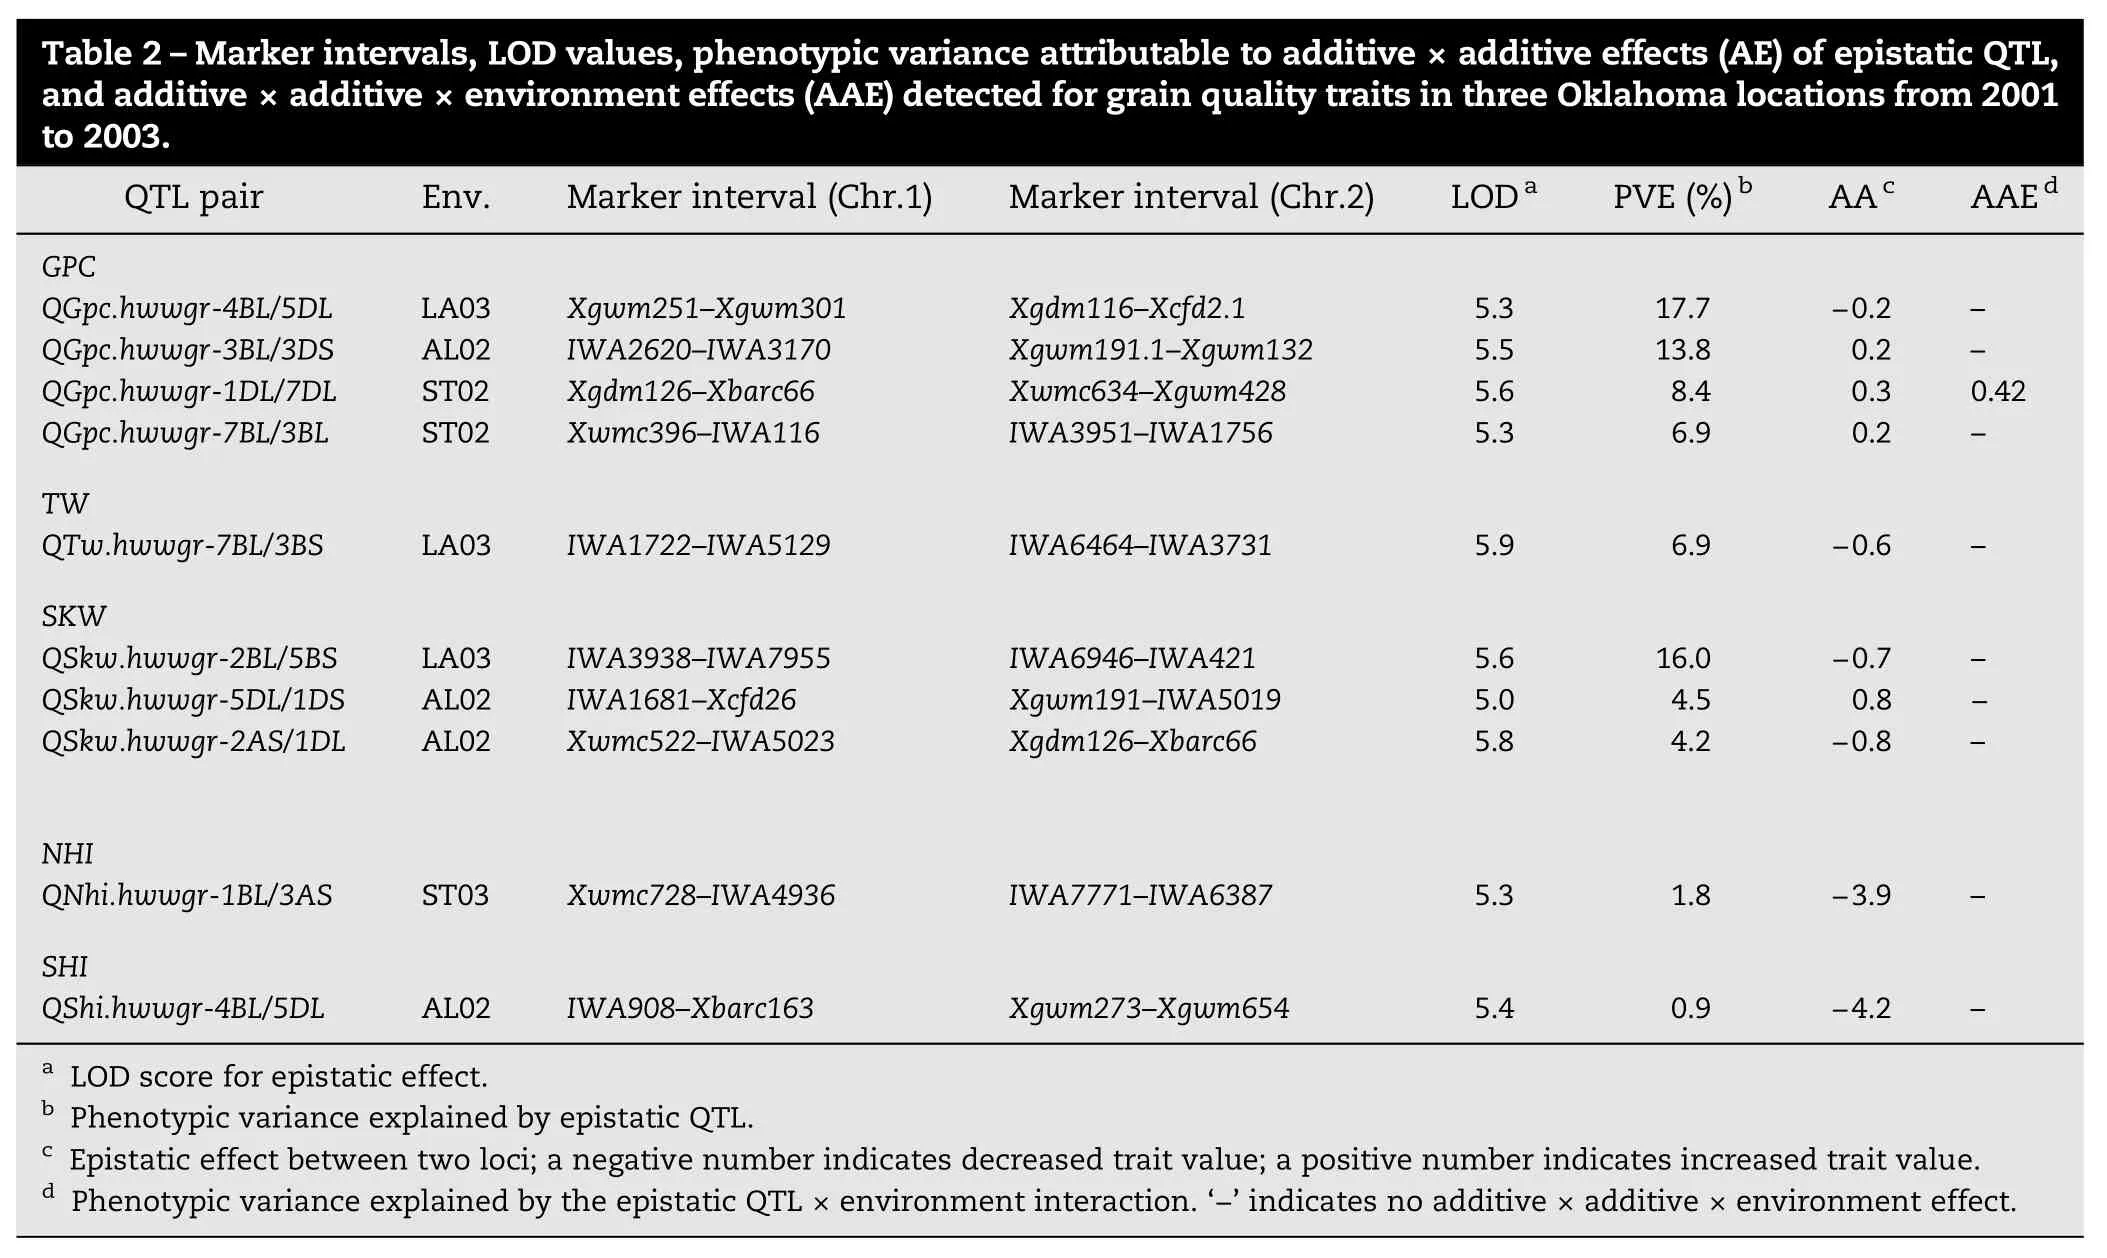
Table 2–Marker intervals, LOD values, phenotypic variance attributable to additive×additive effects (AE) of epistatic QTL, and additive×additive×environment effects (AAE) detected for grain quality traits in three Oklahoma locations from 2001 to 2003. QTL pair Env. Marker interval (Chr.1) Marker interval (Chr.2) LODa PVE (%)b AAc AAEdGPC QGpc.hwwgr-4BL/5DL LA03 Xgwm251–Xgwm301 Xgdm116–Xcfd2.1 5.3 17.7 −0.2 –QGpc.hwwgr-3BL/3DS AL02 IWA2620–IWA3170 Xgwm191.1–Xgwm132 5.5 13.8 0.2 –QGpc.hwwgr-1DL/7DL ST02 Xgdm126–Xbarc66 Xwmc634–Xgwm428 5.6 8.4 0.3 0.42 QGpc.hwwgr-7BL/3BL ST02 Xwmc396–IWA116 IWA3951–IWA1756 5.3 6.9 0.2 –TW QTw.hwwgr-7BL/3BS LA03 IWA1722–IWA5129 IWA6464–IWA3731 5.9 6.9 −0.6 –SKW QSkw.hwwgr-2BL/5BS LA03 IWA3938–IWA7955 IWA6946–IWA421 5.6 16.0 −0.7 –QSkw.hwwgr-5DL/1DS AL02 IWA1681–Xcfd26 Xgwm191–IWA5019 5.0 4.5 0.8 −QSkw.hwwgr-2AS/1DL AL02 Xwmc522–IWA5023 Xgdm126–Xbarc66 5.8 4.2 −0.8 –NHI QNhi.hwwgr-1BL/3AS ST03 Xwmc728–IWA4936 IWA7771–IWA6387 5.3 1.8 −3.9 –SHI QShi.hwwgr-4BL/5DL AL02 IWA908–Xbarc163 Xgwm273–Xgwm654 5.4 0.9 −4.2 –aLOD score for epistatic effect.bPhenotypic variance explained by epistatic QTL.cEpistatic effect between two loci; a negative number indicates decreased trait value; a positive number indicates increased trait value.dPhenotypic variance explained by the epistatic QTL×environment interaction.‘−' indicates no additive×additive×environment effect.
Among 11 QTL identified for KD, six (QKd.hwwgr-4AL, QKd.hwwgr-5AL, QKd.hwwgr-5AS, QKd.hwwgr-6A, QKd.hwwgr-4BS, and QKd.hwwgr-7AL) were significant in more than two environmentsandfourofthemweredetectedby Sunetal.[19]in the same population, indicating these QTL are relatively stable. Moreover, these QTL contributed major genetic effects to phenotypic variance for KD and may be new QTL for KD except for QKd.hwwgr-4BS that might be the same QTL as reported by Ramya et al. [20] because of linked common marker Xwmc617. Five QTL on chromosomes 1BL, 2BS, 2DL, 3BS, and 6AL weresignificant only in single environments and explained 5.1% to 8.9% of the phenotypic variance. Among them, QKd.hwwgr-2DL, closely linked to Xgwm539, was coincident with QTL reported by Breseghelloetal.[26]and Ramyaetal.[20].Inaddition,six QTLfor KDwerelocatedonthesamechromosomeregionsasthe QTLfor SKW, agreeing with a previous report that QTL for KD is a major contributor to kernel weight [14]. In the present study, epistasis was not identified for KD and only one QTL, QKd.hwwgr-6AS, was involved in AE interaction, explaining only 2.07% of the phenotypic variation, and thus indicating that additive effect mainly contributes to genetic variation of KD.
In this study grain hardness was estimated using both SKCS-hardness index (SHI) and NIR-hardness and only one common QTL with a major effect was located at the Ha locus on chromosome 5DS. This QTL was significant across all five environments and explained the highest variation in hardness (52.9% to 61.4% for NHI and 60.2% to 70.4% for SHI). This QTL was reported in many previous studies [4,6], and is the major genetic determinant of grain hardness in wheat. This QTL was also involved in AE interaction, and explained 2.8% of the NHI variance and 1.5% of the SHI variance. A minor QTL on 1BL (QNhi.hwwgr-1BL) was detected only by NHI and accounted for about 6.0% of the phenotypic variance in two environments. This QTL likely corresponds to a major QTL reported by Li et al. [6]. For SHI, four additional minor QTL were found on chromosomes 1DL, 2BL, 3AS and 5BL but were significant in only one or two environments and explained 3.9% to 7.2% of the phenotypic variance. The results confirmed that the kernel hardness is mainly controlled by Halocus on 5DS, but some minor QTL may also modify the expression of the gene in different environments.
4.2. QTL with pleiotropic effects
Previous researches showed that QTL/genes in wheat are often located in gene-rich regions and some QTL/genes controlling different traits may be mapped in the same genomic region to form clusters [14,43]. Such QTL may have consistent effect across differenttraits,andcanbeusedinmarker-assistedselectionafter furthervalidationinrelevantpopulations[14,28,33].Inthisstudy, seven coincident QTL for different traits were detected on chromosomes 2DL, 4BS, 5AL, 5AS, 5DS, 6AL, and 7AL. Among them,twostable QTLclustersinfluencing GPC,TW,SKW,and KD were mapped on chromosomes 4BS and 5AL, and Ning7840 contributed the favorable alleles, suggesting that the two QTL clusters may in fact be pleiotropic effects. It is also possible that they represent linked genes, especially between QTL for GPC and otherthreetraitsintheclusters.Both QTLnotonlyshowedmajor effects on the four traits but were also stable across environments. Several closely linked SNP markers in both clusters (four forthe4BSclusterandnineforthe5ALcluster)suggestthatthese SNPs might be useful for marker-assisted pyramiding of these QTL to improve grain quality.
Four co-located QTL for SKW and KD were located on chromosomes 2DL, 5AS, 6AL, and 7AL. Clark alleles increased KD at these loci, thus increasing SKW. This is understandable because Clark has larger KD and SKW than Ning7840. Sixteen closely linked SNPs found for these pleiotropic QTL can be used to select new cultivars with larger/heavier seeds.
Acknowledgments
This is contribution number 15-264-J from the Kansas Agricultural Experiment Station. This project is partly funded by the National Research Initiative Competitive Grants CAP Project 2011-68002-30029 from the USDA National Institute of Food and Agriculture; and Science and Technology Innovation Team Plan (2014KCT-25) from Shaanxi province, China. The authors thank the International Wheat SNP Consortium for assembling wheat 9KiSelect chips. Mention of trade names or commercial products in this publication is solely for the purpose of providing specific information and does not imply recommendation or endorsement by the US Department of Agriculture. USDA is an equal opportunity provider and employer.
R E F E R E N C E S
[1] M. Prasad, N. Kumar, P.L. Kulwal, M.S. Röder, H.S. Balyan, H.S. Dhaliwal, P.K. Gupta, QTL analysis for grain protein content using SSR markers and validation studies using NILs in bread wheat, Theor. Appl. Genet. 106 (2003) 659–667.
[2] A.S. Turner, R.P. Bradburne, L. Fish, J.W. Snape, New quantitative trait loci influencing grain texture and protein content in bread wheat, J. Cereal Sci. 40 (2004) 51–60.
[3] X.Q. Huang, S. Cloutier, L. Lycar, N. Radovanovic, D.G. Humphreys, J.S. Noll, D.J. Somers, P.D. Brown, Molecular detection of QTL for agronomic and quality traits in a doubled haploid population derived from two Canadian wheat (Triticum aestivum L.), Theor. Appl. Genet. 113 (2006) 753–766.
[4] A. Kunert, A.A. Naz, O. Dedeck, K. Pillen, J. Léon, AB-QTL analysis in winter wheat:Ι. Synthetic hexaploid wheat (T. turgidum ssp. dicoccoides×T. tauschii) as a source of favorable alleles for milling and baking quality traits, Theor. Appl. Genet. 115 (2007) 683–695.
[5] W. Zhang, S. Chao, F. Manthey, O. Chicaiza, J.C. Brevis, V. Echenique, J. Dubcovsky, QTL analysis of pasta quality using a composite microsatellite and SNP map of durum wheat, Theor. Appl. Genet. 117 (2008) 1361–1377.
[6] Y.L. Li, Y. Song, R.H. Zhou, G. Branlard, J.Z. Jia, Detection of QTL for bread-making quality in wheat using a recombinant inbred line population, Plant Breed. 128 (2009) 235–243.
[7] L. Zhao, K.P. Zhang, B. Liu, Z.Y. Deng, H.L. Qu, J.C. Tian, A comparison of grain protein content QTL and flour protein content QTL across environments in cultivated wheat, Euphytica 174 (2010) 325–335.
[8] J.C. Reif, M. Gowda, H.P. Maurer, C.F.H. Longin, V. Korzun, E. Ebmeyer, R. Bothe, C. Pietsch, T. Würschum, Association mapping for quality traits in soft winter wheat, Theor. Appl. Genet. 122 (2011) 961–970.
[9] J. Li, F. Cui, A.M. Ding, C.H. Zhao, X.Q. Wang, L. Wang, Y.G. Bao, X.L. Qi, X.F. Li, J.R. Gao, D.S. Feng, H.G. Wang, QTL detection of seven quality traits in wheat using two related recombinant inbred line population, Euphytica 183 (2012) 207–226.
[10] M. Bogard, V. Allard, P. Martre, E. Heumez, J.W. Snape, S. Orford, S. Griffiths, O. Gaju, J. Foulkes, J.L. Gouis, Identifying wheat genomic regions for improving grain protein concentration independently of grain yield using multiple inter-related populations, Mol. Breed. 31 (2013) 587–599.
[11] M. Echeverry-Solarte, A. Kumar, S. Kianian, S. Simsek, M.S. Alamri, E.E. Mantovani, P.E. McClean, E.L. Deckard, E. Elias, B. Schatz, S.S. Xu, M. Mergoum, New QTL alleles for quality-related traits in spring wheat revealed by RIL population derived fromsupernumerary×non-supernumerary spikelet genotypes, Theor. Appl. Genet. 128 (2015) 893–912.
[12] C.A. McCartney, D.J. Somers, D.G. Humphreys, O. Lukow, N. Ames, J. Noll, S. Cloutier, B.D. McCallum, Mapping quantitative trait loci controlling agronomic traits in the spring wheat cross RL4452בAC Domain', Genome 48 (2005) 870–883.
[13] B. Narasimhamoorthy, B.S. Gill, A.K. Fritz, J.C. Nelson, G.L. Brown-Guedira, Advanced backcross QTL analysis of a hard winter wheat×synthetic wheat population, Theor. Appl. Genet. 112 (2006) 787–796.
[14] X.Y. Sun, K. Wu, Y. Zhao, F.M. Kong, G.Z. Han, H.M. Jiang, X.J. Huang, R.J. Li, H.G. Wang, S.S. Li, QTL analysis of kernel shape and weight using recombinant inbred lines in wheat, Euphytica 165 (2009) 615–624.
[15] D. Bennett, A. Izanloo, M. Reynolds, H. Kuchel, P. Langridge, T. Schnurbusch, Genetic dissection of grain yield and physical grain quality in bread wheat (Triticum aestivum L.) under water-limited environments, Theor. Appl. Genet. 125 (2012) 255–271.
[16] R.M. Patil, S.A. Tamhankar, M.D. Oak, A.L. Raut, B.K. Honrao, V.S. Rao, S.C. Misra, Mapping of QTL for agronomic traits and kernel characters in durum wheat (Triticum durum Desf.), Euphytica 190 (2013) 117–129.
[17] N. Kumar, P.L. Kulwal, A. Gaur, A.K. Tyagi, J.P. Khurana, P. Khurana, H.S. Balyan, P.K. Gupta, QTL analysis for grain weight in common wheat, Euphytica 151 (2006) 135–144.
[18] S.S. Li, J.Z. Jia, X.Y. Wei, X.C. Zhang, L.Z. Li, H.M. Chen, Y.D. Fan, H.Y. Sun, X.H. Zhao, T.D. Lei, Y.F. Xu, F.S. Jiang, H.G. Wang, L.H. Li, A intervarietal genetic map and QTL analysis for yield traits in wheat, Mol. Breed. 20 (2007) 167–178.
[19] X.C. Sun, F. Marza, H.X. Ma, B.F. Carver, G.H. Bai, Mapping quantitative trait loci for quality factors in an inter-class of US and Chinese wheat, Theor. Appl. Genet. 120 (2010) 1041–1051.
[20] P. Ramya, A. Chaubal, K. Kulkarni, L. Gupta, N. Kadoo, H.S. Dhaliwal, P. Chhuneja, M. Lagu, V. Gupta, QTL mapping of 1000-kernel weight, kernel length, and kernel width in bread wheat (Triticum aestivum L.), J. Appl. Genet. 51 (2010) 421–429.
[21] Z.Q. Su, C.Y. Hao, L.F. Wang, Y.C. Dong, X.Y. Zhang, Identification and development of a functional marker of TaGW2 associated with grain weight in bread wheat (Triticum aestivum L.), Theor. Appl. Genet. 122 (2011) 211–223.
[22] R.R. Mir, N. Kumar, V. Jaiswal, N. Girdharwal, M. Prasas, H.S. Balyan, P.K. Gupta, Genetic dissection of grain weight in bread wheat through quantitative trait locus interval and association mapping, Mol. Breed. 29 (2012) 963–972.
[23] F. Cui, C.H. Zhao, A.M. Ding, J. Li, L. Wang, X.F. Li, Y.G. Bao, J.M. Li, H.G. Wang, Construction of an integrative linkage map and QTL mapping of grain yield-related traits using three related wheat RIL populations, Theor. Appl. Genet. 127 (2014) 659–675.
[24] K.G. Campbell, C.J. Bergman, D.G. Gualberto, J.A. Anderson, M.J. Giroux, G. Hareland, Quantitative trait loci associated with kernel traits in soft×hard wheat cross, Crop Sci. 39 (1999) 1184–1195.
[25] B.B. Dholakia, J.S.S. Ammiraju, H. Singh, M.D. Lagu, M.S. Röder, V.S. Rao, Molecular marker analysis of kernel size and shape in bread wheat, Plant Breed. 122 (2003) 392–395.
[26] F. Breseghello, M.E. Sorrells, Association mapping of kernel size and milling quality in wheat (Triticum aestivum L.) cultivars, Genetics 177 (2006) 1165–1177.
[27] F. Breseghello, M.E. Sorrells, QTL analysis of kernel size and shape in two hexaploid wheat mapping populations, Field Crop Res. 101 (2007) 172–179.
[28] T.J. Tsilo, G.A. Hareland, S. Simsek, S. Chao, J.A. Anderson, Genome mapping of kernel characteristics in hard red spring wheat breeding lines, Theor. Appl. Genet. 121 (2010) 717–730.
[29] M. Arbelbide, R. Bernardo, Mixed-model QTL mapping for kernel hardness and dough strength in bread wheat, Theor. Appl. Genet. 112 (2006) 885–890.
[30] A.A. Galande, R. Tiwari, J.S.S. Ammiraju, D.K. Santra, M.D. Lagu, V.S. Rao, V.S. Gupta, B.K. Misra, S. Nagarajan, P.K. Ranjekar, Genetic analysis of kernel hardness in bread wheat using PCR-based markers, Theor. Appl. Genet. 103 (2001) 601–606.
[31] S. Crepieux, C. Lebreton, P. Flament, G. Charmet, Application of a new IBD-based QTL mapping method to common wheat breeding population: analysis of kernel hardness and dough strength, Theor. Appl. Genet. 111 (2005) 1409–1419.
[32] R.M. Weightman, S. Millar, J. Alava, M.J. Foulkes, L. Fish, J.W. Snape, Effects of drought and the presence of the 1BL/1RS translocation on grain vitreosity, hardness and protein content in winter wheat, J. Cereal Sci. 47 (2008) 457–468.
[33] G.M. Wang, J.M. Leonard, A.S. Ross, C.J. Peterson, R.S. Zemetra, K.G. Campbell, O. Riera-Lizarazu, Identification of genetic factors controlling kernel hardness and related traits in a recombinant inbred population derived from a softבextra-soft' wheat (Triticum aestivum L.) cross, Theor. Appl. Genet. 124 (2012) 207–221.
[34] H.M. Li, H. Liang, Z.X. Tang, H.Q. Zhang, B.J. Yan, Z.L. Ren, QTL analysis for grain pentosans and hardness index in a Chinese 1RS.1BL×non-1RS.1BL wheat cross, Plant Mol. Biol. Report. 31 (2013) 477–484.
[35] S. Deschamps, M. Campbell, Utilization of next-generation sequencing platforms in plant genomics and genetic variant discovery, Mol. Breed. 25 (2010) 553–570.
[36] J. Jannink, A.J. Lorenz, Genomic selection in plant breeding: from theory to practice, Brief. Funct. Genomics 9 (2010) 166–177.
[37] G.H. Bai, F.L. Kolb, G. Shaner, L.L. Domier, Amplified fragment length polymorphism markers linked to a major quantitative trait locus controlling scab resistance in wheat, Phytopathology 89 (1999) 343–348.
[38] H.W. Ohm, G. Shaner, J.E. Foster, F.L. Patterson, G. Buechley, Registration of Clark wheat, Crop Sci. 28 (1988) 1031–1032.
[39] D.D. Zhang, G.H. Bai, C.S. Zhu, J.M. Yu, B.F. Carver, Genetic diversity, population structure, and linkage disequilibrium in U.S. elite winter wheat, Plant, Genome 3 (2010) 117–127.
[40] C. Cavanagh, S. Chao, S. Wang, B.E. Huang, S. Stephen, S. Kiani, K. Forrest, C. Saintenac, B. Brown-Guedira, A. Akhunova, D. See, G. Bai, M. Pumphrey, L. Tomar, D. Wong, S. Kong, M. Reynolds, M.L. da Silva, H. Bockelman, L. Talbert, J.A. Anderson, S. Dreisigacker, S. Baenziger, A. Carter, V. Korzun, P.L. Morrell, J. Dubcovsky, M. Morell, M. Sorrells, M. Hayden, E. Akhunov, Genomewide comparative diversity uncovers multiple targets of selection for improvement in hexaploid wheat landraces and cultivars, Proc. Natl. Acad. Sci. U. S. A. 110 (2013) 8507-8062.
[41] C.L. Li, G.H. Ba, B.F. Carver, S. Chao, Z.H. Wang, Single nucleotide polymorphism markers linked to QTL for wheat yield traits, Euphytica (2015), http://dx.doi.org/10.1007/ s10681-015-1475-3.
[42] J.K. Wang, H.H. Li, L.Y. Zhang, L. Meng, QTL IciMapping Version 3.2, 2012Webpage http://www.isbreeding.net.
[43] J.S. Wang, W.H. Liu, H. Wang, L.H. Li, J. Wu, X.M. Yang, X.Q. Li, A.N. Gao, QTL mapping of yield-related traits in the wheat germplasm 3228, Euphytica 177 (2011) 277–292.
杂志排行
The Crop Journal的其它文章
- 7th International Crop Science Congress Announcement
- Editorial Board of The Crop Journal
- Comparisons of phaseolin type and α-amylase inhibitor in common bean (Phaseolus vulgaris L.) in China
- Genotypic variation for seed protein and mineral content among post-rainy season-grown sorghum genotypes
- Fosmid library construction and screening for the maize mutant gene Vestigial glume 1
- Intra-population genetic variance for grain iron and zinc contents and agronomic traits in pearl millet