Specific yield of phreatic variation zone in karst aquifer with the method of water level analysis
2015-12-12GONGXiaopingJIANGGuanghuiCHENChangjieGUOXiaojiaoZHANGHuasheng
GONG Xiao-ping, JIANG Guang-hui, CHEN Chang-jie, GUO Xiao-jiao, ZHANG Hua-sheng,3
1Key laboratory of Karst dynamics, CAGS/Laboratory of Karst Dynamics, MLR & GZAR/International Karst Research Centre under the Auspices of UNESCO, Guilin, Guangxi 541004, China.
2China University of Geosciences, Beijing 100083, China.
3School of Geographical Science, Southwest University, Chongqing 400715, China.
Abstract: Regime of groundwater level is a comprehensive reflection of the hydrogeological environment from the perspective of groundwater. Based on the analysis of the water-level change of 65 groundwater monitoring points from 1987 to 1990, it is found that intermittent cones of depression came into being due to groundwater exploitation in Guilin during the observation period. The buried depth of groundwater in the drawdown cones, the annual variation of water level and specific yield have higher values. Improvement has been made to the formula of infiltration coefficient of precipitation. By using the precipitation response data recorded at every 15 minutes for water level of No. 9 borehole which is near Zengpiyan Cave,the specific yield of phreatic variation zone is indirectly calculated by using the modified formula. The results are range from 0.012 to 0.462 and the spatial distribution of specific yield is ascertained. These make up the deficiency that empirical values cannot be categorized based on the actual conditions. What’s more, the widely used Aviriyanover’s empirical formula is poorly applicable to karst area. This is due to its strict requirement for outside conditions, such as shallow buried depth, homogeneous aquifer medium and small hydraulic gradient.
Keywords: Regime of groundwater level; Specific yield; Karst area; Phreatic variation zone;Guilin City
Introduction
Hydrogeological parameters are indispensable data to all kinds of hydrological calculation and hydrological dynamic forecasting among which specific yield (μ) is one of the most important parameter in the calculation of groundwater resources. Moreover the specific yield is directly related to the accuracy and reliability (LIU Xue-jun and YANG Wei-ren, 2003; PANG Ying and ZHANG Xiao-hong, 2006; LI Yang et al. 2007)of groundwater evaluation results in terms of both water balance calculation and computer simulations. Therefore, the improvement of accuracy in the specific yield calculation is of significantly practical value to the evaluation of water resources in some areas. There are various accesses to gain specific yield, mainly including laboratory experiment, pumping test, analyticcal calculation of dynamic observation data, water balance analysis, etc. Although each method has its advantages and disadvantages (YE Shui-ting et al.1982; NIU Zhen-hong, 2003; LI Yang et al. 2007;LI Jin-zhu, 2009), analytical calculation by dynamic observation data of groundwater level is one of the best methods in reflecting the field conditions with a comprehensive manner.
In the karst area of South China, the high channelization and unevenness of aquifer medium make water-level fluctuation sensitive (WANG Da-chun, 1986; ZOU Cheng-jie, 1995) in responding to precipitation. They also make it more difficult to acquire hydrogeological parameters. So how to obtain and enhance the accuracy of hydrogeological parameters in karst area remains a problem need to be further studied.Based on the groundwater dynamic information of the 65 boreholes in the period between 1987 and 1990 in Guilin and meteorological data (China Meteorological Administration, 2014), the paper analyzes the characters of water-level fluctuation in the karst aquifer of the Guilin basin. Moreover the paper raises an improved formula about precipitation infiltration coefficient calculation.With the new formula, the specific yield of phreatic variation zone of the karst aquifer in Guilin basin is gained. On the basis of the calculation, the spatial distribution of specific yield is ascertained, which provides useful information for improving water resources forecast and management.
1 Overview of the study area
Guilin City is located in the northeast of Guangxi Zhuang Autonomous Region in South China. It has a subtropical monsoon climate where precipitation distributes unevenly in seasons,mainly happening between April and August, but declining obviously in other months. According to the statistics of the meteorological data from 1951 to 2013 at the Guilin Weather Station, the average temperature in this period is 19.09 ℃, the average precipitation is 1 856.4 mm and the annually average evaporative capacity is 1 300 mm (China Meteorological Administration, 2014). The period between May and June in Guilin could be considered as an especially rich precipitation time,which account for 37.3% precipitation of the whole year.
About one percent area of Guilin, is covered by water body, such as lakes, rivers, streams and their trenches, mainly distributed in the city center. The biggest river in Guilin, the Lijiang River, has an average flux of about 130 m3/s (HUANG Chang-jin et al. 1984). The karst in Guilin is extremely well developed to be considered as atypical example in southern China, which is called as peak-forest and peak cluster, or described as karst and cone karst with many splendid caves.The formation of karst is resulted from rich precipitation, large area of pure limestone and the influx of allogenic water with strong erosiveness.
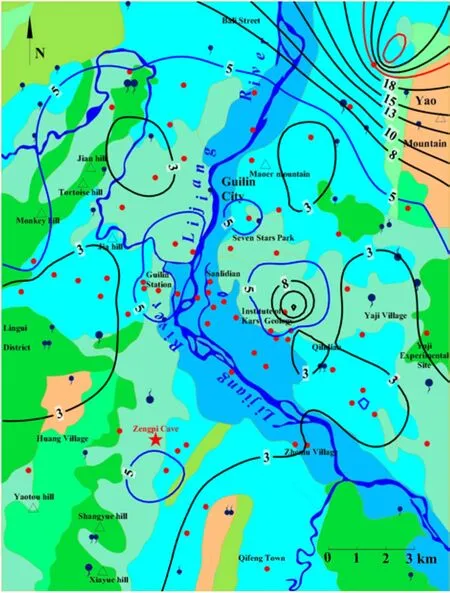
The study area covers a total area of 300 km2,with the Guilin City as its centre. Its east boundary is on the Yao Mountain and the mountain’s south extension where the Yaji experiment site lies, then its west edge shares the same border with the eastern part of Lingui region, the south end is the Qifeng Town and the north top reaches Bali Street.There are 65 groundwater observation stations for water level in the area. These monitoring sites spread in radial from the city centre extending to the whole area. The major type of groundwater in the study area is karst water, and it is stored in variable karst mediums such as caves, fissures and fractures in carbonate rock. And fissure water in the clastic rock can be seen in Yao Mountain and the Huangcun village in the southwestern part (Fig.1). The emerging stratum in this area mainly consists of the Upper Palaeozoic Devonian system and the Lower Carboniferous series. And unconsolidated layers of the Quaternary System cover in most area except for the isolated peaks in the plain and the peak cluster. And it is limestone which is totally exposed in the air in the peak-cluster area of karst mountain and in the peak forest plain being called as bare karst (HUANG Chang-jin et al. 1984). The terrain of the Guilin basin is generally higher on its all sides but lower in the centre forming an arrow basin stretching from north to south, while the karst area lies in the center of the basin and non-karst stratum all around. Karst mountains in the east and west sides of the basin take in the precipitationefficiently as the basin’s major recharge area, where groundwater flow forms and then runs into the Lijiang River through the karst aquifer under the peak forest plain in the lower central area. The main discharge area for groundwater is the Lijiang River and its tributaries in the basin (HUANG Chang-jin et al. 1984; LIU Shao-hua et al. 2015).
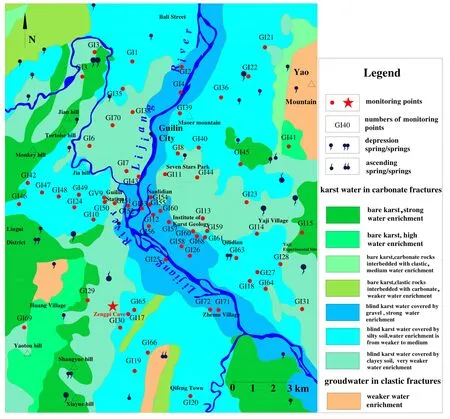
Fig.1 Map showing hydrogeology of the study area and locations of monitoring sites (modified from 1/100 000 karst hydrogeology in Guilin City drawn by the Institute of Karst Geology)
2 Analysis methods
The dynamic status of groundwater level is affected by hydrogeological conditions, which is comprehensive reflection of the groundwater hydrodynamic field, including recharge, runoff and discharge of groundwater. And it also can be considered as an important indicator of the change in the groundwater environment (CHEN Wen-fang,2010). Long-time sequence of water level dynamic data is used as one of the basic information for parameters adjustment in almost all kinds of hydrological models (Park Eungyu and Park J C,2008). Specific yield is defined as the amount of water in volume released under gravity by unit area of rock cylinder stretching from groundwater surface to the earth’s surface when groundwater level falls down at unit depth, and we usually describe it in decimals or percentages (WANG Da-chun, 1986). As Guilin is located in rich precipitation area, continuously heavy rainfall often occurs during the period from April to August. The heavy rainfall can easily result in surface runoff during this period. Large amount of rainfall may flow into the Lijiang River by its tributaries or through the urban sewage system.Continuous rainfall and the discharge manner through municipal pipe system would have a strong influence on water level’s response to precipitation, and consequently reduce the accuracy of calculation. In this paper, we only use the water level dynamic data in dry season for calculation and analysis.
Among the existing analytical methods,Aviriyanover formula is one of the most widely used formulas, which is set based on the empirical formula of groundwater evaporation (YE Shui-ting et al. 1982; LIANG Xiu-juan and XIAO Chang-lai,2000; DAI Shi-wei et al. 2012). And this formula is also the basic formula to deal with phreatic evaporation issue in groundwater numerical simulation (KOU Wen-jie et al. 2008). The formula (1) can be transformed into formula (2):
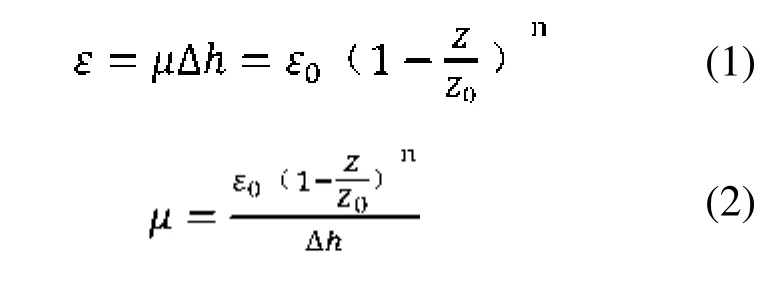
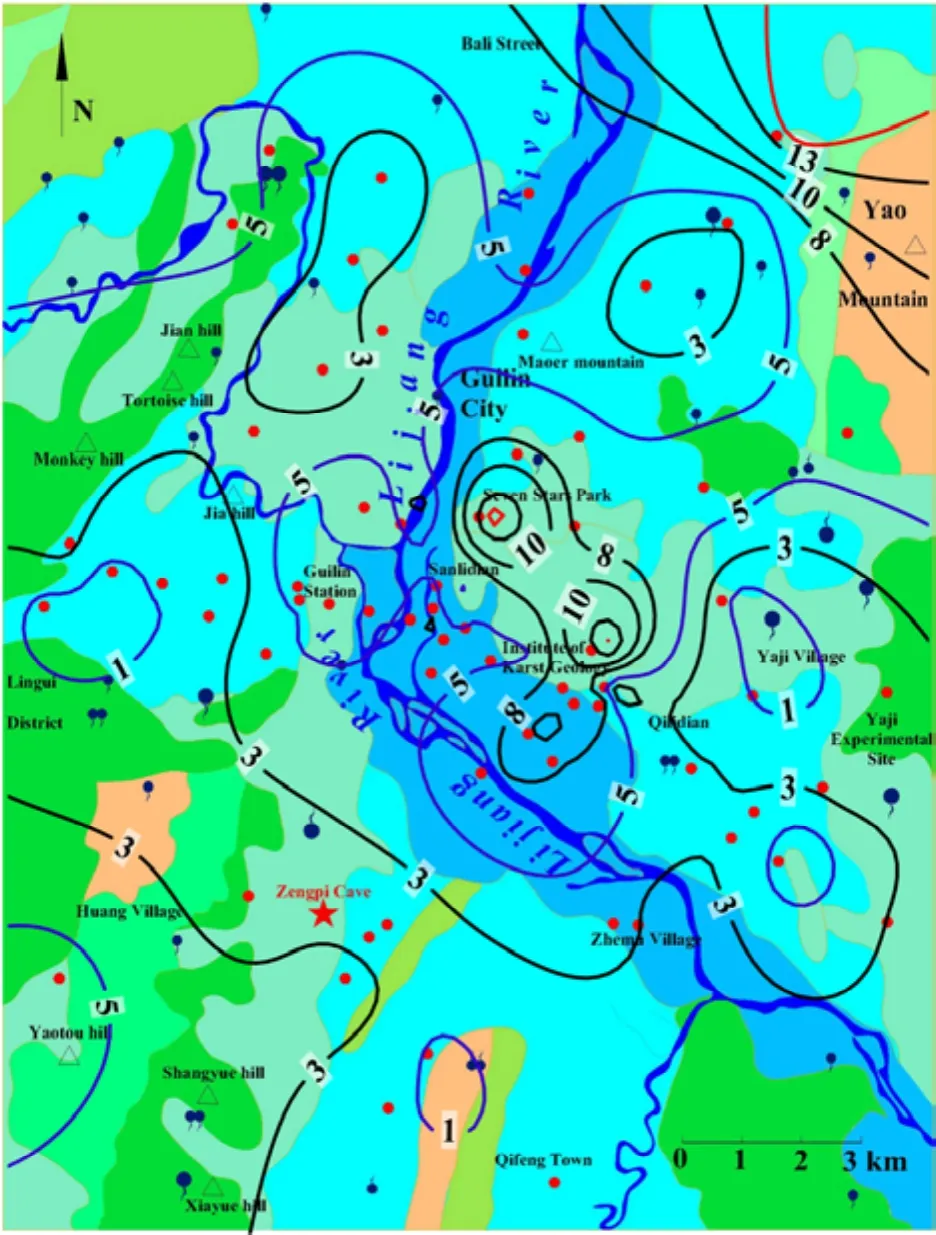
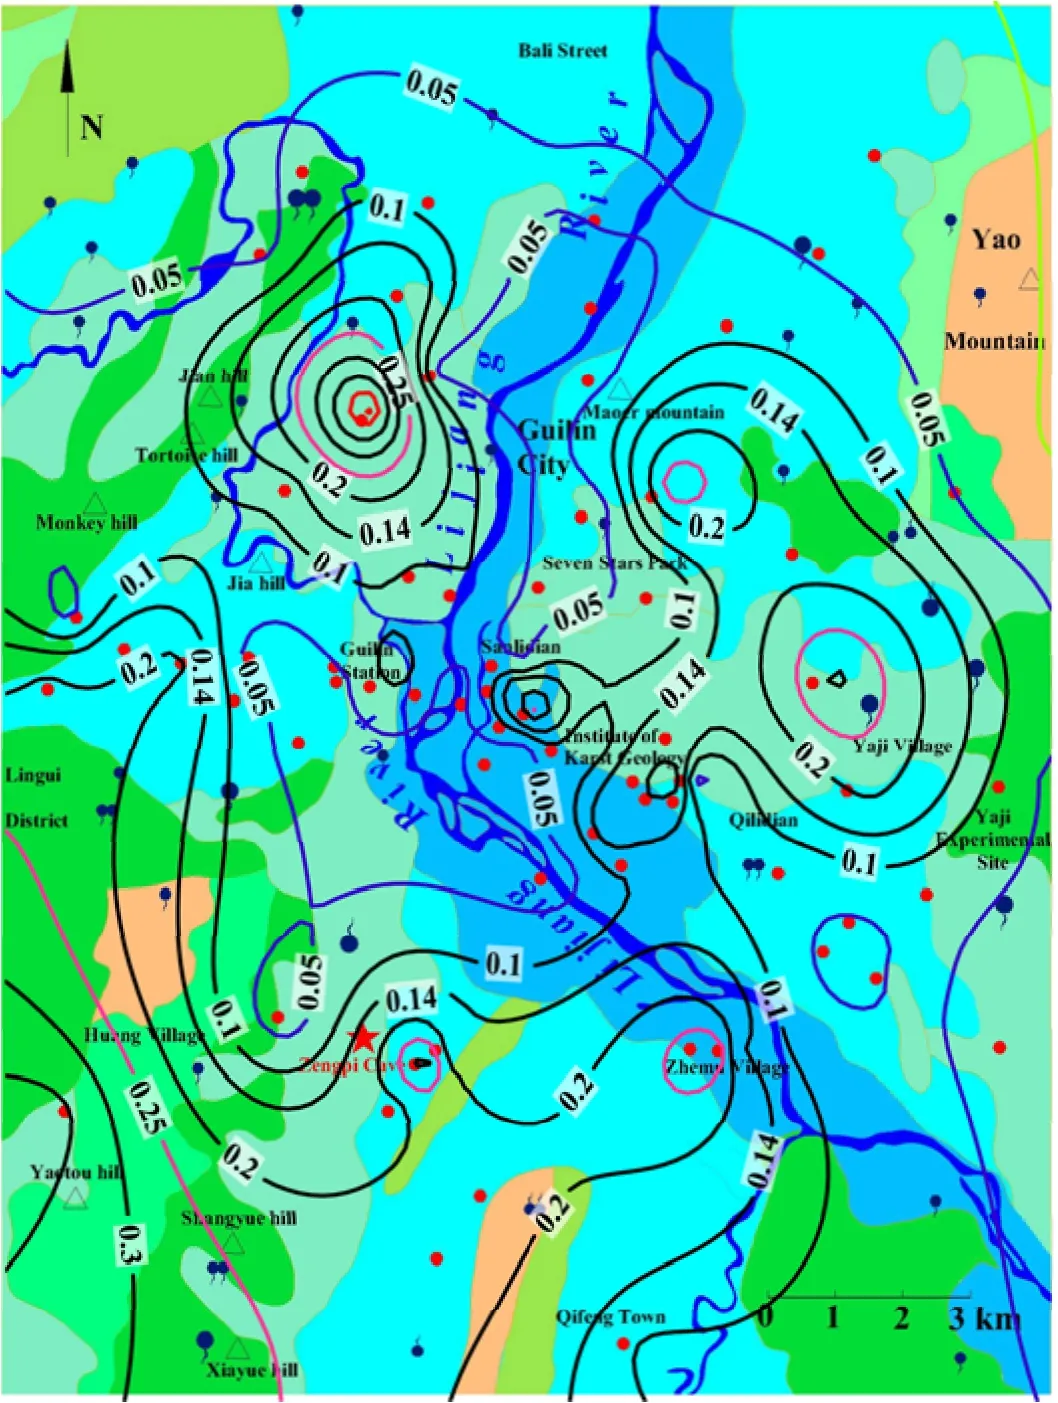
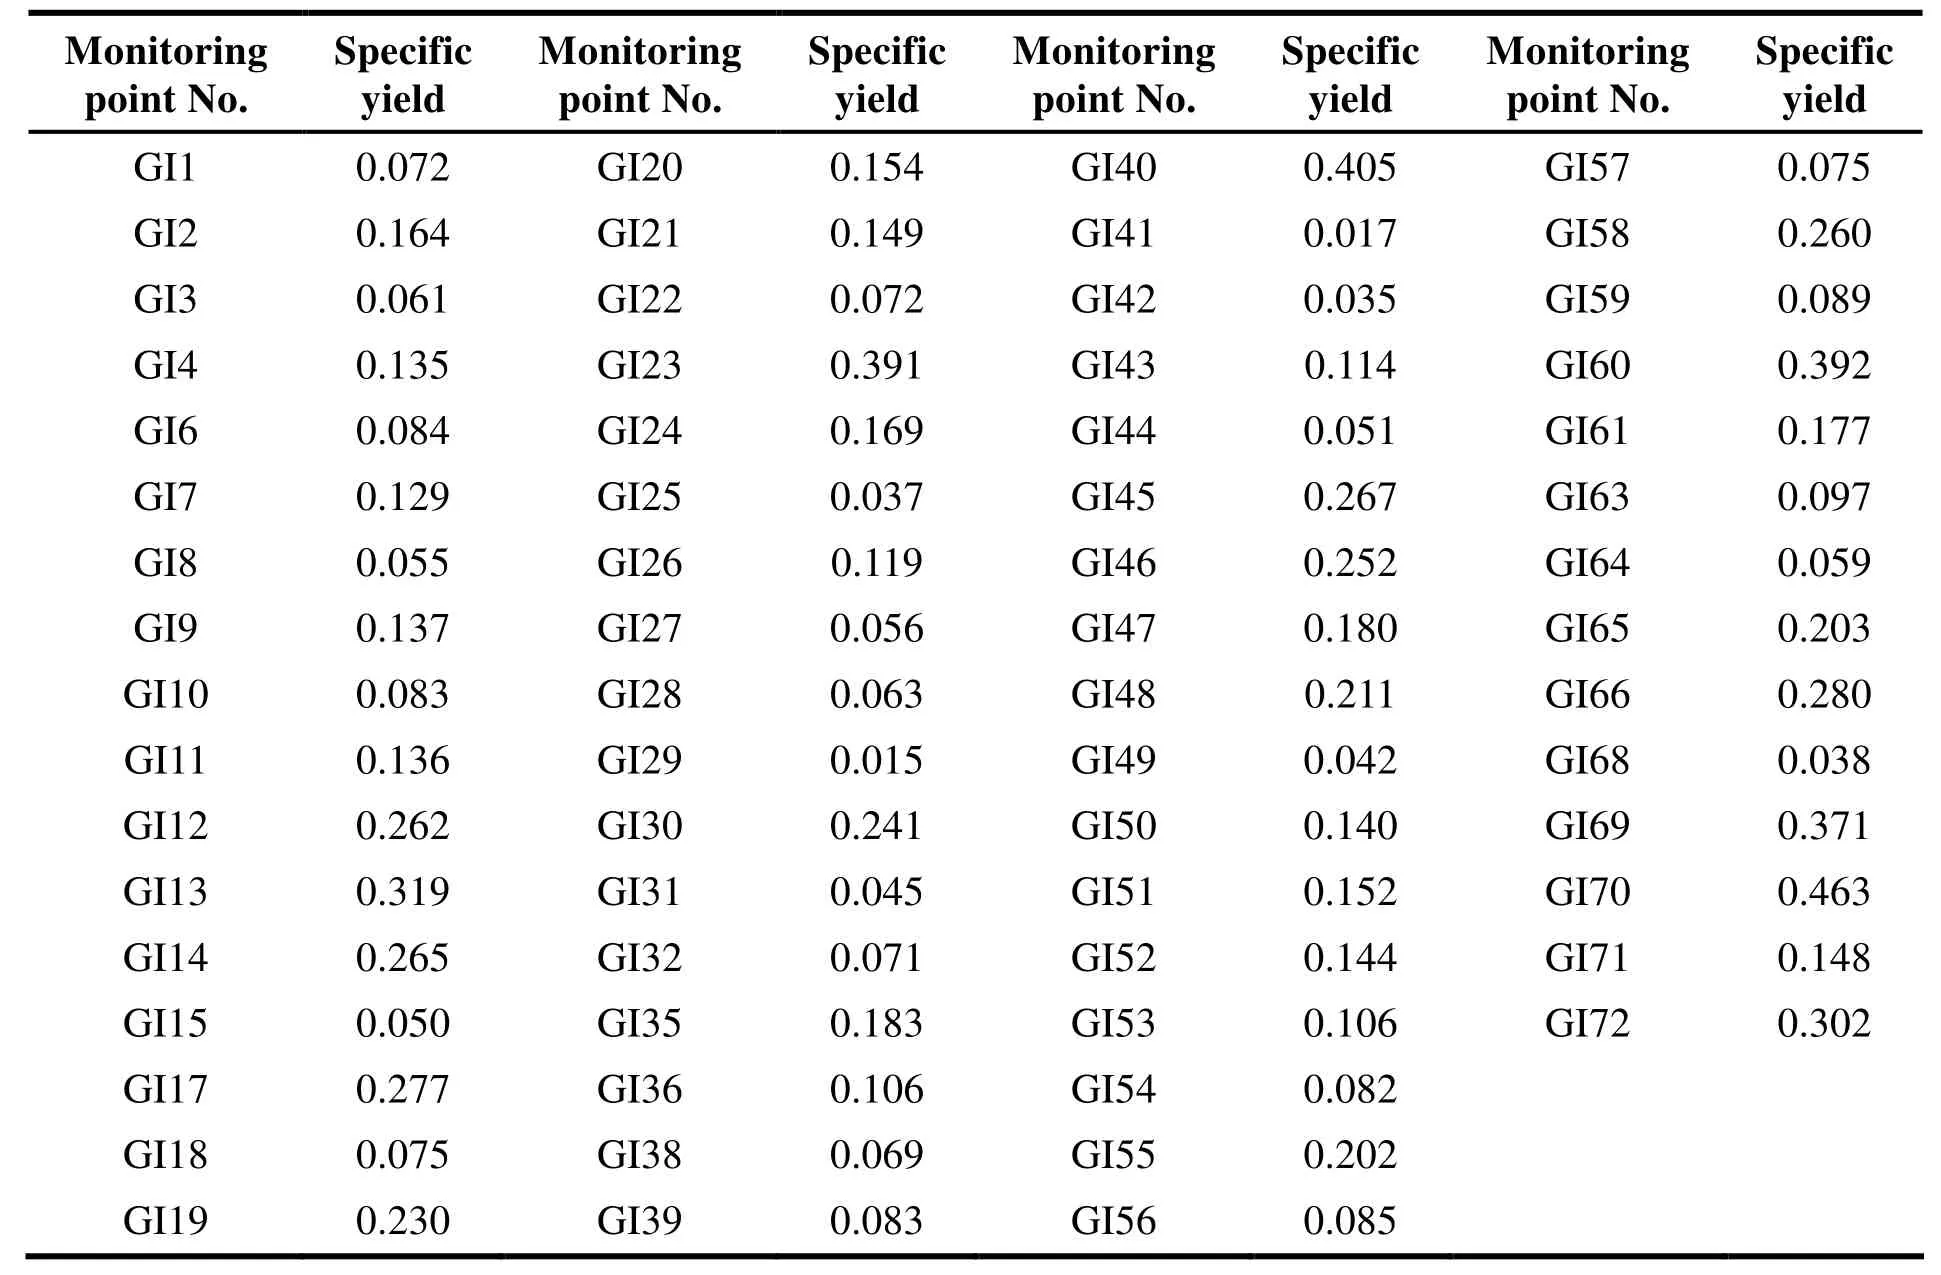
Where ε is phreatic water evaporation (m); ε0is water surface evaporation (by E601) (m); Z is buried depth of phreatic water surface (m); Z0is threshold of depth of phreatic water evaporation(m); μ is specific yield; Δh is decrease of phreatic water level (m); n is empirical constant, 1 This formula is applicable to the area where the buried depth of groundwater level is shallow and evaporation acts as the major discharge way in an aquifer (YE Shui-ting et al. 1982; LIANG Xiu-juan and XIAO Chang-lai, 2000; DAI Shi-wei et al. 2012). It is well applied in the plain area of north China. In order to receive more accurate results in area with different hydrological conditions, scholars have improved the formula according to the specific situation. Precipitation infiltration will cause the rise of groundwater level. So another way to calculate specific yield is based on the relation of the recharge from precipitation infiltration and change of water level. The coefficient of precipitation infiltration α is the ratio of groundwater recharge to the total precipitation. According to this definition of recharge coefficient, we have the flowing formula: Where qxis the amount of water in aquifer from precipitation infiltration recharge (m); Xiis precipitation per time (m); i is number of time interval; μ is specific yield; ΔH is height of water level rising caused by precipitation in unit interval(m). Once the zone of aeration reaches the state of approximate saturation due to antecedent precipitation, the subsequent rainfall can be almost considered as a complete infiltration. In another word, the coefficient of precipitation infiltration α approximates is almost equal to one. Thus we can modified formula (3) to formula (4), which is used to calculate specific yield approximately: Where C is the amount of water added to zone of aeration from precipitation recharge. The isolated peak plain is located in the southwest of Guilin City, where the Zengpiyan Cave is located, and the aquifer type is karst on carbonate-rock. The buried depth of water level,annual change amplitude of water level, hydraulic gradient are all respectively less than 2.5 m, 3 m and 0.5% (from the unpublished Investigation Report of Hydrogeology of the Zengpiyan Cave).Aimed to protect the pale anthropological site of Zengpiyan Cave, a great number of researches have been carried out, including a sound hydrogeological investigation in this area, setting up many boreholes, and groundwater monitoring in the boreholes. From the observation data of the borehole No.9 recorded at every 15 minutes during the period from February to November in 2013, it is known that there is a linear relationship between the change of water level and precipitation. And the intersection of the fitted curve on X-axis is about 10 mm in the rainfall-water level figure. It means that the fluctuation of water level for boreholes only occurs with the minimum precipitation of 10 mm. This amount of threshold can be the water absorption capacity of aeration zone. Thus for Zengpiyan Cave, formula (4) can be converted to (5): Since most area of Guilin is covered by unconsolidated layers of the Quaternary System,which is similar to Zengpiyan Cave. Whereas the zone of aeration with different buried depths varied in water capacities, formula (5) is modified as (6): Where h is buried depth of water level during the period of precipitation events (m); meaning of other letters are the same with the above mentioned formulas. More than one hydrological year was observed for the 65 monitoring points in the study area with frequency of 5 days or 3 days in 1987 and 1988 to 1990. According to these water level dynamic data,it is known that groundwater surface trend in the study area is basically in line with the terrain. So the lower water level area can be found in the central part of the plain area centered in the Lijiang River. And higher water level area lies in mountain area of the northeast and northwest. The lowest water level point was found in GI71monitoring point in the Zhemu Village with elevation of 141.95 m, and the highest value point is of 170.43 m near Yao Mountain, a non-karst mountain. For the other area, such as the Tortoise Hill and Jian Hill in the northwest of the city groundwater is also at a high level due to the impact of high altitude of hills. The Lijiang River acts as the discharge boundary of the aquifer in the study region. Groundwater flow lines are almost perpendicular to Lijiang River which means that Lijiang River can be recharged by groundwater all year round (HUANG Jing-xi et al. 1988). Fig. 2 Contour map of average groundwater buried depth from 1987 to 1990 in Guilin Based on the surface elevation of boreholes and dynamic data of water level, average groundwater buried depth and fluctuation of water level during 1987-1990 can be calculated (Fig. 2 and Fig. 3).From the calculation results, we can find that groundwater buried depth and fluctuation of water level in most of the area are both less than 5 m.Only in the region close to Yao Mountain, the groundwater buried depth and its fluctuation can be as great as 16.8 m and 23.6 m respectively. A high value of buried depth and fluctuation of water level also partly exists in the small regions of Qilidian-Sanlidian-Seven Stars Park and the neighborhood of Guilin Railway Station in the centre of Guilin City. Both of the areas lie in almost the same location where cone of depressions have taken shape owing to heavy groundwater exploitation. These areas also have higher population density. Phenomena of continuous decline of groundwater level and constant expansion of drawdown cone haven’t been found in Guilin because of factors such as abundant precipitation, extreme karst development,rich groundwater resources and sound condition of recharge and runoff. Fluctuation of water level in Qilidian is higher than other drawdown cones. Two reasons may lead to the phenomenon. One reason is the long distance between Qilidian and the Lijiang River, which makes it difficult for groundwater to be replenished by surface water timely after exploitation until wet season (HUANG Chang-jin et al. 1984). Another reason is that the aquifer is covered by clay with extremely weak water enrichment. The covering layer forms aquitard and prevents precipitation infiltrating to groundwater. Fig. 3 Contour map of fluctuation of water level from 1987 to1990 in Guilin 3.2.1 Calculation based on the Aviriyanover’s formula Data of shallow groundwater buried depth and scarce rainfall in dry season of four years were chose as the basic data for Aviriyanover’s empirical formula. Laibin City is located in the centre of Guangxi Zhuang Autonomous Region,which has similar hydrogeological and meteorological condition to Guilin. Laibin City is widely distributed with limestone of Huanglong Group. And karst joint fissure is well developed in this area (ZHOU Guo-qing et al. 2014). The threshold of phreatic evaporation depth in Laibin is 1.9 m (LAO Wen-ke and WU Kong-yun, 2008),while the paper sets it 2 m in Guilin. And the value of empirical constant is determined as n=1 (Table 1). According to water level data, Guilin City has a considerable groundwater buried depth and only 17 monitoring points with buried depth less than 2 m in study period were chosen. We can calculate specific yield within the chosen time period by formula (2), and then calculate average value for every monitoring point. The average value is 0.025-0.618 which represents a great variation, but mostly in reasonable range. Owing to Aviriyanover’s empirical formula is only applicable to areas with shallow phreatic buried depth, small hydraulic gradient and evaporationdischarge dominated, whereas, in most part of Guilin it has intense karst development, great groundwater buried depth, remarkable hydraulic slope, so the formula could not be well applied to the study area. Table 1 Statistics of specific yield of each monitoring points by using Aviriyanover’s empirical formula 3.2.2 Modified formula based on infiltration coefficient of precipitation According to 15 rainfall events data which selected based on the principle of more than 20 mm of precipitation per time and a small antecedent precipitation in dry season in 1987-1990 combining with the corresponding material of average buried depth and water level data, specific yield for every monitoring point can be calculated by formula (6). After deducting any unreasonable result above 1 and below 0, the final mean results are shown in Table 2. The calculation results range from 0.012 to 0.462. And 70.8% of the results are in the range from 0.0112 to 0.2 and only 2 results are above 0.4 (Fig. 4). Thanks to lots of research of previous studies, the specific yield in karst area vary from 0.008 to 0.1 as shown in the Hydrogeological Manual, which is 0.14 in Dikes Engineering Manual, compiled by MAO Chang-xi.The results calculated by modified formula are basically close to these empirical values. Specific yield is not only affected by the lithology such as size and number of void (LIU Ting-xi et al. 2002; LAO Wen-ke and WU Kong-yun, 2008; WANG Xu-sheng, 2009; FEI Yu-hong et al. 2010), but also by other factors like infiltration, evaporation, rate of change in water level and buried depth (Duke H R, 1972; LEI Zhi-dong et al. 1984; ZHANG Jia-fa, 1988;ZHANG Wei-zhen et al. 1988). According to the hydrogeological data of Guilin, the southwest of the study area is occupied by a large district of peak clusters and depressions. The underground karst is extremely well developed and few surface rivers exist in this region. The type of groundwater belongs to bare karst groundwater. Two reasons may lead to high value of specific yield in this region. On the one hand, extremely well developed conduit and fissure in the aquifer may result in a large amount of rainfall penetrate into groundwater via sink hole and large karst channel, then groundwater streams into the Lijiang River in the form of subsurface runoff. On the other hand,lateral recharge may exist in this region and make groundwater level more responsive to rainfall.Both reasons will increase specific yield calculation results. In addition, there is another high value region located in the city centre. The regions share similar situation to the district of drawback cones which lie in the plain region of the Guilin Basin. Groundwater type in this area is covered or semi-covered karst water. Considering that the area is covered by alluvium of the Quaternary System with various degree of permeability of overburden, well developed caves and fissures connecting with each other making for groundwater storage and movement in good condition (HUANG Chang-jin et al. 1984). One reason for the high specific yield of this area may be the connection with karst caves and fissures,since groundwater level regime is a comprehensive reflection of groundwater dynamic field and another reason is the cones of depression.Groundwater flows into drawdown cones under great hydraulic gradient, which causes water level to rise at a rapid speed. A certain degree of deflection may occur by directly utilizing the formula (6) owing to this reason. However, the specific yield is of a low value in the northwest area of the city. Most part of aquifer in this area is developed in Yanguan black shale mixed with argillaceous limestone, siltstone and siliceous rocks. The aquifer here is thin with lithology characters of poor permeability, undeveloped fissures and voids (HUANG Chang-jin et al. 1984).The Mount Yao in the southeast also has a lower value of specific yield. Clastic rock with slight,enclosed fissures and joints, very weak water enrichment and wide distributed rivers are the reasons for forming low value of specific yield.Overall, for the spatial distribution of specific yield,it is generally presented that high value in the southwest and centre of the region but low in the northwest and southeast. Fig. 4 Contour map of specific yield in Guilin Table 2 Statistics of specific yield of each monitoring point by using modified formula In order to gain more accurate results of the specific yield in the phreatic variation zone of Guilin, we analyzed 4-year long-term observation of water level data by testing different calculating methods. The results calculated with Aviriyanover’s empirical formula are 0.025-0.618.Although the results are basically reasonable, only a limited number of monitoring sites are applicable and the range is too large. Meanwhile, the results calculated by the modified formula referring to precipitation infiltration coefficient definitional formula is 0.012-0.462. These are concentrated spatial distribution and better fitting with the empirical values of previous studies. The previous study results are only empirical values which are not conducive to the analysis of the spatial distribution, the results in this paper make up the shortage to some extent. The calculation of specific yield studied in this paper is based on the hydrogeological unit system dimension and long-term observationdata. And the results from such calculation could reflect the regional differences. These conclusions could provide valuable reference for better evaluating and managing water resources in karst area like Guilin.But in the area with intermittent depression cone caused by artificial exploitation in central Guilin,specific yield values are relatively much greater,which might result from the stratum factor or formula errors. Thus further study is required. This study is supported by National Natural Science Foundation of China (No. 41172231). We sincerely appreciate the assistance of editors for the discussions and improvement of the early drafts of this manuscript. We also acknowledge the reviewers for making valuable comments on this manuscript.


3 Results and discussion
3.1 Analysis on regime of groundwater level
3.2 Calculation of specific yield by water level dynamics

4 Conclusions
Acknowledgements
杂志排行
地下水科学与工程(英文版)的其它文章
- Analysis of the negative effects of groundwater exploitation on geological environment in Asia
- Application of remote sensing technique to mapping of the map series of karst geology in China and Southeast Asia
- Compilation of Groundwater Quality Map and study of hydrogeochemical characteristics of groundwater in Asia
- Evaluation on water resources carrying capacity of Changchun-Jilin Region
- Comparison of 1,2,3-Trichloropropane reduction and oxidation by nanoscale zero-valent iron, zinc and activated persulfate
- Governance of protected areas: Kara Kara National Park, Victoria
