Planning failure-censored constant-stress partially accelerated life test
2015-11-14AliIsmailandAbdulhakimAlBabtain
Ali A.Ismailand Abdulhakim A.Al-Babtain
1.Department of Statistics and Operations Research,College of Science,King Saud University,Riyadh 11451,Saudi Arabia;
2.Department of Statistics,Faculty of Economics & Political Science,Cairo University,Giza 12613,Egypt
1.Introduction
For highly reliable materials or products,it is more difficult to acquire failure information quickly for products tested under the normal(use)condition.In order to reduce the testing period,all or some of the test units may be subjected to more severe conditions than normal ones.Such an accelerated life test(ALT)or partially accelerated life test(PALT)results in shorter life than that would be observed under normal operating conditions.In ALT,test items are run only at accelerated conditions,while in PALT they are run under both use and accelerated conditions.
The main assumption in ALT is that the model or the relationship between life and stress must be known or can be assumed to obtain estimates of lifetime at the designed stress.If such a relationship is unknown or cannot be assumed,one cannot apply the ALT approach.In this case,the PALT comes to be an alternative approach to study and analyze the reliability.
According to Nelson[1],the stress can be applied in various ways,and commonly used methods are step-stress and constant-stress.Under step-stress PALT,a test item is first run at the use condition and,if it does not fail for a specified time,then it is run at an accelerated condition until failure occurs or the observation is censored,while the constant-stress PALT runs each item at either use or accelerated condition only,i.e.each unit is run at a constantstress level until the test is terminated.Accelerated test stresses involve temperature,voltage,pressure,load,humidity etc.,which are higher than a usual level,or some combinations of them.The objective of a PALT is to collect more failure data in a limited time without necessarily using high stress in all test units.
For an overview of constant-stress PALT,there are some studies on the estimation and optimally designing of constant-stress PALT[2–7].In this paper,the problems of both estimation and optimal design of constant-stress PALT are considered under Pareto distribution of the second kind using Type-II censoring.
As indicated by Nelson[1],the constant-stress testing has several advantages.(i)It is easier to maintain a constant-stress level in most tests.(ii)Accelerated test models for constant-stress are better developed for some materials and products.(iii)Data analysis for reliability estimation is well developed.Also,as Yang[8]indicated,constant-stress accelerated life tests are widely used to save time and money.
This article is organized as follows.In Section 2 the model and the test method are described.The maximum likelihood(ML)estimators,the average confidence interval length(IL)and the associated coverage probability(CP)are obtained in Section 3.In Section 4 the statistically optimum plans for the constant-stress PALT are established.Monte Carlo simulation studies are given in Section 5 and also an example based real data set is introduced in Section 6 to illustrate the theoretical results.Section 7 is dedicated to the final clarifications and ideas for further studies.
2.Model and test method
2.1 Pareto distribution as a lifetime model
The lifetimes of the test items are assumed to follow a two-parameter Pareto distribution of the second kind.The Pareto distribution was introduced by Pareto[9]as a model for the distribution of income.In recent years,its models in several different forms have been studied by many authors[10–12].The Pareto distribution of the second kind is also known as Lomax or Pearson’s Type VI distribution[13].It has been found to provide a good model in biomedical problems,such as survival time following a heart transplant[14].Using the Pareto distribution,Dyer[15]studied the annual wage data of production line workers in a large industrial firm.Lomax[16]used this distribution in the analysis of business failure data.The length of wire between flaws also follows a Pareto distribution[14].Since the Pareto distribution has a decreasing hazard or failure rate,it has often been used to model incomes and survival times[17].
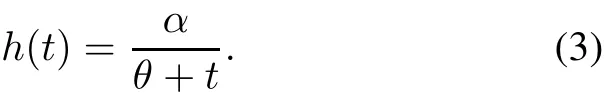
The probability density function of the Pareto distribution of the second kind,fort>0(θ,α>0),is given by

The survival function takes the form
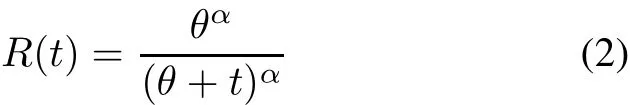
and the corresponding failure rate function is
As indicated by McCune et al.[18],the Pareto distribution has classically been used in economic studies of incomes and sizes of cities and firms,service time in queuing systems and so on.Also,it has been used in connection with reliability theory and survival analysis[10].
2.2 Constant-stress PALT
The test procedure of the constant-stress PALT and its assumptions are described as follows.
2.2.1 Test procedure
In a constant-stress PALT,the total sample sizenof the test units is divided into two parts as follows:
(i)nπitems randomly chosen amongntest items sampled are allocated to the accelerated condition and the remaining are allocated to the use condition.
(ii)Each test item is run until a censoring timey(r)and the test condition is not changed.
2.2.2 Assumptions
(i)The lifetimesTi(i=1,...,n(1−π))of items allocated to the use condition are i.i.d.random variables.
(ii)The lifetimesXj(j=1,...,nπ)of items allocated to the accelerated condition are i.i.d random variables.
(iii)Suppose that the lifetime of an item at the accelerated condition is denoted byX,then the lifetime of this item at the use conditionTis given by the relation:T=βX.
3.Estimation process
3.1 Maximum likelihood estimates
The maximum likelihood estimators(MLEs)of the parameters are considered,since they are asymptotically normally distributed and asymptotically efficient in many cases[12].Also,Bugaighis[19]indicated that the ML procedure generally yields efficient estimators.However,these estimators do not always exist in a closed form,so numerical techniques are used to compute them.
In a simple constant-stress PALT,the test item is run at either the use condition or the accelerated condition.
Since the lifetimes of the test items follow Pareto distribution of the second kind,the probability density function of an item tested at the use condition is given by as in(1).While for an item tested at the accelerated condition,the probability density function,x≥0,is given by
whereX=β−1T.
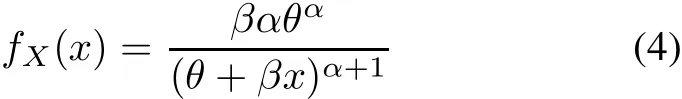
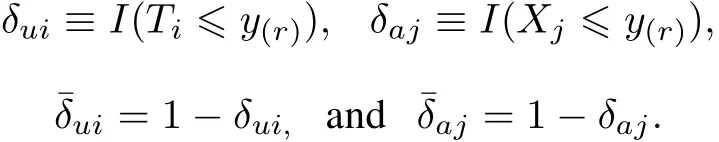
The likelihood for(ti,δui),the likelihood for(xj,δaj)and the total likelihood for(t1;δu1,...,tn(1−π);δun(1−π),x1;δa1,...,xnπ;δanπ)are respectively as follows:
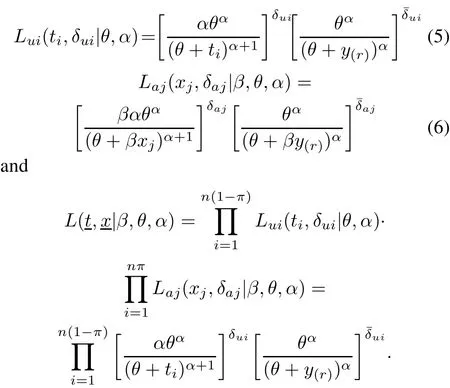
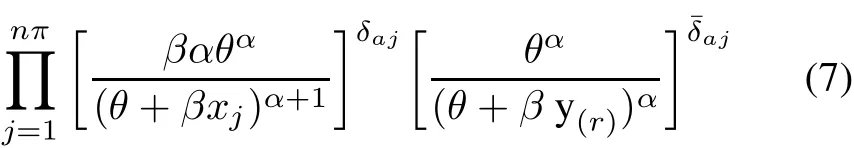
whereδuiandδajare indicator functions such that:
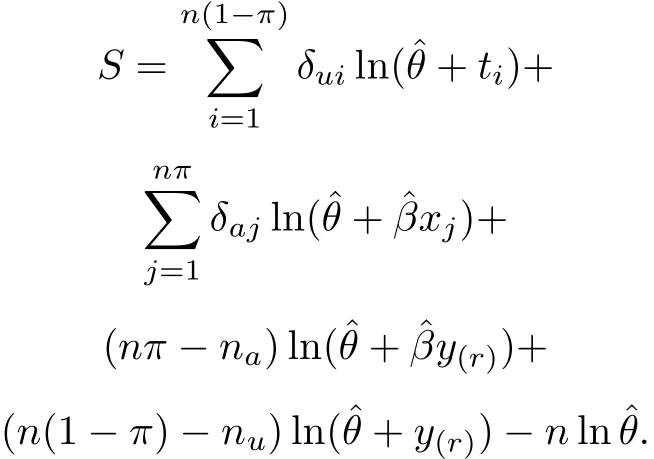
It is usually easier to maximize the natural logarithm of the likelihood function rather than the likelihood function itself.The first derivatives of the natural logarithm of the total likelihood function in(7)with respect toβ,θandαare given by
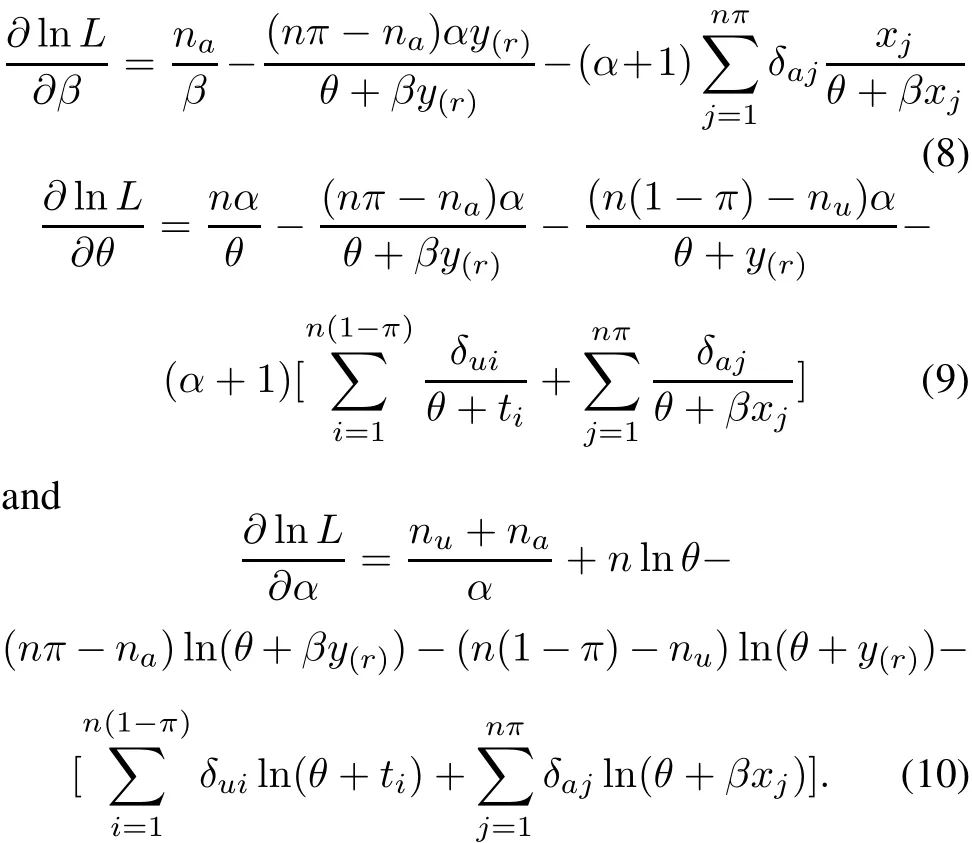
The ML estimates of the parameters are the values ofβ,θandαwhich solve the equations obtained by letting each of them be zero.So,from the last equation,the ML estimate ofαis given by
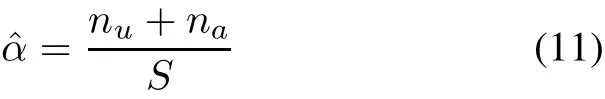
where
By substitutingαinto(8)and(9),and equating each of them to zero,the system equations are reduced into the following two non-linear equations:
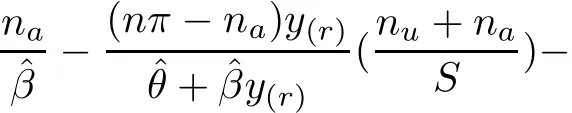
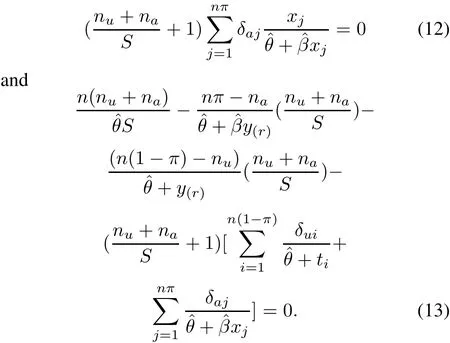
Obviously,it is very difficult to obtain a closed-form solution for the two non-linear equations(12)and(13).So,iterative procedures must be used to solve these equations numerically.The Newton-Raphson method is used to determine the ML estimates ofβandθ.Thus,once the values ofβandθare determined,an estimate ofαis easily obtained from(11).
In relation to the asymptotic variance-covariance matrix of the ML estimators of the parameters,it can be approximated by numerically inverting the Fisher-information matrixF.It is composed of the negative second derivatives of the natural logarithm of the likelihood function evaluated at the ML estimates.Therefore,the asymptotic Fisherinformation matrix estimated at(ˆβ,ˆθ,ˆα)can be written as follows:
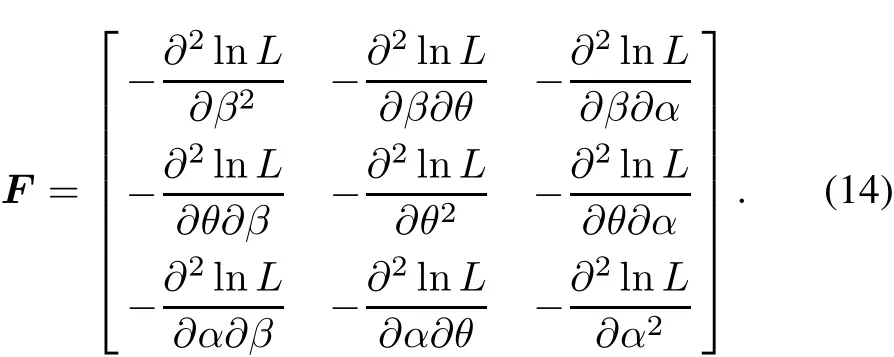
The elements of the above matrixFcan be expressed by the following equations:


Consequently,the maximum likelihood estimators ofβ,θandαhave an asymptotic variance-covariance matrix defined by inverting the Fisher information matrixFas indicated before.
3.2 Confidence intervals
As indicated by Vander Wiel and Meeker[20],the most common method to set confidence bounds for the parameters is to use the large-sample(asymptotic)normal distribution of the ML estimators.
To construct a confidence interval for a population parameterλ,assume thatLλ=Lλ(y1,...,yn)andUλ=Uλ(y1,...,yn)are functions of the sample datay1,...,yn,such that

where the interval[Lλ,Uλ]is called a two-sidedγ100%confidence interval forλ.LλandUλare the lower and upper confidence limits forλ,respectively.The random limitsLλandUλencloseλwith probabilityγ.
Asymptotically,the maximum likelihood estimators are consistent and normally distributed.Therefore,the twosided approximateγ100%confidence limits for a population parameterλcan be constructed such that
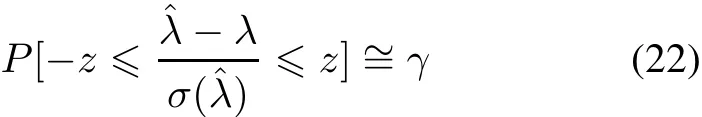
wherezis the[100(1−γ/2)]th standard normal percentile.Therefore,the two-sided approximateγ100%confidence limits forβ,θandαare given respectively as
4.Optimum test plans
In Section 3,we use the ML method which yields more efficient and more robust estimators to estimate the model parameters.These ML estimators are needed to obtain the optimum test plans.Most of the test plans are equallyspaced test stresses,i.e.the same number of test units are allocated to each stress.Such test plans are usually inefficient for estimating the mean life at the designed stress[8].In this section,the statistically optimum test plans are developed to decide the optimal sample-proportion allocated to each stress.Therefore,to determine the optimal sample-proportionπ∗allocated to the accelerated condition,πis chosen such that the generalized asymptotic variance(GAV)of the ML estimators of the model parameters is minimized.The GAV of the ML estimators of the model parameters as an optimality criterion is commonly used and defined below as the reciprocal of the determinant of the Fisher-information matrixF[21].That is,

This optimality criterion takes into account the overall parameter space.Therefore,it is a more accurate and more efficient criterion.There exist other optimality criteria which can take only into account of a subset from the parameter space.Therefore,the used optimality criterion is comprehensive and then better because it helps the experimenter to obtain more accurate estimates for all parameters of the model and hence to improve the quality of the statistical inference.
To determine the optimal value of the sample-proportion allocated to the accelerated condition which minimizes the GAV as defined before,the Newton-Raphson method is applied.Therefore,the corresponding expected optimal numbers of items failing at the use and the accelerated conditions can be obtained,respectively,as follows

where
5.Monte Carlo simulation
For illustrating the theoretical results of both estimation and optimal design problems,a numerical investigation has been made as given by the next two subsections.
5.1 ML estimation
In order to assess the performance of estimators of the model parameters,a Monte Carlo simulation study is implemented using different sample sizes.Several data sets are generated from Pareto distribution for different combinations of the true parameter values ofβ,θandαand using sample sizes 25,30,50,75 and 100 with 1 000 replications for each sample size.The true parameter values used in this simulation study are(3,6,0.6)and(5,8,1.4).The derived nonlinear logarithmic likelihood equations(13)and(14)are solved iteratively using the Newton-Raphson method.Once the values ofβandθare determined,an estimate of the shape parameterαis straightforwardly obtained from(12).For different sample sizes and true values of the parameters,the ML estimates,mean square error(MSE),average confidence IL and the associated CP are obtained with results reported in Tables 1 and 2.
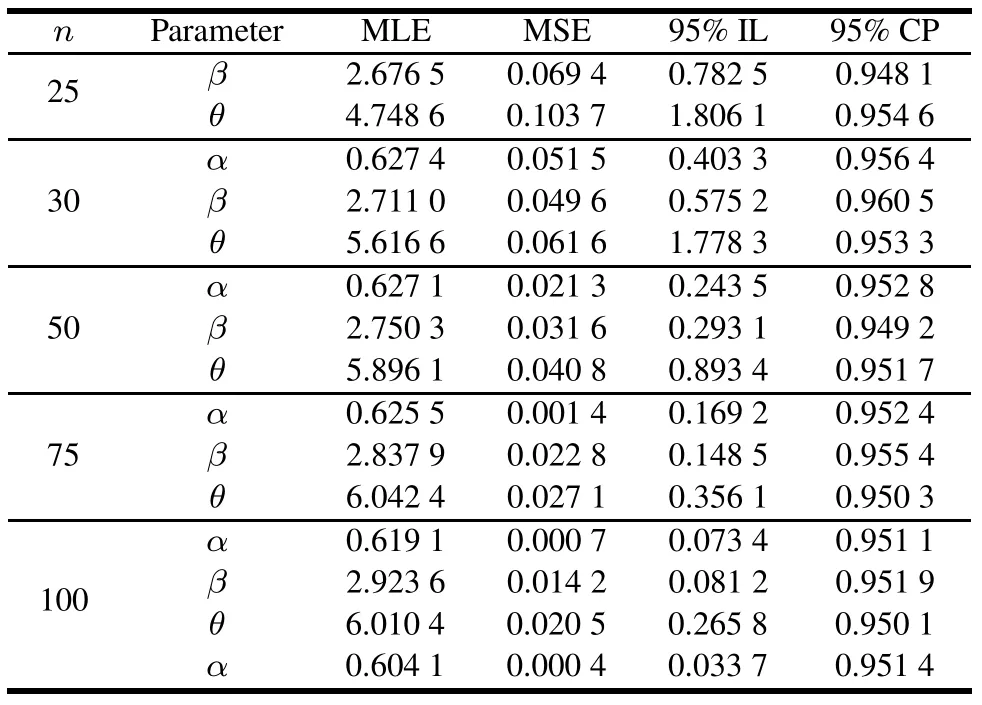
Table 1 Average values of MLE,MSE,95%IL and 95%CP of the parameters(β,θ,α)set at(3,6,0.6),respectively,givenπ = 0.50 andr=0.70n for different sized samples under Type-II censoring in constant-stress PALT

Table 2 Average values of MLE,MSE,95%IL and 95%CP of the parameters(β,θ,α)set at(5,8,1.4),respectively,givenπ =0.50 andr=0.70n for different sized samples under Type-II censoring in constant-stress PALT
Results of simulation studies offer perception into the sampling behavior of the estimators.The numerical results indicate that the ML estimates are close to the true values of the parameters as the sample sizenincreases.The equations in(24)are used to construct the approximate confidence limits for the three parametersβ,θandαbased on 95%confidence degree.It is shown from the numerical results that the IL decreases as the sample sizenincreases.Moreover,it is observed that the CP for each parameter is close to the nominal confidence level 1−α.That is,the procedure is working very well.
5.2 Optimum test plans
In this subsection,optimum test plans are obtained numerically.That is,the optimum proportion of sample units allocated to the accelerated condition is obtained such that optimal GAV of the ML estimators of the model parameters is minimized.The results of optimal design are reported in Tables 3 and 4.In these tables,the optimal sampleproportionπ∗allocated to the accelerated condition,the expected optimal numbers of items failing at use and accelerated conditions and the optimal GAV of the ML estimators of the model parameters are presented.
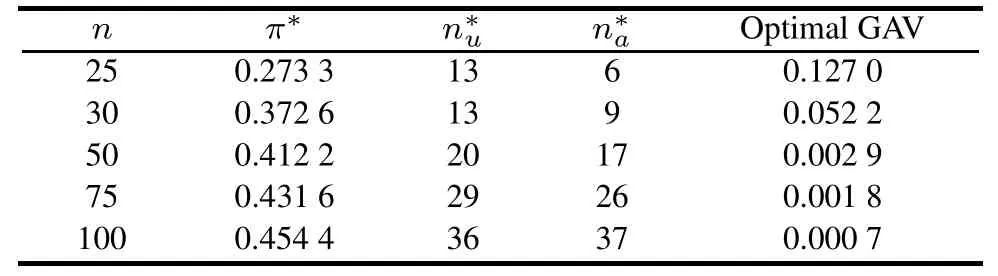
Table 3 Results of optimal design of the life test for different sized samples under Type-II censoring in constant-stress PALT based on the information included in Table 1
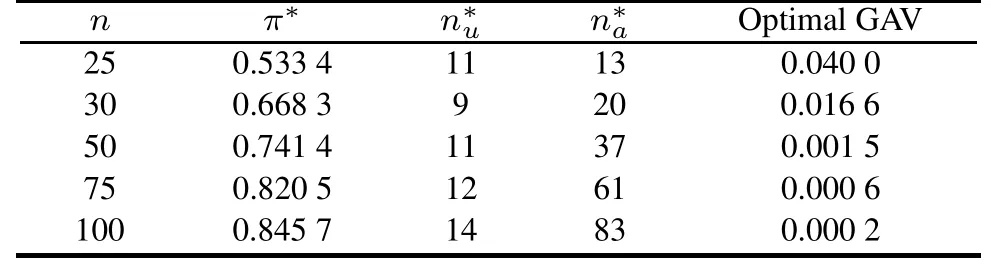
Table 4 Results of optimal design of the life test for different sized samples under Type-II censoring in constant-stress PALT based on the information included in Table 2
It can be observed,viaπ∗presented in Tables 3 and 4,that the optimum test plans do not allocate the same number of test units to each stress.In practice,the optimum test plans are important for improving precision in parameter estimation and thus improving the quality of the statistical inference.Then,these optimum test plans are more useful and more efficient for estimating the life distribution at the designed stress.Also,Tables 3 and 4 include the expected optimal numbers of items failing at use and accelerated conditions represented byn∗uandn∗a,respectively,for each sample size.The expected optimal numbers of items failing at the use and accelerated conditions are computed to study the appropriateness and effectiveness of the PALT model.As shown by the numerical results reported in Tables 3 and 4,one can observe that when the sample sizenincreases,the fraction of test units allocated to the accelerated condition also increases.Thus,the experimenter can obtain more failure-time data in a limited time.That is,the PALT model saves time and cost because it allows us to collect the failure-time data via the two stages.Finally,Tables 3 and 4 also present the optimal GAV of the ML estimators of the model parameters which is obtained numerically withπ∗in place ofπfor different sized samples.As indicated from the results,the optimal GAV decreases as the sample sizenincreases.
6.Illustrative example
In this section a numerical example using real data sets is presented to illustrate the methods of inference and optimal design developed in this paper.Nelson[22]presented some data on the time to breakdown of a type of electrical insulting fluid subject to various constant voltage stresses.The purpose of the experiment is to estimate the distribution of the time to breakdown at 20 kV.For the purpose of illustrating the methods discussed in this paper,the methods are applied to these data(n=76).Assuming Pareto distribution with Type-II censoring,we usen=76,α=2,θ=2.5,β=3 andπ=0.50.The number of failures observed at the use and accelerated conditions arenu=8 andna=49,respectively,with censored itemsnc=19.The MLEs of the model parametersα,θandβare respectively 2.05,2.56 and 3.08.The MSEs associated with the MLEs of the parametersα,θandβare 0.000 6,0.020 3 and 0.019 4,respectively.The 95%IL of the model parametersα,θandβare 0.062 5,0.335 1 and 0.126 4,respectively.The associated CP are 0.951 4,0.951 8 and 0.952 3,respectively.The optimum proportion of sample units allocated to the accelerated conditionπ∗is 0.832 1 with expected optimal numbers of items failing at the use and accelerated conditions are respectivelyn∗u=13 andn∗a=59.The associated optimal GAV of the ML estimators of the model parameters is 0.000 4.
7.Conclusions
In this paper the failure-censored constant-stress partially accelerated life test plans have been addressed assuming Pareto distribution of the second kind as a lifetime model.The maximum likelihood method has been applied to estimate the distribution parameters and the acceleration factor.The Newton-Raphson method as an iterative procedure has been used to obtain the estimates.The performance of the estimators has been assessed for different parameter values and different sample sizes.In addition,the average confidence IL and the associated CP have been obtained.It is observed that the CPs of the confidence intervals are close to the nominal confidence level 1−α.That is,the procedure is working very well.Moreover,statistically optimum constant-stress partially accelerated life test plans have been developed.That is,the optimal sampleproportionπ∗allocated to the accelerated condition has been determined to minimize the GAV of the ML estimators of the model parameters.In general,the common test plans for the constant-stress PALT are usually standard plans which use equally-spaced test stresses,each with the same number of test units.Here,the optimal design problem is to optimally determine the numbers of test units that should be allocated to each stress level to estimate the life distribution accurately.The optimum test plan provides the most accurate estimate of the model parameters for a given test time and number of test units.That is,the optimal design of the life tests can be considered as a technique to improve the quality of the statistical inference.As shown from the results,viaπ∗,the optimum test plans are not standard plans because the value ofπ∗is different from 50%whether the value of the shape parameter is less or greater than one.These results coincide with the note of Yang[8]concerning the standard plans.
[1]W.Nelson.Accelerated life testing:statistical models,data analysis and test plans.New York:Wiley,1990.
[2]D.S.Bai,S.W.Chung.Optimal design of partially accelerated life tests for the exponential distribution under Type-I censoring.IEEE Trans.on Reliability,1992,41(3):400–406.
[3]D.S.Bai,S.W.Chung,Y.R.Chun.Optimal design of partially accelerated life tests for the lognormal distribution under Type-I censoring.Reliability Engineering and System Safety,1993,40(1):85–92.
[4]A.A.Ismail.The test design and parameter estimation of Pareto lifetime distribution under partially accelerated life tests.Giza,Egypt:Cairo University,2004.
[5]A.A.Ismail,A.A.Abdel-Ghaly,E.El-Khodary.Optimum constant-stress life test plans for Pareto distribution under Type-I censoring.Journal of Statistical Computation and Simulation,2011,81(12):1835–1845.
[6]A.A.Ismail.On designing constant-stress partially accelerated life tests under time-censoring.Strength of Materials,2014,46(1):132–139.
[7]A.A.Ismail.Estimating the generalized exponential distribution parameters and the acceleration factor under constantstress partially accelerated life testing with Type-II censoring.Strength of Materials,2013,45(6):693–702.
[8]G.B.Yang.Optimum constant-stress accelerated life-test plans.IEEE Trans.on Reliability,1994,43(4):575–581.
[9]V.Pareto.Cours d’Economie politique.Paris:Rouge et Cie,1897.
[10]H.T.Davis,M.L.Feldstein.The generalized Pareto law as a model for progressively censored survival data.Biometrika,1979,66(2):299–306.
[11]A.C.Cohen,B.J.Whitten.Parameter estimation in reliability and life span models.New York:Marcel Dekker,Inc.,1988.
[12]S.W.Grimshaw.Computing maximum likelihood estimates for the generalized pareto distribution.Technometrics,1993,35(2):185–191.
[13]N.L.Johnson,S.Kotz,Continuous univariate distributions.2nd ed.New York:Wiley-Interscience Publication,1994.
[14]L.J.Bain,M.Engelhardt.Introduction to probability and mathematical statistics.2nd ed.Boston,Mossachusett:PWSKENT Publishing Company,1992.
[15]D.Dyer.The structural probability for the strong Pareto law.Candian Journal of Statistics,1981,9(1):71–77.
[16]K.S.Lomax.Business failures:another example of the analysis of failure data.Journal of American Statistical Association,1954,49(268):847–852.
[17]H.A.Howlader,A.M.Hossain.Bayesian survival estimation of Pareto distribution of the second kind based on failurecensored data.Computational Statistics and Data Analysis,2002,38(3):301–314.
[18]E.D.McCune,S.L.McCune.Estimation of the Pareto shape parameter.Communication in Statistics-Simulation and Computation,2000,29(4):1317–1324.
[19]M.M.Bugaighis.A note on convergence problems in numerical techniques for accelerated life testing analysis.IEEE Trans.on Reliability,1988,37(3):348–349.
[20]S.A.Vander Wiel,W.Q.Meeker.Accuracy of approximate confidence bounds using censored Weibull regression data from accelerated life tests.IEEE Trans.on Reliability,1990,39(3):346–351.
[21]D.S.Bai,J.G.Kim,Y.R.Chun.Design of failure-censored accelerated life-test sampling plans for lognormal and Weibull distributions.Engineering Optimality,1993,21(2):197–212.
[22]W.Nelson.Analysis of accelerated life test data-least squares methods for the inverse power law model.IEEE Trans.on Reliability,1975,24(2):103–107.
杂志排行

Journal of Systems Engineering and Electronics的其它文章
- Optimizing reliability,maintainability and testability parameters of equipment based on GSPN
- Ensemble feature selection integrating elitist roles and quantum game model
- Quintic spline smooth semi-supervised support vector classication machine
- New family of piecewise smooth support vector machine
- Articial bee colony algorithm with comprehensive search mechanism for numerical optimization
- Priority probability deceleration deadline-aware TCP