On Spatial Distribution Pattern of Broccoli Clubroot Disease and and the Sampling Technique
2015-11-08LiequanZHONGHuifuWANGShanhongYU
Liequan ZHONG,Huifu WANG,Shanhong YU
1.Plant Protection and Quarantine Station of Taizhou City,Jiaojiang 318000,China;
2.Taizhou Academy of Agricultural Sciences,Linhai 317000,China
On Spatial Distribution Pattern of Broccoli Clubroot Disease and and the Sampling Technique
Liequan ZHONG1,Huifu WANG2*,Shanhong YU2
1.Plant Protection and Quarantine Station of Taizhou City,Jiaojiang 318000,China;
2.Taizhou Academy of Agricultural Sciences,Linhai 317000,China
[Objective]To further improve the prediction and forecast and continuous control ability of broccoli clubroot disease. [Methods]The spatial distribution pattern of diseased or infected plants was analyzed using the least square method,frequency distribution,aggregation index,m*-m regression analysis and Taylor’s power law model.[Result]The field distribution of broccoli plants with clubroot disease tended to be aggregated distribution.m*-m regression analysis showed that the elementary composition of the spatial distribution of diseased or infected plants was individual colony,the individuals attracted each other;the disease had obvious disease focus in the field,and the individual colony showed uniform distribution pattern in the field.Taylor’s power law showed that the spatial pattern of individual diseased or infected plant with clubroot disease tended to be uniform distribution with the increase of the density.On the basis of this,Iwao optimal theoretical sampling model and sequential sampling model were established,namely N=273.954 1/m-59.698 5,respectively,it meant that when surveying N plants,if the accumulative incidence rate exceeded upper bound,the field can be set as control object;if the accumulative incidence rate didn’t reach lower bound,it can be set as uncontrol field;if the accumulative incidence rate was between upper bound and lower bound,it should be surveyed continuously until the maximum sample size (m0=0.368 4)appeared,that was,the disease incidence was 15%,so the sampling number should be 684 plants. [Conclusion]The research results had very important instructive meaning for disease control.
Broccoli clubroot disease;Spatial distribution pattern;The optimal theoretical sampling model;Sequential sampling model;Sampling number
B roccoli(Brassica oleracea L. vat.italica Planch)belongs to family Cruciferae,genus Brassica and species cabbage,it is a variation with violet or green ball-flower.In the late 19thand early 20thcenturies,it spread into China;in 1989,broccoli was planted in a large area in Taizhou City.Now,Zhejiang Province has already become the largest export production base of broccoli nationwide.In recent years,with the further adjustment and optimization of plant industry structure,broccoli planting continues to expand rapidly in our city,and the area has already reached more than 1×10⁴hm2.The clubroot of broccoli is the swelling of parenchymatous tissue of taproot or lateral root infected by Plasmodiophora brassicae Woron which belongs to genus Brassica and fungus Mastigomycotina,which will cause the growth retardation,dwarf and wilting ofoverground partof plants.Based on the investigation on main planting regions of broccoli in Taizhou City,it was found that the morbidity rate of broccoli clubroot disease was generally among 0-5%,and the serious infected field reached more than 60%,at the same time,the initial symptoms of root disease were covert,so once the symptoms occurred on the overground part,thedisease would spread and expand quickly within a week,moreover,conventional medicaments were difficult to control and prevent,the growers were helpless and suffered great losses[1-4].
Generally,the determination on leading factors,infestation regularity and control indexes of diseases has been based on sampling survey,and spatialdistribution information has been the basis of sampling design,it not only helps to determine or perfect sampling design scheme,but also can put forward appropriate statistical treatment method for research data,thus it has very important instructive meaning for disease control[5-6].To reveal and clear the spatial distribution information and growth and decline trends of broccoli clubroot disease,improve the prediction and forecast accuracy and continuous control ability,improve the commodity benefiting the export of broccoli,and further promote the healthy development of broccoli industry,the follow-up survey on broccoli clubroot disease was conducted during 2013-2014,and a preliminary study on the spatial distribution pattern of broccoli clubroot disease and the sampling technique was carried out.
Materials and Methods
lntroduction of the experiment
The experiment was carried out at the broccoli planting region of Putou Village in Ruoheng Town of Wenling City in Zhejiang Province,the experimental variety was Lvxiong 90,the sowing date was on August 21 in 2013 and the planting date was on September 23,the planting spacing was 40 cm×68 cm,the planting density was about 36 000 plants/hm2.The management measures of farm operation were according to local conventional methods.
lnvestigation method
6 fields with different grades of clubroot disease were randomly selected for surveying during the stable phase of broccoli clubroot disease(on January 14 in 2014),the area of each field was about 1 000 m2,then taking one field as one sample plot and one plant as one sample,150 plants in the middle field of each sample plot were selected for continuously surveying,that was,150 plants in the straight line were continuously sampled,the disease degrees of broccoli clubroot disease were recorded,the grading standard was seen in Table 1,and the morbidity rate and disease index of every sample plot were summarized[7-9].
Data processing and analytical method
The compatibility test of frequency distribution,the determination of aggregation index and regression analysis method The data from field investigation were set as one group according to each sample plot,then the spatial distribution frequency table of diseased plants was made. The aggregation index method was adopted to calculate the mean of disease grade(m),variance(S2),mean crowding degree(M*),Beall diffusion coefficient (C),David and Moore clumping index(I),Water’s negative binomialdistribution parameter(K),Kuno index(CA),Lioyd patchiness index(M*/m)and regression model Iwao(M*-m regression analysis)and Taylor’s power law,the spatial distribution pattern of broccoli clubroot disease was analyzed[10].
The buildup of the optimal theoretical sampling model and sequential sampling analysis model According to the sampling principle proposed by Iwao in 1977,the formula was N= t2/D2[(α+1)/m+(β-1)](in the formula,N was the optimal sampling plots,m was the mean of disease grades,t was the critical value of distribution,α and β were M*-m regression parameter,D was permissible error),the optimal theoretical sampling model of broccoli clubroot disease under different morbidity rates was established.According to new sequential sampling theory proposed by Iwao,its general formula was T0(N)=m0N±t{N[(α+1)m0+(β-1)m02]}1/2(in the formula,α and β were M*-m regression parameters,m0was control index,t was the critical value of distribution,N was the sampling number),the sequentialsampling analysis model and sequential sampling identification key of broccoli clubroot disease were established[11].
Results and Analyses
The index of broccoli clubroot disease in different fields
The morbidity of broccoli clubroot disease in different fields was shown in Table 2.As shown in Table 2,there were significant differences on the morbidity of broccoli clubroot disease in different fields,the morbidity range was among 36.7%-67.3%,in which the most serious field was No.3 field(the disease index was 40.00),the least severe field was No.6 field(the disease index was 18.67),the disease indexes of other fields were among 25.60-36.13.The least square method was used to establish the regression equation between mean value of disease grades of broccoli clubroot(m)and morbidity(x),namely,m= 3.088 3x-0.094 8,correlation coefficient r=0.900 9,p=0.014 3,the correlativity was significant[12].
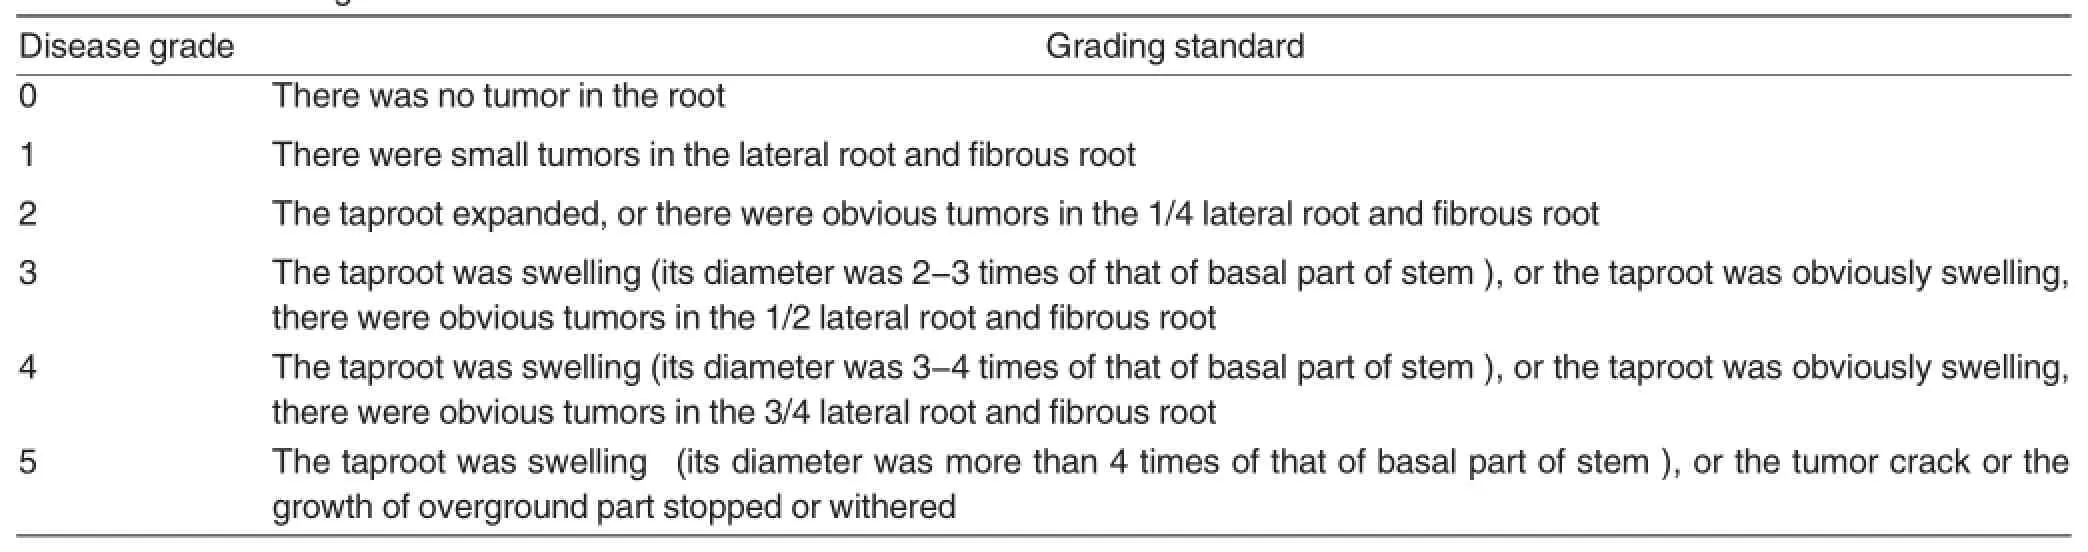
Table 1 The disease grade of broccoli clubroot disease
The compatibility test of frequency distribution
Theexperimentalresultswereshown in Table 3,it was shown that there were differences on the distribution of diseased plants in different fields,such as No.5 field suited Poisson-binomial distribution,No.6 field suited compound Poisson distribution(the difference was not significant),the other surveyed fields were all very unfit for binomial distribution,Poisson distribution,Neyman distribution,compound Poisson distribution,negative binomial distribution and Poisson-binomial distribution (the differences were extremely significant).
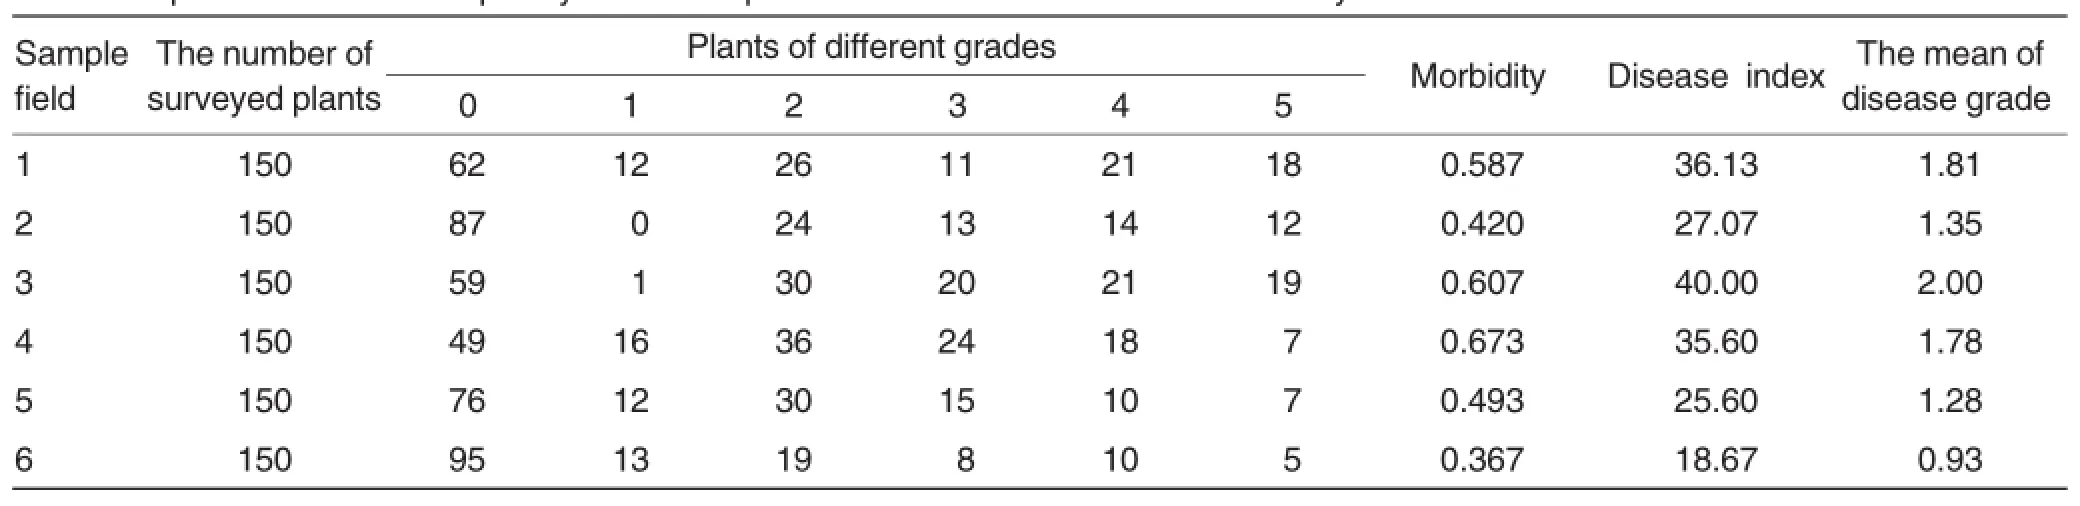
Table 2 Spatial distribution frequency of broccoli plants with clubroot disease in the surveyed fields
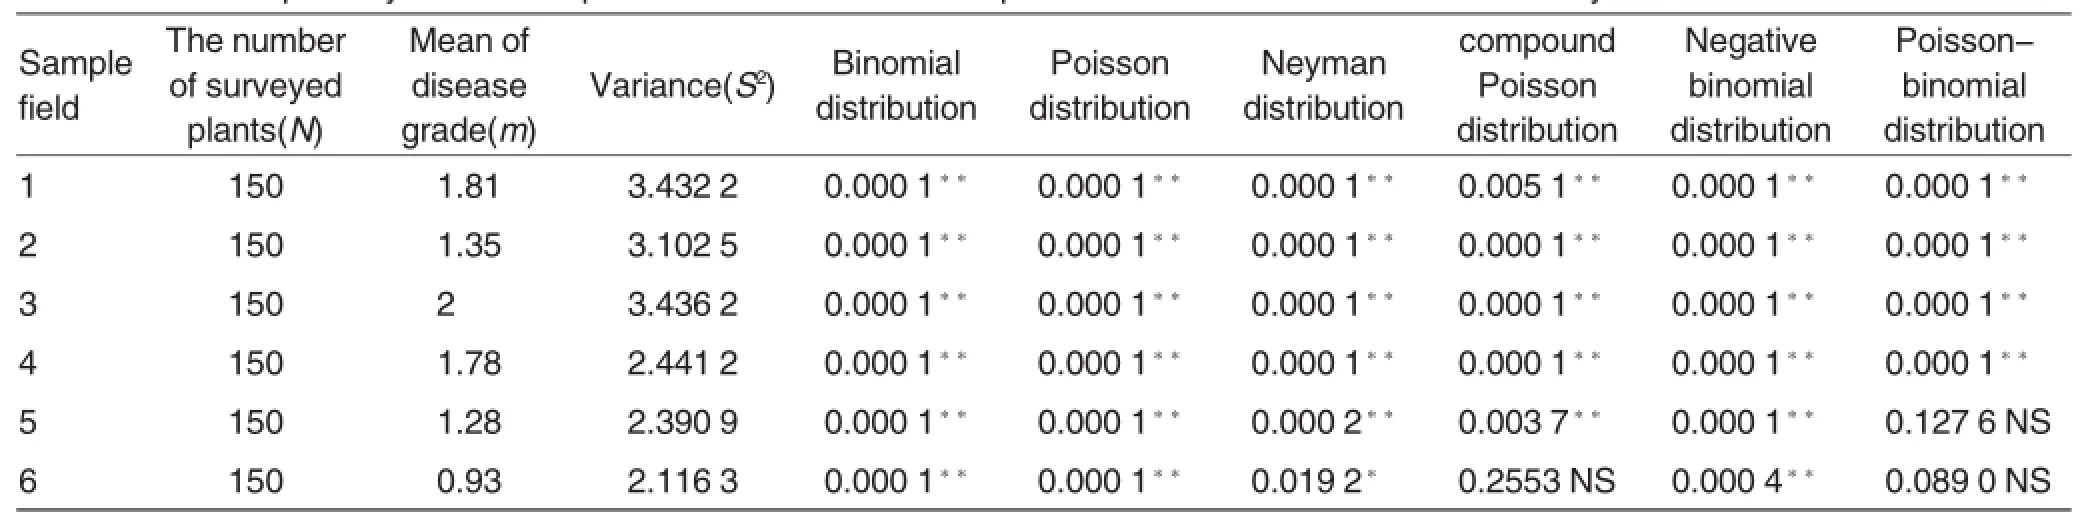
Table 3 The compatibility test of the spatial distribution of broccoli plants with clubroot disease in the surveyed fields

Table 4 The aggregation index of the spatial distribution of broccoli plants with clubroot disease in the surveyed fields
The determination of aggregation index
The experimentalresultswere shown in Table 4,it was shown that the average crowding degree(M*)of diseased plants in the surveyed field was among 2.147 9-2.706 2,showing that the change of average degree of crowdedness of diseased plants in different fields was not obvious.The I index of diseased plants in all fields was larger than 0,M*/M index was larger than 1,CA index was larger than 0,diffusion coefficient C was larger than 1,K index was larger than 0,therefore,the field distribution of broccoli plants with clubroot disease was aggregated distribution.
Regression analysis method
m*-m regression analysis The least square method was used to work out the parametersα andβfrom the equation of m*=α+βm,then the regression equation was obtained:m*= 1.852 5+0.378 4m.=1.852 5>0 showed that the elementary composition of the spatial distribution of broccoli plants with clubroot disease was individual colony,and the individuals attracted each other;β=0.378 4<1 indicated that the individual colony showed uniform distribution pattern in the field.
Taylor’s power law Using Taylor’s power law lg(S2)=a+blg(m)[13](1965),combining with the variance(S2)and mean of disease grade(m)of 6 data in Table 3,the equation was obtained: lg(S2)=0.351 6+0.537 6lg(m).The aggregation index b=0.537 6<1 indicated that the spatial pattern of broccoli individuals with clubroot disease tended to be uniform distribution with the improvement of the density of diseased plants.
The optimal theoretical sampling model
According to Iwao optimal theoretical sampling model,using probability guarantee value t=1.96,permissible error D=0.2,α=1.852 5,β= 0.378 4,the model was obtained:N= 273.954 1/m-59.698 5.The optimal sampling number under different morbidity rates of broccoli plants with clubroot disease was calculated(Fig.1). When the morbidity was 5%(the mean of disease grade was 0.06 and the disease index was 1.19),the samplingnumber was 4 507 plants;when the morbidity was 25% (the mean of disease grade was 0.68 and the disease index was 13.55),the sampling number was 344 plants;when the morbidity was 50% (the mean of disease grade was 1.45 and the disease index was 28.99),the sampling number was 130 plants.With the increase of the morbidity ofbroccoliclubroot,the sampling number showed decrease trend progressively.
Sequential sampling model
Sequential sampling is to determine the appropriate sampling number orwhether the controlindex is achieved based on the field investigation situation and using the obtained sample information within a certain fiducial range.Now,according to the morbidity of local broccoli clubroot disease,itwasobtained thatthe morbidity of the control index was 15%,the mean of disease grade(m0)was 0.368 4;t=1.96,α=1.852 5,β= 0.378 4 were substituted into the sequential sampling formula T0(N)= 0.368 4N±1.926 8.According to the above equation,the retrieval table for the sequential sampling of broccoli clubroot disease was obtained(Table 5).From Table 4,it can be seen that when surveying N plants,if the accumulative incidence rate exceeded upper bound,the field can be set as control object;if the accumulative incidence rate didn’t reach lower bound,it can be set as uncontrol field;if the accumulative incidence rate was between upper bound and lower bound,it should be surveyed continuously until the maximum sample size (m0= 0.368 4)appeared,that was,the disease incidence was 15%,so the sampling number should be 684 plants.
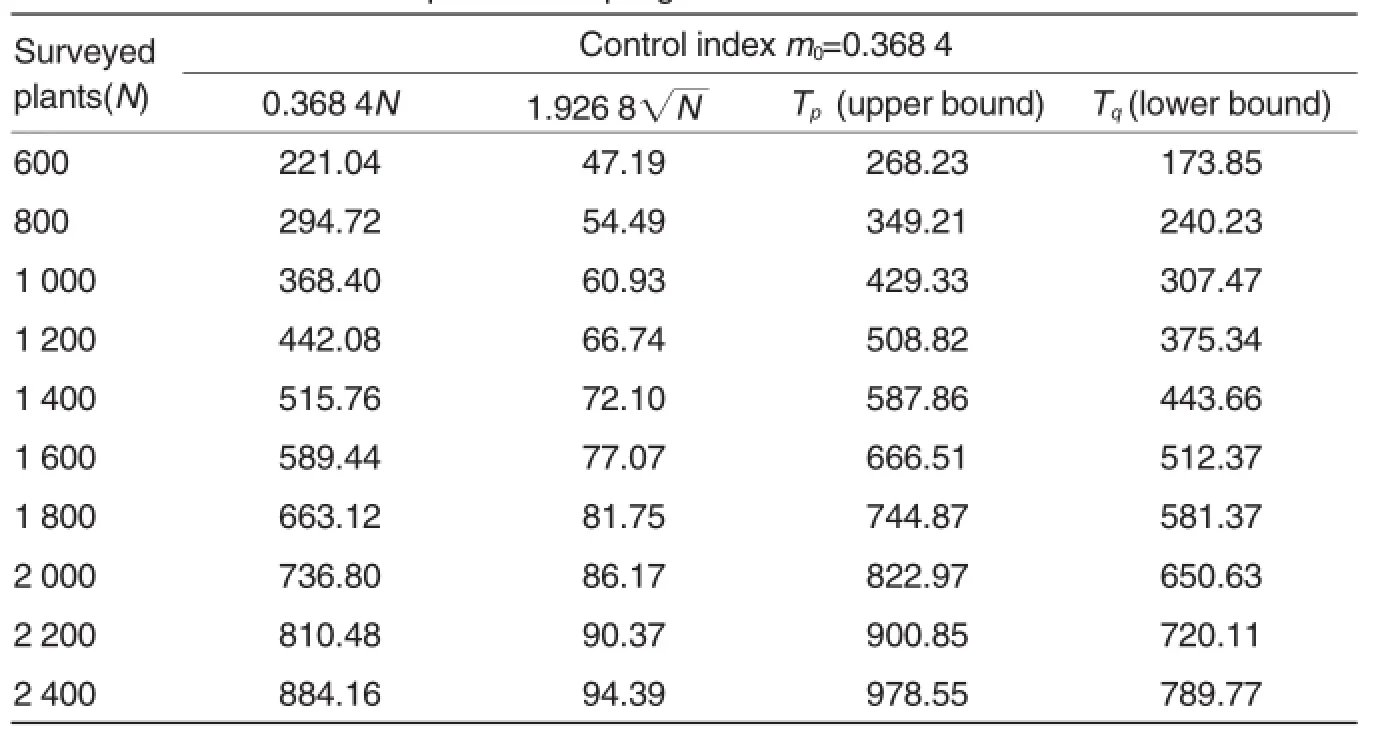
Table 5 The retrieval for sequential sampling of broccoli clubroot disease
Conclusions and Discussions
Based on the determination of frequency distribution and aggregation index,the results showed that the field distribution of broccoli plants with clubroot disease tended to be aggregated distribution.m*-m regression analysis showed that the elementary composition of the spatial distribution of diseased or infected plants was individual colony,the individuals attracted each other;diseased or infected plants had obvious disease focus in the field,the reasons of the pattern were not only the result of the diffusion of diseased or infected plants,but also the result of the restriction of environmental conditions;the individual colony showed uniform distribution pattern in the field,the individual distribution was identical to the core distribution of the individual colony.Taylor’s power law showed that the spatial pattern of individual diseased or infected plant with clubroot disease tended to be uniform distribution with the increase of the density.The main reasons were:m*-m regression analysis focused on the spatial formulation of disease focus distribution of diseased plants(individual colony),the diseased individual inside the disease focus showed aggregated distribution at the low density and showed uniform distribution at the high density,the disease focus,as an individual colony,showed uniform distribution;Taylor’s power law focused on the spatial behavior of diseased individual distribution,when the density was low,the diseased individual showed aggregated distribution,when the the density was high,the diseased individual showed uniform distribution.Therefore,two analytical methods under different densities showed spatial characteristics,when the density reached a certain height,the analysis results tended to be homogeneous[14-15].
The spatial dynamics of plant diseases is determined by the hereditary character of species and ecological environmental conditions,and formed by the diffusion of pathogens and copulas in the space.For fungous disease,the effects of pathogen population quantity,spatial distribution,diffusion characteristics and environmental factors on its ecological behavior and population dynamic process greatly affect the occurrence of disease and prevalence,moreover,the difficulty of sampling is great,and the quadrat size has significant effect on statistic analysis results[16-18].In this study,to study the sampling technique,broccoli individual was taken as the sample,the Iwao optimaltheoreticalsampling model N=t2/D2[(α+1)/m+(β-1)]was adopted,so as to work out the optimum sampling number under different morbidity rates and establish sequential sampling model T0(N)=0.368 4N±Therefore,after the preliminary estimation of disease grade of surveyed plots,based on the optimal theoretical sampling model,the sampling number under different accuracy requirements was determined,so as to provide some guidance for the classification and prevention ofbroccoli growers.Besides,the spatial dynamics of disease epidemic not only included the field distribution pattern of diseased plants,but also contained theanalysis of propagation distance and propagation velocity;to deepen the understanding on epidemic rules of disease,further studied was needed.
[1]QU WD(屈为栋),HE DG(何道根),SU YJ(苏英京).Present situation,problem and developing strategy of broccoli industryin Taizhou City ofZhejiang Province(台州市西兰花产业现状、存在问题及发展对策)[J].Journal of Zhejiang Agricultural Sciences(浙江农业科学),2009(6):1062-1065.
[2]ZHENG YL(郑永利),QI HB(戚红炳),LU JF(陆剑飞).The coloured atlas of watermelon and melon diseases and pests(西瓜与甜瓜病虫原色图谱)[M]. Hangzhou: Zhejiang Science and Technology Press(杭州:浙江科学技术出版社),2005:43-45.
[3]SUN QL(孙泉良),CHEN JR(陈建仁),YE CW (叶传伟).Discussion on the fuzzy prediction method of Sclerotinia(油菜菌核病FUZZY预测法的商榷)[J]. Plant Protection(植物保护),2010,36(3):134-135.
[4]WANG HF(王会福),ZHONG LQ(钟列权),YU SH(余山红),et al.The recognition and prevention of Physoderma corchori Lingappa,clubroot and root knot nematode of broccoli(青花菜茎瘤病根肿病和根结线虫病的识别与防治)[J]. Jiangsu Agricultural Sciences (江苏农业科学),2013,41(9):127-129.
[5]DING YH(丁云花),JIAN YC(简元才). Physiologicalraces and inoculating methods of Cruciferous Clubroot Plasmodiphora brassicae(十字花科蔬菜根肿病菌生理小种及接种方法)[J].China Vegetables(中国蔬菜),2005(8):29-31.
[6]WANG EG(汪恩国),CHEN KS(陈克松),LI DL(李达林).Studies on population distribution pattern and sampling technique of Prodenia litura in the broccolifield(斜纹夜蛾在青花菜上种群分布型及抽样技术研究)[J].Acta Agriculturae Zhejiangensis(浙江农业学报),2005,17(1):15-18.
[7]YU SH(余山红),WANG HF(王会福),ZHANG SC(张顺昌).The pharmacodynamic test of broccoli clubroot disease control using Bacillus subtilis(枯草芽孢杆菌防治西兰花根肿病药效试验)[J]. Journal of Zhejiang Agricultural Sciences(浙江农业科学),2012(7):1008-1009.
[8]FANG H(方辉),WANG HF(王会福),YU SH(余山红),et al.Control efficacy of insecticides mixture on broccolis(几种药剂混配防治西兰花根部病害综合效果试验)[J].Biological Disaster Science(生物灾害科学),2013,36(2):199-201.
[9]WU DJ(吴道军),CHEN GK(陈国康),YANG XQ(杨晓琴),et al.Application of four kinds of cabbage clubroot disease classification standards evaluation(4种甘蓝根肿病分级标准的应用评价)[J]. Southwest China Journal of Agricultural Sciences(西南农业学报),2013,26(2): 591-594.
[10]WANG XM(王晓梅),ZANG DC(臧东初),CUI CJ(崔长军),et al.Spatial distribution pattern of rust in maize and bean(玉米锈病和小豆锈病的空间分布型研究)[J].Journal of Jilin Agricultural University(吉林农业大学学报),2007,29(5):488-490.
[11]WANG HD(王华弟),SUN GC(孙国昌),ZHANG HM(张恒木),et al.Spatial distribution pattern and sampling technique of rice stripe virus(RSV)(水稻条纹叶枯病空间分布格局及抽样技术)[J]. Acta Agriculturae Zhejiangensis(浙江农业学报),2007,19(5):360-363.
[12]TANG QY(唐启义),FENG MG(冯明光).Practical statistic analysis and its computer processing platform(实用统计分析及其计算机处理平台)[M].Beijing:China Agriculture Press(北京:中国农业出版社),2002:205-208.
[13]XU SF(徐森富),WANG HF(王会福),YU SH(余山红),et al.Spatial distribution pattern and sampling technique for sclerotinia sclerotiorum in rape fields(油菜菌核病病株空间分布格局及抽样技术研究)[J].Bulletin of Science and Technology(科技通报),2013,29(3): 96-99.
[14]TAO WL(陶伟林),FAN GC(樊国昌),ZHOU N(周娜),et al.The preliminary report on field control effect test of cabbage clubroot(髙山甘蓝根肿病田间防效试验初报)[J].South China Agriculture(南方农业),2011,5(7):12-14.
[15]ZHU LM(朱黎明),ZHENG YL(郑永利). The spatial distribution pattern of infected plants caused by cucumber downy mildew, Pseudoperonospora cubensis(Berk et Curt)Rostov(黄瓜霜霉病病株空间分布格局研究)[J].Acta Agriculturae Zhejiangensis(浙江农业学报),2006,18(4):277-279.
[16]SI J(司军),LI CQ(李成琼),SONG HY(宋洪元),et al.Identification and evaluation of resistance to clubroot in cabbage (Brassica oleracea var.capitata L)(结球甘蓝对根肿病的抗性鉴定与评价)[J].Journal of Southwest Agricultural University(西南大学学报(自然科学版)),2009(6):26-30.
[17]LIU B(刘波),ZHU YJ(朱育菁),XIAO RF(肖荣凤),et al.Spatial distribution pattern and sampling technique for the fungal wilt disease in watermelon fields(西瓜枯萎病株空间分布格局及其抽样技术)[J].Acta Ecologica Sinica(生态学报),2004,24(9):2043-2049.
[18]TAO WL(陶伟林),FAN GC(樊国昌),ZHOU N(周娜),et al.The preliminary report on field control effect test of cabbage clubroot(髙山甘蓝根肿病田间防效试验初报)[J].South China Agriculture(南方农业),2011,5(7):12-14.
Responsible editor:Nanling WANG
Responsible proofreader:Xiaoyan WU
西兰花根肿病空间分布型及抽样技术研究
钟列权1,王会福2*,余山红2(1.台州市植物保护检疫站,浙江椒江318000;2.台州市农业科学研究院,浙江临海317000)
[目的]进一步提高对西兰花根肿病预测预报与持续控制能力。[方法]应用最小二乘法、频次分布、聚集度指标、m*-m回归分析和Taylor幂法则等对病株的空间分布型进行了分析。[结果]西兰花根肿病病株田间分布趋向于聚集分布。m*-m回归分析表明病株空间分布的基本成分是个体群,病株个体间相互吸引;病害在大田中存在明显的发病中心,个体群在田间呈均匀分布格局,即分布的基本成分个体群之间趋于均匀分布。Taylor幂法则分析表明,西兰花根肿病病株个体的空间格局随着病株密度的提高越趋均匀分布。在此基础上,提出了Iwao最适理论抽样模型N=273.954 1/m-
西兰花根肿病;空间分布型;最适理论抽样模型;序贯抽样模型;抽样数
浙江省台州市科技计划农业重点项目(121KY17)。
钟列权(1974-),男,浙江温岭人,高级农艺师,从事植保技术研究和推广工作,E-mail:zlq@tzag.gov.cn。*通讯作者,硕士,高级农艺师,从事植保技术研究和推广工作,E-mail:tznkywhf@126.com。。
2015-05-28
Supported by Agricultural Key Projects of Science and Technology Program of Taizhou City in Zhejiang Province(121KY17).
*Corresponding author.E-mail:tznkywhf@126.com
Received:May 28,2015 Accepted:November 14,2015
修回日期 2015-11-14
59.698 5,并建立序贯抽样模型T0(N)=0.368 4N±,即:调查株数N时,若累计发病率超过上界可定为防治对象田,若累计发病率未达到下界时,可定为不防治田,若累计发病率在上下界之间,则应继续调查,直到最大样本数m0=0.368 4时,也即发病率15%,所需抽样数684株。[结论]该研究结果对于病害防治具有十分重要的指导意义。
猜你喜欢
杂志排行

Agricultural Science & Technology的其它文章
- An lnnovative Strategy for Reciprocal Distant Hybridization between Spartina alterniflora and Rice
- Study on Absorptive Capacity to Formaldehyde and Physiological and Biochemical Changes of Scindapsus aureus Based on the Regulation of LaCl3
- Dynamic Variation in Sugar,Acid,and ASA Contents of‘Ganmi 6’Kiwifruit(Actinidia eriantha Benth)Fruits
- Construction and Development of GMS Agricultural lnformation Network Based on Stakeholder Analysis
- Effects of Different Decolorants on Retention Rate of Total Triterpenes in Fruit and Rattan Stems of Schisandra chinensis(Turcz.)Baill
- Determination of Heavy Metals inDendrobium candidiumWall.ex Lindl.by lCP-MS