Shear strength behavior of geotextile/geomembrane interfaces Belén M.Bacasa,*,Jorge Cañizalb,Heinz Konietzkyc
2015-10-09TerrsolumGeotechniclEngineeringTechnologyDevelopmentCenterofUniversityofCntbriCDTUCSntnderSpin
Terrsolum S.L.Geotechnicl Engineering,Technology Development Center of University of Cntbri(CDTUC),Sntnder,Spin
bSchool of Civil Engineering,University of Cantabria,Santander,Spain
cGeotechnical Institute,TU Bergakademie Freiberg,Freiberg,Germany
Shear strength behavior of geotextile/geomembrane interfaces Belén M.Bacasa,*,Jorge Cañizalb,Heinz Konietzkyc
aTerrasolum S.L.Geotechnical Engineering,Technology Development Center of University of Cantabria(CDTUC),Santander,Spain
bSchool of Civil Engineering,University of Cantabria,Santander,Spain
cGeotechnical Institute,TU Bergakademie Freiberg,Freiberg,Germany
A R T I C L E I N F O
Article history:
in revised form 8 July 2015
Accepted 5 August 2015
Available online xxx
Geotextiles
Geomembranes
Landfills
Fiber length
Roughness
Shear strength
Friction angle
A B S T R A C T
This paper aims to study the shear interaction mechanism of one of the critical geosynthetic interfaces, the geotextile/geomembrane,typically used for lined containment facilities such as landfills.A large direct shear machine is used to carry out 90 geosynthetic interface tests.The test results show a strain softening behavior with a very small dilatancy(<0.5 mm)and nonlinear failure envelopes at a normal stress range of 25-450 kPa.The influences of the micro-level structure of these geosynthetics on the macro-level interface shear behavior are discussed in detail.This study has generated several practical recommendations to help professionals to choose what materials are more adequate.From the three geotextiles tested,the thermally bonded monofilament exhibits the best interface shear strength under high normal stress.For low normal stress,however,needle-punched monofilaments are recommended. For the regular textured geomembranes tested,the space between the asperities is an important factor. The closer these asperities are,the better the result achieves.For the irregular textured geomembranes tested,the nonwoven geotextiles made of monofilaments produce the largest interface shear strength.
©2015 Institute of Rock and Soil Mechanics,Chinese Academy of Sciences.Production and hosting by
Elsevier B.V.All rights reserved.
1.Introduction
The main functions of a municipal solid waste(MSW)landfill are to permit the maximum accumulation of waste in the smallest possible space and to isolate the waste from the natural surroundings.Besides,a MSW has to maintain security and provide a future usage after its closure.Landfill liner and cover systems are mainly formed by geosynthetic protection layers, which interact on geosynthetic/geosynthetic and geosynthetic/ soil interfaces.
An important subject with respect to the landfill stability is the interface shear strength,which has been investigated thoroughly in the last decade(e.g.Fox and Kim,2008;McCartney et al.,2009;Palmeira,2009;Eid,2011;Fox and Ross,2011;Brachman and Sabir, 2013;Thielmann et al.,2013).
The geotextile/geomembrane interfaces can be used for both liner and cover systems of the landfills.Geomembranes are typically used as a hydraulic barrier and geotextiles protect it from damages that may occur in some situations,such as high normal stressesandangularsoilparticles.Geotextile/geomembrane interfaces have previously been studied by Giroud et al.(1990), Koutsourais et al.(1991),Giroud and Darrasse(1993),Gilbert and Byrne(1996),Stark et al.(1996),Jones and Dixon(1998),Wasti and Özdüzgün(2001),Hebeler et al.(2005),Bergado et al.(2006)and Pitanga et al.(2009).
The objective of this paper is to study the interface shear behavior of the geotextile/geomembrane,providing a deeper understanding of how the structure of these geosynthetics at a microlevel influences the interface shear behavior at a macro-level.The interface shear behavior is studied by means of the direct shear tests on 18 different interfaces using 8 different geosynthetic materials.The guidelines of ASTM D5321(2014)are followed during the direct shear test on different types of geosynthetic interfaces. The means to grip the different geosynthetics and the suitable test parameters(shear displacement rate,consolidation time,hydration time)are established based on the studies from Stark and Poeppel(1994),Stark et al.(1996),Fox et al.(1997,1998),Gilbert et al.(1997),Jones and Dixon(1998),Eid et al.(1999),Triplett and Fox(2001),Zornbergetal.(2005),Sharmaetal.(2007)and McCartney et al.(2009).The following relationships are analyzed in this study:interface shear strength vs.shear displacement,shear displacementvs.normaldisplacement,andinterfaceshear strength vs.normal stress.
This paper provides a useful and practical application for both researches and practitioners who use these materials in the field, helping them to make a decision about what geosynthetic material could work better in a particular loading condition.
2.Experimental work
2.1.Materials
The characteristics of geosynthetics used for the direct shear tests are listed in Table 1 and described as follows:
(1)Three nonwoven geotextiles:GT1(500 g/m2)is made of needle-punched monofilaments;GT2(500 g/m2)is made of needle-punched staple fibers;and GT3(335 g/m2)is made of thermally bonded monofilaments.
(2)Five geomembranes of 1.5 mm thickness:GMs has smooth surfaces;GMr1 and GMr4 have irregular heavy textured surfaces smaller than 1 mm;GMr2s1 and GMr3 show regular, evenly spread asperities greater than 1 mm;GMr2s2 exhibits regular spread asperities smaller than 1 mm.
Table 2 summarizes the geotextile/geomembrane interfaces tested as well as the testing conditions.
2.2.Testing equipment
The tests on geosynthetics are carried out with a large direct shear machine,whose shear box is 300 mm long and 300 mmwide and therefore fulfills the minimum requirements.The tests are performed at a constant shear displacement rate and fixed normal stress.The shear box is divided intoa moving lowerpart anda static upper part.The geotextile is fastened to the lower box,while the geomembrane is fastened to the upper box.The following gripping systems are used for the different types of geosynthetics:
(1)Geotextiles are gripped with a double-side adhesive tape.This system works well for the range of normal stresses tested.
(2)Based on the studies of Fox et al.(1997,1998),a particularly textured plate is designed for gripping the drainage geocomposites,the geomembranes and the geosynthetic clay liner(GCL).Thedimensionsofthisplateare 300 mm×285 mm×10 mm.The plate has 210 drainage holes of 2 mm diameter and 1680 pyramids of 1 mm height,which protrudes fromthe topside,as shown in Fig.1a.The bottom side has channels to allow for water flow,as shown in Fig.1b.This plate is screwed onto a metal support that is placed into the direct shear box.The topside is in contact with the geosynthetic and the bottom side is in contact with the metal support.
2.3.Test procedure
The shear test is carried out according to ASTM D5321(2014). The geotextile/geomembrane interfaces are tested under wet conditions with the following parameters:
(1)Hydration time is 24 h for the geotextiles and the geomembranes were not hydrated.The geotextile samples are submerged into tap water inside a humidity chamber(temperature of 21°C,humidity of 96%).
(2)Consolidation time inside the machine is 10 min.
(3)Constant shear rate is 5 mm/min.Stark et al.(1996)and Triplett and Fox(2001)found out that the shear rate does not significantly affect the peak and post-peak strengths.
The normal stress is applied to the loading platen above the upper metal support.After 10 min of consolidation,the lower shear box moves inparallel direction tothe shear forceat a constant shear rate.The maximum shear displacement is 50 mm.The shear displacement,shear force and vertical displacement are recorded during the test.The shear force is measured using a suitable dynamometric ring.Two linear variable differential transformers(LVDTs)are used to measure the shear and vertical displacements.
3.Constitutive model on geosynthetic interfaces
All interfaces tested exhibit frictional behavior,which is modeled by Mohr-Coulomb's equationτ=ca+σntanδ,whereτ andσnare the interface shear strength and normal stress acting on the failure plane,respectively;cais the adhesion;andδis the interface friction angle.Linear regression of the plot ofτvs.σnis used to identify the best-fit shear strength parameters.The shear strength of most interfaces tested in this study presents important friction angles and negligible adhesion.
4.Direct shear test results
As mentioned above,the geotextile/geomembrane interfaces are tested under wet conditions(Table 2).However,the water content does not affect significantly the interface shear strength,as shown in Fig.2 as well as proven by Mitchell and Mitchell(1992)and Bergado et al.(2006).The range of normal stresses applied is 25-450 kPa.The peak interface shear strength is usually reached at shear displacement of 4-10 mm and the post-peak strength is obtained at shear displacement around 50 mm.

Table 1 Type of geosynthetics.

Table 2 Geosynthetic interfaces tested and testing conditions.

Fig.1.Textured plate for gripping textured geomembranes.(a)Topside and(b)Bottom side.
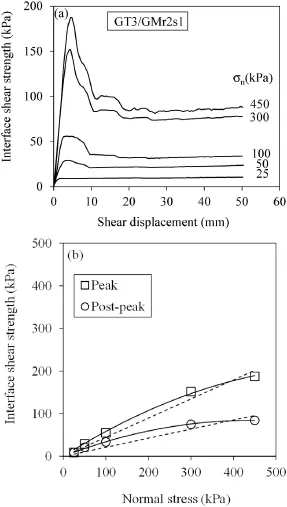
Fig.3 presents the typical interface shear strength behavior for nonwoven geotextile/textured geomembrane interfaces.The shear strength-shear displacement curves in Fig.3a show strain softening behavior,i.e.the interface shear strength decreases with increasing shear displacement(Byrne,1994;Stark et al.,1996;Jones and Dixon,1998).The higher the normal stress,the higher the strain softening behavior.This phenomenon is observed in rock joints but contrary to geosynthetic interfaces,the higher the normal stress in this case,the lower the strain softening behavior. Based on this fact,Bacas et al.(2011)proposed a new shear constitutive model for this type of interface.
In this study,approximately 60%of the tests reveal nonlinear failure envelopes whereas 40%are linear envelopes.Fig.3b shows nonlinear peak and post-peak failure envelopes(continuous lines). However,the straight envelopes,passing through the origin(dashed lines)with peak and post-peak friction angles of 24°and 12°,respectively,also show a good fit(R2>0.9).
In line with Giroud et al.(1990),Koutsourais et al.(1991),Stark et al.(1996),Hebeler et al.(2005)and McCartney et al.(2009),the interaction mechanisms during the shear tests on nonwoven geotextile/texturedgeomembraneinterfacesshowthefollowing behaviors:

Fig.2.Geotextile/geomembrane interface shear strength in wet and dry conditions.
(1)At low normal stress(<50 kPa),the interaction between
nonwoven geotextiles and the textured geomembranes consists of two mechanisms:(i)one is the interlocking(hook and loop)between the superficial filaments of the geotextile and the asperities of the geomembrane,(ii)the other is the friction between the materials.Both take place on a superficial level.
(2)As the normal stress increases(>50 kPa),the geotextile is compressed and the asperities are introduced into the geotextile matrix,which is called interbedding factor.Thus,the friction and interlocking interactions take place on a matrix level.
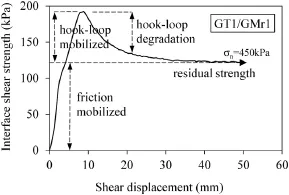
Fig.4 illustrates how the peak interface shear strength is reached fora small sheardisplacement(peak displacement),during which the friction angle is mobilized first and then the hook and loop interact,causing the shear strength to reach its peak.After the peak,the hook and loop mechanism degrades since the filaments are pulled out,torn and untangled from the geotextile until the residual interface shear strength is reached.
Bacas et al.(2011)developed an interface shear model based on rock joint theories,quantifying the interbedding and the interlocking(hook and loop)factors,which depend mainly on the type of geotextile and the asperities of the geomembrane.Their respective ranges are 1-3 for the interbedding factor and 2-8 for the interlocking factor.The higher the asperity height,the higher the interlocking factor.Besides,the larger the hollows of the geotextile,the higher the interbedding factor.An example for such a geotextile would be one made of staple fibers.

Fig.3.Typical interface shear strength behavior for nonwoven geotextile/textured geomembrane interfaces.(a)Shear strength vs.shear displacement curves,and(b)Peak and post-peak failure envelopes.
5.Influence of roughness characteristics of geomembranes on interface shear strength
5.1.Effect of roughness patterns
The differences between the various roughness patterns are analyzed through the interface shear strength vs.shear displacement curves of the nonwoven needle-punched geotextile,GT1. Fig.5a presents the GT1/GMr1,GT1/GMr2s1 and GT1/GMr3 results. GMr1 has a rough,irregular texturing while GMr2s1 and GMr3 have regular asperities,as shown in Fig.6,which presents microscope images of roughness.Interface shear strength presents similar values at normal stress lower than 50 kPa and depends neither on the roughness pattern nor on the asperity height.At normal stress higher than 50 kPa,regular texturing normallyshows larger interface shear strength and strain softening behavior than irregular texturing.The downward stepping post-peak curves of GMr3 and GMr2s1 with their successive peaks(mini-peaks)are caused by the deterioration of the geotextile fiber weft,as can be observed at normal stress of 300 kPa.The separation between the mini-peaks matches the separation between the asperities.GMr3 and GMr2s1 have asperities spaced at 6 mm and 9 mm in staggered rows,respectively.Therefore,the GMr3 presents larger peak and post-peak interface shear strengths than GMr2s1.This means that the closer the asperities are,the better the result achieves but without becoming too close,because the surface could become uniform.One has to bear in mind,however,that until 100 kPa,the shear results of GMr3 and GMr2s1 show similar values.
Fig.5b illustrates the results of three different geomembranes with different roughness patterns and different asperity heights less than 1 mm.GMr2s2 has regular asperities spaced at 4 mm,and GMr1 and GMr4 have rough irregular texturing,however GMr1 is rougher than GMr4(Fig.6).The curves at normal stress of 50 kPa are similar,but at normal stress higher than 50 kPa,the differences between roughness patterns affect the interface shear strength. GMr1 and GMr2s2 show an increased frictional performance compared with GMr4.The post-peak curves are uniform without any successive steps,even though the GMr2s2 has regular asperities,but these are too close.

Fig.4.Illustration of the decomposition of strain softening behavior.
5.2.Effect of asperity height
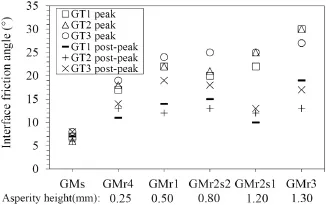
Fig.7 presents the interface friction angles vs.asperity heights. The following important aspects are observed:
(1)The smaller values of interface friction angle belong to the smooth geomembrane(GMs).Shear strength is purely frictional;hence the geotextile/GMs interfaces present similar peak and post-peak friction angles.
(2)The higher the geomembrane roughness,the higher the peak interface shear strength(Ivy,2003;McCartney et al.,2005). Therefore,GMr2s1 and GMr3 show the greatest peak values while GMr4 presents the smallest peak friction angle.
(3)The geomembranes with an asperity height larger than 1 mm present greater post-peak interface strength loss due to their high capacity of damaging the geotextile fiber wefts.
(4)The post-peak values do not show a clear trend related to the size of the asperity,but they do show dependency on the type of geotextile(McCartney et al.,2005).
6.Influence of fiber characteristics of geotextile on interface shear strength
6.1.Effect of fiber length
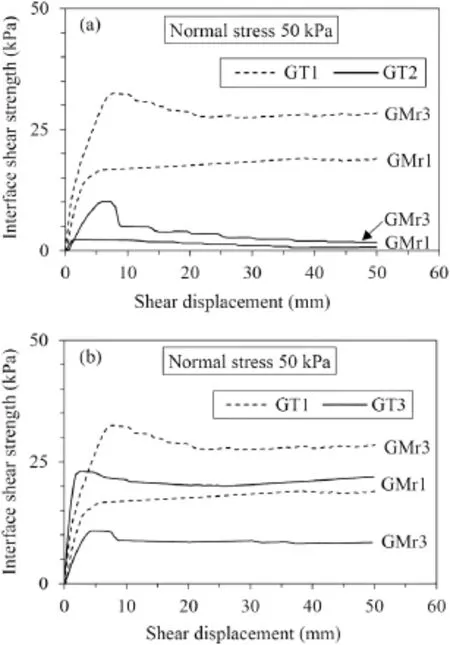
The influence of the geotextile fibers'length on the interface shear strength is observed through comparing the nonwoven needle-punched geotextiles GT1 and GT2 in Fig.8.They are made of monofilament and staple fibers,respectively,as shown in Fig.9a and b,which are microscope plots of the fibers.At normal stress lower than 100 kPa,GT1 presents larger peak values than GT2.This is because the length of the fibers greatly affects the interface shear strength at low normal stress,as can be observed in Fig.10a,which depicts the interface shear strength vs.shear displacement curves at normal stress of 50 kPa.GT2 presents a smaller interface shear strength,because on a superficial level,the staple fibers do not develop the interlocking mechanism as much as the monofilament of GT1 does.However,at normal stress higher than 100 kPa,thepeak values are closer for both materials(Fig.8).The lower postpeak values belong to the GT2 because its staple fibers are easier todamagethanthemonofilamentsweft,whicharemore intertwined.

Fig.5.Comparison of different roughness patterns:(a)regular(GMr3,GMr2s1)and irregular(GMr1)texturing,(b)irregular texturing with asperity height less than 1 mm.
6.2.Effect of geotextile manufacture
The influence of the manufacture of the geotextiles can be observedthroughcomparingthenonwovenmonofilament geotextiles GT1 and GT3.The former is a needle-punched fabric and the latter is a thermally bonded one.Fig.9a and c prove that GT1 has looser filaments and larger hollows than GT3.The latter shows a higher interlocking leading to a higher interface shear strength,as shown in Figs.7 and 8a.An exception to this is presented in Fig.8b, where the GT3/GMr3 interface presents the lowest interface shear strength.The asperities cannot penetrate the geotextile matrix deeply enough because of the smaller hollows.Moreover,the regular texturing creates linear tracks through the geotextile which acts like a plow,stretching the superficial filaments,as can be observed in Fig.11a which shows the samples after testing.Fig.11b indicates that the interaction between GMr1 and GT3 leads to higher interlocking(hook and loop)due to the greater entanglement between the filaments and the irregular roughness.This behavior is also observed at low normal stress(see Fig.10b).

Fig.7.Friction angles of geotextile/geomembrane interfaces tested in wet conditions.

Fig.6.Scanning electron microscope(SEM)images of roughness of geomembrane.Asperity average height:(a)GMr3:~1.3 mm,(b)GMr2s1:~1.2 mm,(c)GMr2s2:~0.8 mm,(d)GMr1:~0.5 mm,(e)GMr4:~0.25 mm.
The post-peak interface shear strengths mainly depend on the type of geotextile.Usually,GT3 presents the largest post-peak values,because thermally bonded monofilaments are stretched and very tangled during the shear,causing a higher resistance as the geomembrane slides over the geotextile.However,the needlepunched monofilaments of the GT1 are stretched and brushed in shear direction,facilitating the geomembrane to slide over the geotextile's surface.Finally,GT2 normally presents the lowest post-peak values because its staple fibers are stretched and brushed most easily.

Fig.8.Comparison of interface shear strength between 3 nonwoven geotextiles.(a)Geotextile/GMr1,and(b)Geotextile/GMr3.
The conclusion from these analyses is that the manufacturing process of the geotextile influences both the peak and the post-peak interface shear strengths.If the roughness of the geomembrane is irregular and dense,we recommend using thermally bonded monofilaments,because the interlocking mechanism has a major influence on interface shear strength.If,however,the roughness is regular and uniform,we rather recommend using needle-punched filaments,especially for high normal stress levels,where the interbedding factor has higher influence on the interlocking mechanism and thereby on the interface shear strength.Finally,for cover systems of the landfills subject to low ranges of normal stresses(<100 kPa),it is recommended using monofilament rather than staple fibers,because the former mobilizes the interlocking mechanism at lower normal stresses better than the latter.

Fig.10.Comparison of interface shear strength at low normal stress for(a)needlepunched geotextile(GT1,GT2)/GMr,(b)needle-punched geotextile(GT1)/GMr and thermally bonded geotextile(GT3)/GMr.
7.Conclusions
The study of large direct shear tests conducted on geotextile/ geomembrane leads to the following main conclusions:
(1)The interface interaction mechanisms depend on normal stress. At low normal stress(<50 kPa),interlocking and friction develop at a superficial level.At high normal stress(>50 kPa), interlocking and friction develop at a matrix level.
(2)If the roughness of the geomembrane is irregular and dense,it is recommended using the nonwoven geotextile made of monofilaments,because it develops larger interlocking mechanism causing the shear strength to increase.

Fig.9.SEM images of nonwoven geotextiles.(a)GT1:needle-punched monofilament,(b)GT2:needle-punched staple fibers,(c)GT3:thermally bonded monofilament.

Fig.11.Thermally bonded geotextile after testing at normal stress of 300 kPa.(a)GT3/ GMr3,and(b)GT3/GMr1.
(3)If the roughness of the geomembrane is regular and evenly spread,it is recommended using the nonwoven geotextile with needle-punched filaments,especially for high normal stresses(≥100 kPa),where the interbedding factor has larger influence on the interlocking mechanism and thus on the shear strength.
(4)For cover systems of the landfills subject to low normal stresses(<100 kPa),it is recommended using monofilaments rather than staple fibers,since the former mobilize the interlocking mechanism at lower normal stresses.
(5)For regular textured geomembranes,the space between the asperities is an important factor.The closer these asperities are, the better the result achieves.Nevertheless,they should not be too close because the surface could become uniform,thereby decreasing the interlocking mechanism.
Conflict of interest
The authors confirm that there are no known conflicts of interest associated with this publication and there has been no significant financial support for this work that could have influenced its outcome.
Acknowledgments
This work was derived from an extensive research project sponsored by the Company Ferrovial S.A.(Spain)conducted by the Geotechnical Group at the School of Civil Engineering,the University of Cantabria(Spain).The facilities provided for this research project are gratefully acknowledged.Moreover,the authors are grateful to Deutscher Akademischer Austausch Dienst(DAAD, Germany)for the research fellowship received,as well as the facilities provided by the Chair for Rock Mechanics at the Geotechnical Institute,the TU Bergakademie Freiberg(Germany).
References
ASTM D5321.Standard test method for determining the shear strength of soilgeosynthetic and geosynthetic-geosynthetic interfaces by direct shear.West Conshohocken,PA,USA:ASTM International;2014.
Bacas BM,Konietzky H,Cañizal J,Sagaseta C.A new constitutive model for textured geomembrane/geotextile interfaces.Geotextiles and Geomembranes 2011;29(2):137-48.
Bergado DT,Ramana GV,Sia HI,Varun.Evaluation of interface shear strength of composite liner system and stability analysis for a landfill lining system in Thailand.Geotextiles and Geomembranes 2006;24(6):371-93.
Brachman RWI,Sabir A.Long-term assessment of a layered-geotextile protection layer for geomembranes.Journal of Geotechnical and Geoenvironmental Engineering 2013;139(5):752-64.
Byrne RJ.Design issues with strain-softening interfaces in landfill liners.In:Proceedings of waste technology;1994.Charleston,South Carolina,Session 4, Paper 4.
Eid HT,Stark TD,Doerfler CK.Effect of shear displacement rate on internal shear strength of a reinforced geosynthetic clay liner.Geosynthetics International 1999;6(3):219-39.
Eid HT.Shear strength of geosynthetic composite systems for design of landfill liner and cover slopes.Geotextiles and Geomembranes 2011;29(3):335-44.
Fox PJ,Kim RH.Effect of progressive failure on measured shear strength of geomembrane/GCL interface.Journal of Geotechnical and Geoenvironmental Engineering 2008;134(4):459-69.
Fox PJ,Ross JD.Relationship between NP GCL internal and HDPE GMX/NP GCL interface shear strengths.Journal of Geotechnical and Geoenvironmental Engineering 2011;137(8):743-53.
Fox PJ,Rowland MG,Scheithe JR,Davis KL,Supple MR,Crow CC.Design and evaluation of a large direct shear machine for geosynthetic clay liners.Geotechnical Testing Journal 1997;20(3):279-88.
Fox PJ,Rowland MG,Scheithe JR.Internal shear strength of three geosynthetic clay liners.JournalofGeotechnicalandGeoenvironmentalEngineering 1998;124(10):933-44.
Gilbert RB,Byrne RJ.Strain-softening behavior of waste containment system interfaces.Geosynthetics International 1996;3(2):181-202.
Gilbert RB,Scranton HB,Daniel DE.Shear strength testing for geosynthetic clay liners.In:Testing and acceptance criteria for geosynthetic clay liners.Conshohocken,PA,USA:ASTM International;1997.
Giroud JP,Darrasse J.Hyperbolic expression for soil-geosynthetics or geosyntheticsgeosyntheticinterfaceshearstrength.GeotextilesandGeomembranes 1993;12(3):275-86.
Giroud JP,Swan RH,Richer PJ,Spooner PR.Geosynthetic landfill cap:laboratory and field tests,design and construction.In:Geotextiles,geomembranes and related products.Rotterdam,Netherlands:A.A.Balkema;1990.p.493-8.
Hebeler GL,Frost JD,Myers AT.Quantifying hook and loop interaction in textured geomembrane-geotextile systems.Geotextiles and Geomembranes 2005;23(1):77-105.
Ivy N.Asperity height variability and effects.GFR 2003;21(8):28-9.
Jones DRV,Dixon N.Shear strength properties of geomembrane/geotextile interfaces.Geotextiles and Geomembranes 1998;16(1):45-71.
Koutsourais MM,Sprague CJ,Pucetas RC.Interfacial friction study of cap and liner components for landfill design.Geotextiles and Geomembranes 1991;10(5-6):531-48.
McCartney JS,Zornberg JG,Swan RH.Analysis of a large database of GCL-geomembrane interface shear strength results.Journal of Geotechnical and Geoenvironmental Engineering 2009;135(2):209-23.
McCartney JS,Zornberg JG,Swan RH.Effect of geomembrane texturing on GCL-geomembrane interface shear strength.In:Proceedings of GeoFrontiers 2005. Reston,VA,USA:American Society of Civil Engineers(ASCE);2005.p.1-11.
Mitchell RA,Mitchell JK.Stability evaluation of waste landfills.In:Proceedings of stability and performance of slopes and embankments II.Geotechnical Special Publication No.31.Reston,VA,USA:American Society of Civil Engineers(ASCE);1992.p.1152-87.
Palmeira EM.Soil-geosynthetic interaction:modelling and analysis.Geotextiles and Geomembranes 2009;27(5):368-90.
Pitanga HN,Gourc JP,Vilar OM.Interface shear strength of geosynthetics:evaluation and analysis of inclined plane tests.Geotextiles and Geomembranes 2009;27(6):435-46.
Sharma JS,Fleming IR,Jogi MB.Measurement of unsaturated soil-geomembrane interfaceshear-strengthparameters.CanadianGeotechnicalJournal 2007;44(1):78-88.
Stark TD,Poeppel AR.Landfill liner interface strengths from torsional-ring-shear tests.Journal of Geotechnical Engineering 1994;120(3):597-615.
Stark TD,Williamson TA,Eid HT.HDPE geomembrane/geotextile interface shear strength.Journal of Geotechnical Engineering 1996;122(3):197-203.
Thielmann SS,Fox PJ,Athanassopoulos C.Interface shear testing of GCL liner systems for very high normal stress conditions.In:Proceedings of Geo-Congress2013:stability and performance of slopes and embankments III.California. Reston,VA,USA:American Society of Civil Engineers(ASCE);2013.p.63-71.
Triplett EJ,Fox PJ.Shear strength of HDPE geomembrane/geosynthetic clay liner interfaces.JournalofGeotechnicalandGeoenvironmentalEngineering 2001;127(6):543-52.
Wasti Y,Özdüzgün ZB.Geomembrane geotextile interface shear properties as determined by inclined board and direct shear box tests.Geotextiles and Geomembranes 2001;19(1):45-57.
Zornberg JG,McCartney JS,Swan RH.Analysis of a large database of GCL internal shear strength results.Journal of Geotechnical and Geoenvironmental Engineering 2005;131(3):367-80.

Belén M.Bacas obtained a M.Sc.and a Ph.D.degree from University of Cantabria,Spain.She is geotechnical engineer in Terrasolum S.L.and assistant professor of Mechanics of Continuous Media at the University of Cantabria.She has been involved in geotechnical research,consulting and education for the last 10 years.She is co-author of 6 scientific papers.She has worked on a series of mining and geotechnical projects,both at home and abroad.In recent years,she has been collaborated in two European Projects:COGAN and GEOAPPS,Apps for geotechnical field work.
5 May 2015
*Corresponding author.Tel.:+34 942272685.
E-mail address:bacasb@terrasolum.es(B.M.Bacas).
Peer review under responsibility of Institute of Rock and Soil Mechanics, Chinese Academy of Sciences.
1674-7755©2015 Institute of Rock and Soil Mechanics,Chinese Academy of Sciences.Production and hosting by Elsevier B.V.All rights reserved.
http://dx.doi.org/10.1016/j.jrmge.2015.08.001
杂志排行
Journal of Rock Mechanics and Geotechnical Engineering的其它文章
- Characterizing the influence of stress-induced microcracks on the laboratory strength and fracture development in brittle rocks using a finite-discrete element method-micro discrete fracture network FDEM-μDFN approach
- Effects of fracture distribution and length scale on the equivalent continuum elastic compliance of fractured rock masses
- Engineering properties for high kitchen waste content municipal solid waste
- Effects of spatial variation in cohesion over the concrete-rock interface on dam sliding stability
- Evaluation of the effect of sodium silicate addition to mine backfill, Gelfill-Part 2:Effects of mixing time and curing temperature
- Studies on the key parameters in segmental lining design
