Effects of fracture distribution and length scale on the equivalent continuum elastic compliance of fractured rock masses
2015-10-09MrteGutierrezDongJoonYoun
Mrte Gutierrez,Dong-Joon Youn
aDepartment of Civil and Environmental Engineering,Colorado School of Mines,Golden,CO 80401,USA
bDepartment of Civil Infrastructure and Environmental Engineering,Khalifa University,Abu Dhabi,United Arab Emirates
Effects of fracture distribution and length scale on the equivalent continuum elastic compliance of fractured rock masses
Marte Gutierreza,b,*,Dong-Joon Youna
aDepartment of Civil and Environmental Engineering,Colorado School of Mines,Golden,CO 80401,USA
bDepartment of Civil Infrastructure and Environmental Engineering,Khalifa University,Abu Dhabi,United Arab Emirates
A R T I C L EI N F O
Article history:
in revised form
28 June 2015
Accepted 21 July 2015
Available online 28 September 2015
Fractured rock mass
Equivalent continuum elastic compliance
Monte Carlo simulation(MCS)
Representative element volume(REV)
Scale effects
A B S T R A C T
Fracture systems have strong influence on the overall mechanical behavior of fractured rock masses due to their relatively lower stiffness and shear strength than those of the rock matrix.Understanding the effects of fracture geometrical distribution,such as length,spacing,persistence and orientation,is important for quantifying the mechanical behavior of fractured rock masses.The relation between fracture geometry and the mechanical characteristics of the fractured rock mass is complicated due to the fact that the fracture geometry and mechanical behaviors of fractured rock mass are strongly dependent on the length scale.In this paper,a comprehensive study was conducted to determine the effects of fracture distribution on the equivalent continuum elastic compliance of fractured rock masses over a wide range of fracture lengths.To account for the stochastic nature of fracture distributions,three different simulation techniques involving Oda's elastic compliance tensor,Monte Carlo simulation(MCS), and suitable probability density functions(PDFs)were employed to represent the elastic compliance of fractured rock masses.To yield geologically realistic results,parameters for defining fracture distributions were obtained from different geological fields.The influence of the key fracture parameters and their relations to the overall elastic behavior of the fractured rock mass were studied and discussed.A detailed study was also carried out to investigate the validity of the use of a representative element volume(REV)in the equivalent continuum representation of fractured rock masses.A criterion was also proposed to determine the appropriate REV given the fracture distribution of the rock mass.
©2015 Institute of Rock and Soil Mechanics,Chinese Academy of Sciences.Production and hosting by
Elsevier B.V.All rights reserved.
1.Introduction
Rock masses inevitably contain fractures with varying fracturing intensity over a wide range of length scales.Fracture geometry has often very complex patterns,and fracture distributions and properties are strongly dependent on the length scale.Since the mechanical stiffness and strength of fractures are much lower than those of the rock matrix,the overall mechanical response of fractured rock masses is controlled by the fractures.Fractures contribute additional displacements to the rock mass,and owing to the complicated fracture geometry,the mechanical response is generally anisotropic even if the surrounding rock matrix behavior is isotropic.In addition to the mechanical behavior,geometrical distribution of fractures in a rock mass and corresponding fracture properties including length,orientation,frequency and stiffness, are key factors that control the mechanical behavior of fractured rock masses.Developing a comprehensive relation between fracture geometry and the overall mechanical characteristics of fractured rock masses is challenging because of the generally complex nature of fracture patterns and distributions.
Since the 1950s,several numerical procedures have been developed for modeling the mechanical behavior of fractured rock masses and the effect of different fracture patterns.The most rigorous approaches are the distinct fracture network(DFN)model and distinct element method(DEM).In DFN and DEM,individual fractures in a rock mass are modeled explicitly as distinct features that deform in the normal and shear directions.These methods can be used to precisely determine the explicit behavior of fractured rock masses.In many cases,however,considering all the individual fractures by the DFN and DEM models is computationally impossible as well as practically unachievable due to the lack of reliable data on fracture distribution and pattern.Thus,these simulation techniques are typically used only for defining the mechanical behavior of major faults and fractures as individual features(Guvanasen and Chan,2000),as well as the small(e.g.core)scale mechanical behavior of rocks(Esmaieli et al.,2015).
An alternative approach to modeling of fractured rock masses is to average the mechanical contributions from the fractures to obtain an equivalent continuum representation of the rock mass stress-strain behavior.Equivalent continuum models(ECMs)assume that a sufficiently large representative element volume(REV)exists,and that this REV contains“a sufficient number of representative fractures in a rock mass over which the fractures' stress-strain behavior can be averaged”.Since the initial concept of ECM was first developed by Eshelby(1957),different numerical approaches based on ECMs have been introduced.The three most general ECMs for the mechanical analysis of fractured rock masses are the smeared crack model,multilaminate model,and anisotropic constitutive model.All the three modeling techniques have found wide use in different applications.In the smeared crack model(Rashid,1968;Rots,1991;De Borst et al.,2004),fractured rock mass deformations are obtained from superposition of rock matrix and fracture deformations.In the multilaminate model(Zienkiewicz and Pande,1977),fracture deformations are added to the intact rock deformation using a viscoplastic formulation.Both methods are generally applicable for relatively simple fracture geometries since local stresses and deformations along fracture planes need to be transformed to the global axes in every time step.Inanisotropicconstitutivemodels,thestrengthand deformability of fractured rock masses are modeled using orthotropic stress-strain relations.Cai and Horii(1992),Oda(1982, 1988),Oda et al.(1993),and Yoshida and Horii(1998)have proposed anisotropic constitutive models that can simulate the effectsoffracturegeometriesusingcompliancetensor formulations.
Despite its simplicity,there are two important issues that have not been completely addressed in the use of ECMs.These issues are related to:(1)the sensitivity of fractured rock mass equivalent continuum properties to fracture geometry and distribution,and(2)the dependency of the fracture geometry and behavior on the length scale and the volume of the rock mass.The sensitivity of the calculated compliance values to fracture geometry is an important issue since fracture geometry and distribution are inherently uncertain and stochastic in nature.The expected length scale dependency of ECMs stems primarily from their formulation,which assumes the existence of an REV.The REV of a fractured rock mass is qualitatively defined as“the smallest volume of the rock mass that is large enough relative to the characteristic scale of the fractures in the volume”.However,there is currently no rigorously quantitative criterion for establishing the REV of a rock mass given the fracture geometry.
The main objective of the research presented in this paper is to critically evaluate the sensitivities of the elastic compliance tensor calculated from Oda's formulation(Oda,1982,1988;Oda et al., 1993)to the variability in fracture distribution and length scale, and to propose a method to quantify these sensitivities.An extensive parametric study is conducted to evaluate the dependence of rock mass compliance on fracture geometrical parameters, and the results are used to establish relationships between fracture geometry variations and rock mass elasticcompliance.The dependence of fractured rock mass elastic compliance on length scale is investigated by calculating equivalent continuum elastic parameters over different sampling volumes of rock mass.To ensure that the results are valid for a wide range of fracture geometries and distributions,a large number of fracture geometry realizations are generated using a combination of Monte Carlo simulation(MCS)and probability distribution functions(PDFs).In addition,to ensure that they are geologically realistic,the fracture geometrical parameters are based on field data obtained from different sources in studies of fracturing from various geological fields.
The focus of the study is on fractured rock mass elastic behavior. Although fractured rock masses are expected to behave nonelastically in general,the study of elastic behavior is important in geophysical characterization where elastic response determines the propagation of seismic waves in fractured rock formations. Future extension of the study will be for nonlinear and elastoplastic behavior of fractured rock masses.Two-dimensional(2D)elastic mechanical behavior is assumed based on the following justifications:(1)fracture data particularly from field studies of rock exposures are predominantly 2D;(2)most rock mechanical models for different applications(e.g.tunneling and excavations, and slope stability)remain 2D;and(3)interpretation and visualization of results in three-dimensional(3D)are difficult,and as a consequence 2D slices are often used to present 3D results.2D results can provide valuable insights that can be extrapolated to 3D problems and be easily interpreted without being bogged down by the need to use complicated visualization techniques.A comprehensive parametric study is conducted using Oda's analytical compliance tensor formulation.Once the fracture geometries and mechanical properties have been collected,Oda's formulation generates crack tensors,which is combined with the fracture stiffness parameters and yields a homogenized elastic compliance tensor for a fractured rock mass.Since the crack tensor formulation has a summation form,all the generated fracture geometries can beeffectivelyconsideredintheentirecompliancetensor calculation.
2.Methodology
Three techniques were used for analyzing the effects of fracture geometrical distribution and length scale on fractured rock mass elastic properties:(1)Oda's elastic compliance tensor formulation;(2)Different PDFs to generate geologically realistic fracture geometries based on in-situ data fromdifferent field studies;and(3)MCS to generate stochastic realizations of fracture geometry and assemble the results of the compliance calculations from different randomly generated realizations.These techniques are described below.
2.1.Elastic compliance tensor for fractured rocks
Oda's compliance tensor formulation(Oda,1982,1988;Oda et al.,1993)suggests a way to express the geometry of complicated fracture systems in tensorial form and to deal with any fractured rock mass as a mechanically equivalent continuum.To apply Oda's compliance tensor formulation for fractured rock masses,the following assumptions are made:(1)The position of a fracture corresponds to its centroid,and the centroids are evenly distributed in the entire rock sample(i.e.fracture locations are assumed to follow a Poisson distribution).(2)The fracture is assumed to have a planar shape.Thus,the surface area of a fracture and volume of fractured rock under plane strain conditions can be converted to length of fracture and cross-sectional area of rock outcrop,respectively,due to the unity width of the sampling area.(3)The mechanical behavior of fractures is assumed to be elastic.(4)Fractures are persistent and there are no stress concentrations at fracture tips and intersections.Based on these assumptions,it is commonly assumed that a fracture plane can be replaced by an elastically equivalent set of parallel plates connected by two elastic springs in normal and shear directions.The formulations of the stiffness of the two springs are discussed below.
On the basis of these assumptions,Oda et al.(1993)has suggested the following equivalent continuum compliance tensor equation for fractured rock masses:
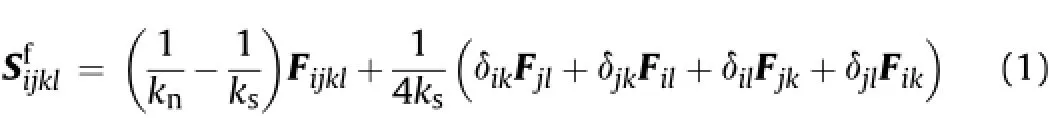

where i,j,k,l=1,2;V is the sample volume;m(V)is the total number of fractures in V;A(k)is the surface area of the k-th fracture; r(k)is the trace length of the k-th fracture;andis the direction cosine of the normal and tangent to the k-th fracture orientation.
The following empirical correlation developed by Barton and Choubey(1977)for fracture shear stiffness is used in Eq.(1):

whereσnis the normal stress on the fracture surface,JRC is the joint roughness coefficient,JCS is the joint compressive strength,andφris the fracture residual friction angle.The estimated stiffness value is converted to the shear fracture stiffness parameter ksby multiplying it with the length of fracture,following Oda et al.(1993).It should be noted that the converted fracture stiffness parameter has the units of force/thickness.Unit thickness is assumed to be perpendicular to the 2D mode,making the stiffness independent of the fracture length.Thus,the value can be substituted in Eq.(1)with dimensionless crack tensors regardless of the effect of fracture length.
Fracture normal stiffness is assumed to be a constant ratio of the shear stiffness(Bandis et al.,1981,1983):
kn=Rks(5)
where R is the ratio between normal and shear fracture stiffnesses. Bandis et al.(1983)have reported that the experimentally determined stiffness ratio R is a function of the normal stress on the fracture surface.According to their experimental results,the ratio decreases exponentially when the normal stress increases,and“that under extremely lowσn(0.02-0.05 MPa),the kn/ksratio attained values ranging from 58 to 130.Within theσnrange of 0.25 MPa to 1 MPa or 2 MPa,anisotropy was markedly reduced”. This reduction is observed until a stiffness ratio of about 10,and there is very little data below this ratio.Thus,it was decided to use this ratio in the paper.Despite the scatter in data,the range of normal stress of 0.25-2 MPa corresponding to a stiffness ratio of 10 is verylowin comparison tothe JCS of the rocks used in the study of Bandis et al.(1983),which varied from 22 MPa to 182 MPa.Since it is necessary for the normal stress to be close to the JCS before asperity damage can occur,normal stress of up to 2 MPa is deemed low enough so as not to change the fracture surface morphology and behavior.Based on this reason,it appears justified to use a stiffness ratio of 10.
2.2.PDFs for stochastic fracture geometry
As can be seen from Eqs.(2)and(3),the main parameters required to generate the crack tensors Fijand Fijklare the fracture lengths and orientations.Fracture locations can also affect rock mass compliance depending on fracture locations relative to the sampling volume,however,these were not accounted for in Oda's tensor formulation.Since natural fracture systems are highly variable,various empirical and stochastic methods have been developed to quantify fracture statistical data.In previous work by other researchers,various PDFs have been utilized to characterize the stochastic variations of the fracture geometries,such as the length, orientation,and location of fractures.Table 1 presents a list of the PDFs most widely used to represent the geometrical distribution of fractures including normal,lognormal,exponential,power law, Fisher,and Poisson distributions.The applicability of each PDF has been studied and confirmed by the accompanying reference(s)in Table 1.

Table 1 Suitability and use of different PDFs to characterize the statistical variation of fracture geometrical parameters.
Because several studies have confirmed its validity,the power law distribution is used to produce random fracture length distributions.Many in-situ fracture length distribution data show the validity of the power law distribution over a wide range of lengthscales,ranging from millimeter to kilometer,and for different host rock types.The wide validity is attributed to the physical basis of the power law distribution,which is based on the self-similarity or fractal behavior of fracturing in a wide range of materials.In this paper,the following inverse cumulative power law function proposed by Min et al.(2004)is used:

where r is the trace length of fracture;D is the fractal dimension;cutminand cutmaxare the minimum and maximum fracture lengths, respectively;and F is the random number between 0 and 1.
Fracture orientations are generated by using Fisher distribution because it has been validated that this distribution can represent fracture orientation in a given fracture set on the basis of statistical measurements in several fields.Fisher distribution(Fisher,1953)has been widely applied to various studies(e.g.Cacas et al.,1990;Lee et al.,1995).Its wide applicability and ease of use make the Fisher distribution the most commonly adopted PDF for fracture orientation.The following inverse cumulative form of the Fisher distribution from Priest(1993)is used in the modeling:

whereθis the direction of the fracture plane measured counterclockwise from the x-axis,and K is the Fisher coefficient.Note that F takes different values in Eqs.(6)and(7).
Finally,as mentioned above,Poisson distribution is employed to yield fracture locations that are uniformly random in distribution. The validity of the Poisson distribution for characterizing fracture locations has been supported by Dershowitz and Einstein(1988), Priest(1993),and Min et al.(2004).
2.3.Monte Carlo simulation(MCS)
MCS is a widely used technique especially for modeling stochastic data that follow statistical distributions.By using MCS,it is possible to stochastically generate representative fractured rock geometries that can reproduce realistic mechanical characteristics as part of an entire fractured rock domain.However,fracture geometry varies according to location,and a single randomly reproduced sample cannot represent the variability of fracture geometry in a given site.Thus,a large number of fracture geometry realizations using MCS are required to cover a wide spectrum of fracture geometries and distributions.The two requirements that are to be satisfied in order to conduct MCS are:(1)a large number of simulations in order to provide a consistent result,and(2)a random number input to generate random numbers or random fields.In this study,MCS is used to generate fracture patterns using the PDFs described above for the fracture geometrical parameters. Once a series of uniform random numbers varying from 0 to 1 is applied as F in the inverse cumulative density functions(Eqs.(6)and(7)),then random fracture geometries that follow each statistical function are generated.Each fracture pattern or realization is then used to calculate the equivalent continuum compliance tensor using Oda's formulation.The minimum number of MCS required to achieve stable fractured rock mass elastic compliance values is discussed in the following section.
3.Details of the analysis
Oda's compliance tensor formulation and the MCS procedure to producerandomfracturegeometriesandpropertieswere programmed in MATLAB(Mathworks,2012).Random fracture geometries were generated following the prescribed PDFs for each fracture parameter.To obtain geologically realistic fracture distributions and geometries,data from various field studies were used to generate the required fracture length data based on the truncated power law distribution.All parameters required to stochastically generate the ECM compliance values were based on the summary of 34 field data sets collected by Bonnet et al.(2001).The data presented by Bonnet et al.(2001)cover a wide range of rock types and field geological history.The required data sets for the simulations consist of the number of fractures,the maximum and minimum fracture lengths,fractal dimension,and the total area of the sampling field.These parameters are summarized in Table 2.
Once the centroids of the fractures have been located,randomly generated fractured rock samples are assembled by applying stochastically produced fracture length and orientation data at the points.Fig.1 shows examples of fractured rock sample realizations from four different in-situ data sets given in Table 2.After the fracture generation process,if some fracture segments lie outside the sampling boundary,the program automatically truncates the extra part of the fracture and excludes that part from the compliance tensor calculations.Based on extensive studies,fracture truncations at the boundaries do not significantly change the original fracture length distribution or the magnitude of the fracture compliance tensor.
After the randomly fractured rock geometry generation is completed,a stochastically generated fracture compliance tensor is superimposed on the homogeneous intact rock compliance:

where Sijklis the fourth-rank compliance tensor.The superscripts c, f,and r indicate a combination of fracture and rock,fracture only, and rock mass only,respectively.The elastic compliance tensor for the intact rock can be written as

where E is the Young's modulus of intact rock,andνis the Poisson's ratio of intact rock.Typical elastic parameters for sandstone,i.e. E=20 GPa andν=0.3,are used in this paper.The equivalent continuum 2D fractured rock compliance is measured as an expanded tensorial calculation as shown in the following equation:

As can be gleaned from Eqs.(2)and(3),since the crack tensors Fijand Fijklare symmetric,the elastic compliance tensor(Eq.(10))should be symmetric as well.The simplest case of material symmetry is obtained when the fractures are orthogonal and parallel to the reference axes.In this case,the compliance tensor is orthotropic requiring only three parameters.In general,in case of random fracture orientations,Eq.(10)yields a fully anisotropic elastic stress-strain relation requiring a total of six components to describe the 2D rock mass elastic compliance tensor.Presenting all these compliance components will be intractable.Instead,theeffects of fracture distribution and length scale will be analyzed and presented using two elastic parameters,which are the equivalent continuum Young's modulus E=σ11/ε11and the equivalent Poisson's ratio ν=-ε22/ε11.These parameters can be obtained from Eq.(10)as follows:
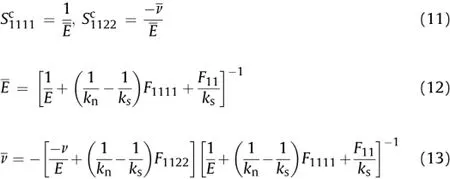
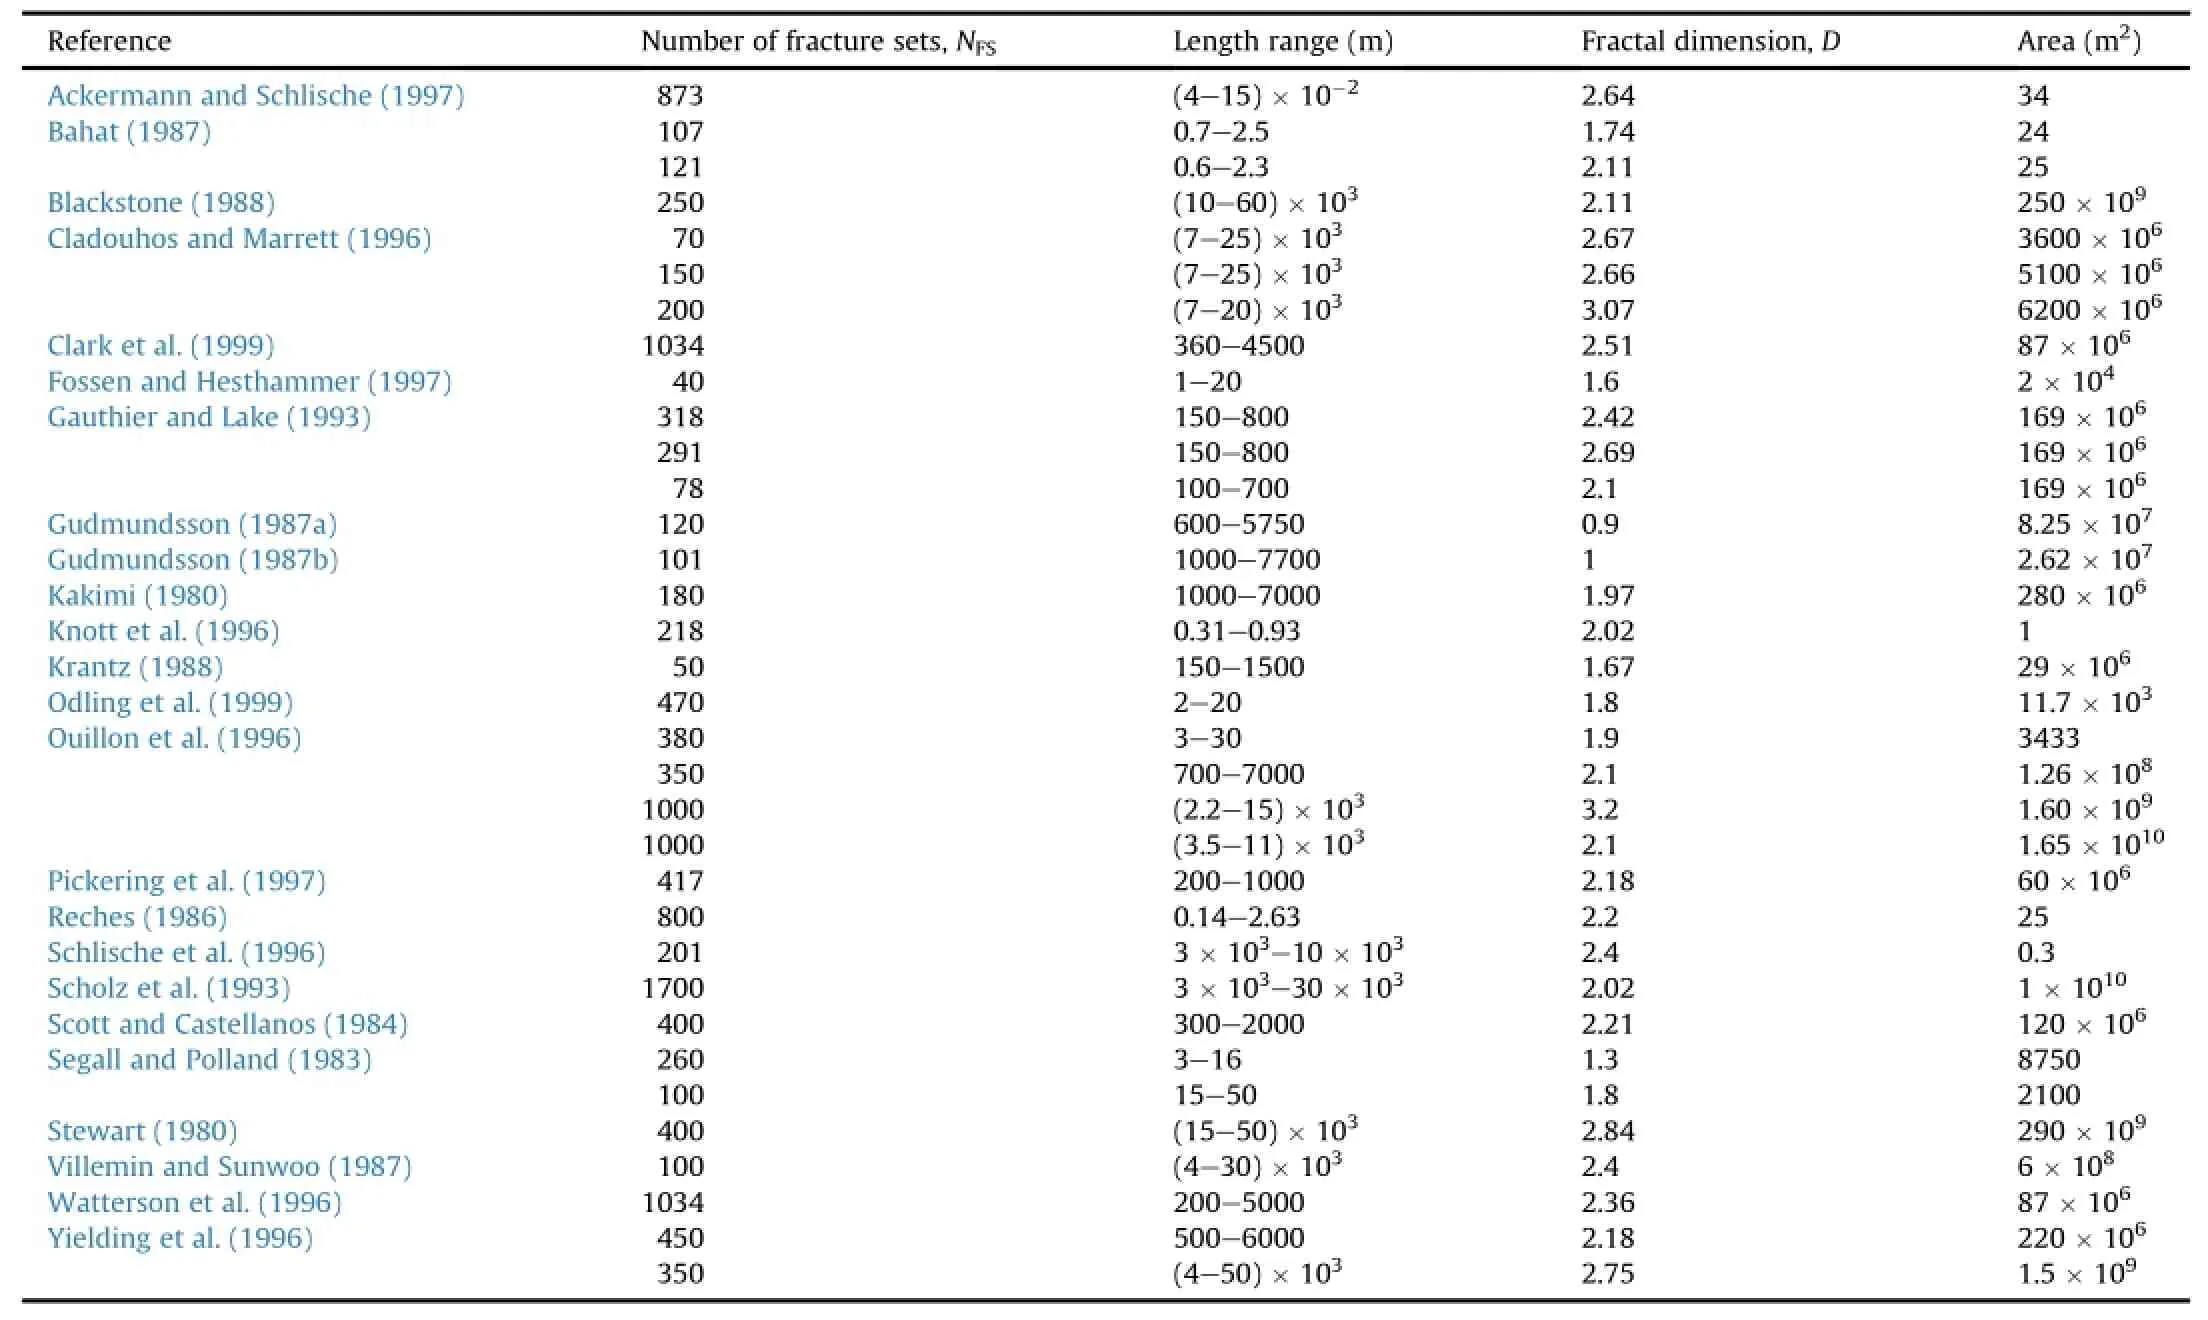
Table 2 Compilation of power law exponents for fracture length distributions(Bonnet et al.,2001).

Fig.1.Fractured rock mass realizations based on field data from:(a)Ackermann and Schlische(1997),(b)Clark et al.(1999),(c)Gauthier and Lake(1993),and(d)Yielding et al.(1996)(all sampling box sizes are 2000 m×2000 m).
It is expected that the dependency of the other equivalent continuum elastic parameters on fracture distribution and length scale will follow the trends forE and ν.The directional dependency of the elastic parameters of fractured rock masses is discussed below.
To study the effects of variation in each fracture parameter, parametric studies were conducted where a range of values for the particular parameter was generated while the other parameters were kept constant.First,random values were developed to define a fracture length distribution using different fractal dimensions D. Since the range of the fractal dimension in Table 2 is between 0.9 and 3.2,three different values(lowest,intermediate and highest)were chosen from the range.In addition,to evaluate the influence of fracture stiffness,different values of the normal stresses in the shear stiffness(Eq.(4))and the normal to shear stiffness ratio R(Eq.(5))were investigated.Finally,to evaluate the influence of fracture orientation,the effects of the number of fracture sets on the compliance was investigated.The total number of fractures was divided into several fracture sets,each with a random meanorientation.Each fracture group has its own variation in orientation based on the characteristics of different Fisher distributions.The Fisher coefficient for each distribution was also selected randomly from a typical range of 20-100 based on data collected by Postet al.(2001).In addition,JRC and JCS values to calculate the fracture stiffness parameters in Eqs.(4)and(5)were selected from the data reported by Barton and Choubey(1977).The shape factors for the PDF generation and the stiffness parameters in each case are summarized in Table 3.In representing the fracture orientation by the Fisher distribution,the mean orientation of all fractures is set to be 0°to facilitate analysis of the direction-dependent elastic response of the fractured rock mass.
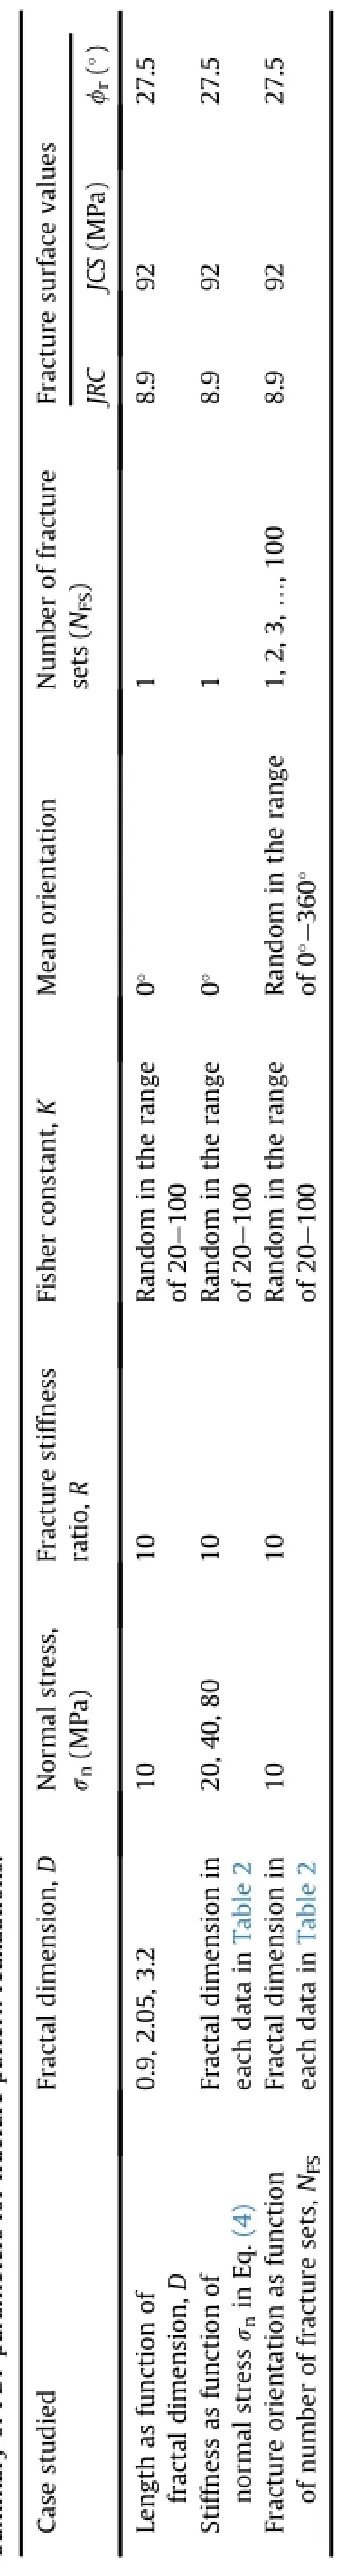
Table 3 Summary of PDF parameters for fracture pattern real
4.Results and discussions
4.1.Minimum number of required MCSs
Before studying the effects of the statistical distributions of different fracture parameters,an analysis was first performed to determine the number of MCS needed to obtain a stable distribution of the elastic compliance values.To quantify the stability of the calculated elastic parameters as a function of number of random realizations,the relative errors(RE)defined below are used:
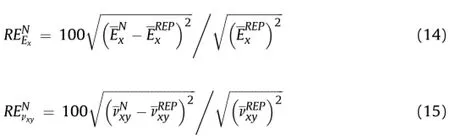
whereExand νxyare the Young's modulus and Poisson's ratio, respectively;and the superscripts N and REP indicate that the elastic parameters are measured from N realizations and from 10,000 realizations,respectively,which can produce sufficiently stable compliance parameters.
Fig.2 shows the variation in RE from the data sets in Table 2, revealing that RE rapidly reduces to small values as the number of simulations increases.Although it is recommended to use as a small RE as possible,it assumed that RE=5%gives an acceptable level of error in the MCS.Therefore,it was confirmed that discretizing the PDFs of the input variables into 2000 discrete data points,corresponding to RE=5%,is sufficient to investigate the effects of stochastic parameters on the compliance values.
4.2.Effect of the fracture PDF on compliance
As mentioned above,depending on the fracture orientations, Oda's compliance tensor(Eq.(1))generallyyields a fullyanisotropic elastic stress-strain relation.Owing to anisotropy,both the Young's modulus and Poisson's ratio are dependent on the direction of loading.To show this directional dependency,the variation in the elastic parameters corresponding to rotation of the local axis or loading direction is also measured in this parametric study.The rotated elastic compliance tensor can be calculated by using the transformation:


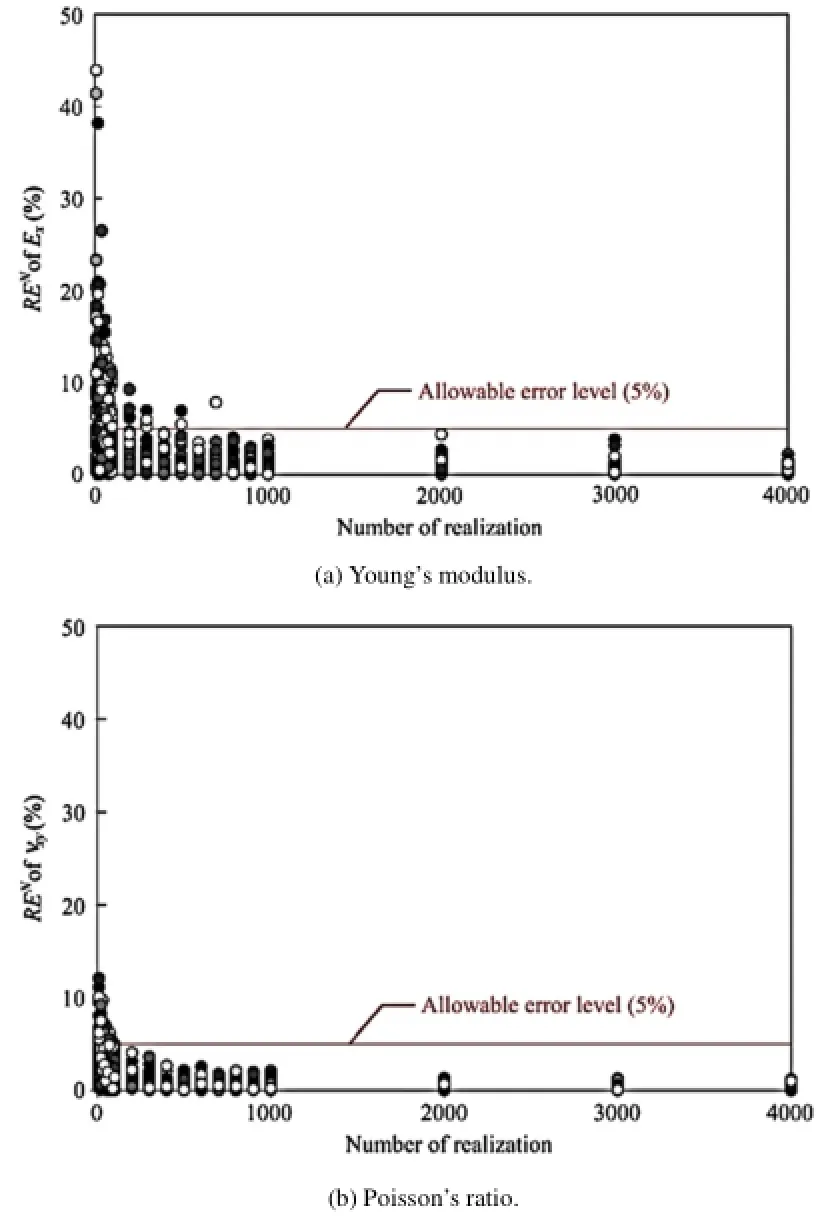
Fig.2.Relative errors of the equivalent continuum elastic parameters from MCS as a function of number of realization.
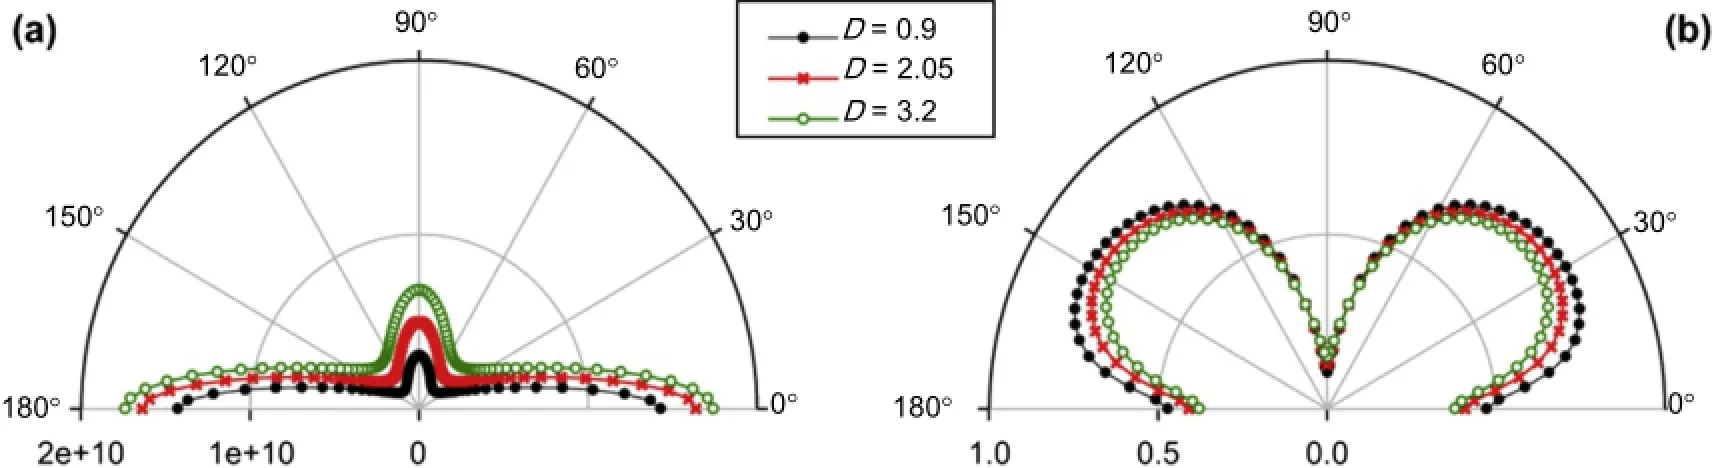
Fig.3.Polar plots of equivalent continuum elastic parameters for three values of fractal dimension D.(a)Young's modulus in Pa,and(b)Poisson's ratio.
Once the oriented compliance tensor is determined,the equivalent Young's modulus and Poisson's ratio along different directions can be calculated from Eqs.(12)and(13),respectively.
The results of the calculation of the equivalent anisotropic compliance tensor are shown using polar plots in Figs.3-5.Due to the symmetry of the elastic compliance tensor(Eq.(10)),only the upper half of the polar plot needs to be shown.The first part of the parametric study evaluates the effects of fracture length distribution while keeping the same fracture stiffness and number of fracture set.The directional elastic parameters are shown in polar plots in Fig.3 in terms of the fractal dimension D.Since the power law distribution has a negative exponent,a higher fractal dimension results in a greater numberof minor fractures and fewerlonger fracture.The fracture length distribution from a higher fractal dimension yields greater equivalent fractured rock stiffness,as shown in Fig.3.In addition,the deviations of the elastic parameters are linearly related to the magnitude of the fractal dimension.
The second part of the parametric study evaluates the effect of different fracture stiffness variations when the same fracture length and orientation distributions are used(Fig.4).The magnitude of stiffness is controlled by varying of fracture normal stress in Eq.(4), ranging from 20 MPa to 80 MPa,which relatively makes the stiffness ratio value R stable(Barton and Choubey,1977).If a greater fracture normal stress is applied in the fracture stiffness calculation,the fracture stiffness parameters increase due to more friction and reduced aperture space.The increased fracture normal stress then results in relatively larger equivalent elasticity of fractured rock masses,corresponding to larger Young's modulus and smaller Poisson's ratio.In addition,it must be noted that there are directional sensitivities for both Young's modulus and Poisson's ratio.A lower normal stress yields strong directional variations and results in a more obvious orthotropic distribution of the elastic parameter distributions.
Fig.4.Polar plots of equivalent continuum elastic parameters for three values of fracture normal stressσn.(a)Young's modulus in Pa,and(b)Poisson's ratio.
Although the normal stress range in this parametric study is limited to produce a stable fracture stiffness ratio R and reasonable fracture surface values such as JRC or JCS in the equivalent compliance calculation,it is expected that the mechanical effect of the fracture system can be ignored when the normal stress isextremely high,because it may result in a low fracture stiffness ratio and a high fracture stiffness,which ultimately yield isotropic and homogeneous mechanical behavior.

Fig.5.Polar plots of equivalent continuum elastic parameters for three different numbers of fracture sets NFS.(a)Young's modulus in Pa,and(b)Poisson's ratio.
The third series of parametric studies involves the effects of fracture orientations and number of fracture sets.In this series,the total number of fractures in a realization is divided into several fracture sets,with fracture orientation in each set following the Fisher distribution.Fig.5 shows how the directional stiffness parameters deviate from an isotropic distribution due to the number of fracture sets NFS.More fracture sets produce a larger variation of the fracture orientations.In turn,a larger variation in fracture orientation leads to increasingly isotropic elastic parameter distributions.The convergence rate decreases exponentially upon increasing the number of fracture sets and the mean orientation. When NFSbecomes large,the ratio between the major and minor principal stiffness parameters tends towards a value of 1.0,which indicates isotropic material parameters.
4.3.Equivalent continuum Poisson's ratio for fractured rock masses
It can be noted from Figs.3-5 that equivalent continuum fractured rock mass Poisson's ratiocalculated from Oda's compliance tensor can be larger than 0.5.It is essential to understand the reason for the high values.To do this,Eq.(13)is normalized with respect to ksto give:
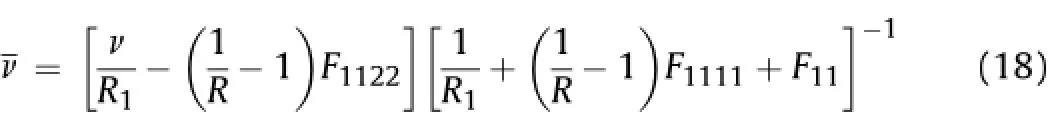
where R1=E/ksis the ratio of the intact rock Young's modulus to the fracture shear stiffness.The above equation was plotted for two cases:(a)an orthogonal fracture system with two sets of fractures aligned with the coordinate axes,and(b)an orthogonal fracture system with two sets of fractures oriented at 45°from the coordinate axes.According to Oda(1986),for case(a)F11=0.5,F1111=0.5 and F1122=0,and for case(b)F11=0.5,F1111=0.25 and F1122=0.25. Intact rock Poisson's ratio is set toν=0.2.The equivalent continuum Poisson's ratios for the two cases are plotted in Fig.6 for a range of R and R1values.In general,fracture normal stiffness is larger than the fracture shear stiffness,and as noted above,R varies from 1 to about 10 for stresses low enough to avoid asperity damage,so values ofare plotted against this range of R values.
As can be seen for case(a),the equivalent continuum Poisson's ratio is always lower than the intact rock Poisson's ratio ofν=0.2 for all values of R and R1.Thus,Poisson's ratio is below 0.5 for the principal directions of the elastic compliance tensor,which in the case of orthotropic elasticity are parallel and perpendicular to the directions of orthogonal fracture systems.This can also be seen in Figs.3-5,where the equivalent continuum Poisson's ratio is lower than 0.5 for directions close to 0°,90°,180°and 270°from the coordinate axes.It is clear that Oda's compliance tensor satisfies the criterion of=0.5 for orthotropic elasticity.
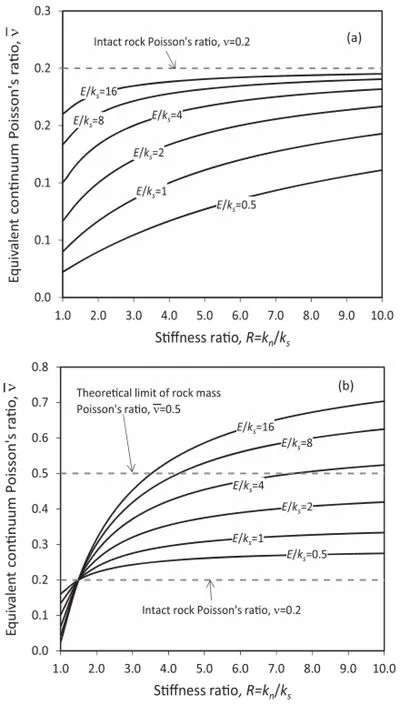
Fig.6.Equivalent continuum Poisson's ratios for fractured rock mass calculated from Oda's compliance tensor as function of R=kn/ksand R1=E/ks.(a)Orthogonal fracture system with two sets of fractures parallel and perpendicular to the coordinate axes.(b)Orthogonal fracture system with two sets of fractures oriented at 45°from the coordinate axes.
For case(b),the equivalent continuum Poisson's ratiois generally larger than the intact rock Poisson's ratio ofν=0.2 except for R≤1.5 where<ν.The equivalent Poisson's ratioincreases as both R1and R increase,and exceeds the value of 0.5 particularly for R1>4.With increasing R1,the fracture shear deformabilityincreases in comparison to intact rock deformability.Similarly,with increasing R,fracture shear deformability increases in comparison to fracture normal deformability.It appears that increasing fracture shear deformability translates to increase in equivalent continuum Poisson's ratio.For fully anisotropic materials,it is known that Poisson's ratio can exceed 0.5 for some loading directions,and such values havebeen observedin natural and engineered materials(e.g. G1adyszewska,2012).Poisson's ratio values above 0.5 have also been obtained from DEM simulations by Min and Jing(2004),and Bidgoli and Jing(2014).
4.4.Scale effects on fractured rock mass compliance
To investigate the length scale effects on the equivalent continuum elasticity of fractured rock mass and the validity of the existence of an REV,two parameters are introduced to characterize the sampling volume and the degree of fracturing in a rock mass.The first parameter is a relative measure of the sampling volume,which is specified by a parameter called the side length ratio(SLR).This parameter was first introduced by Min(2004), and is equal to the length of a side of the square sampling area divided by the length of the region of interest,also assumed to be square:

The mean values of Young's modulus and Poisson's ratio are measured for different sampling box sizes,then the sampling box size is gradually decreased in each step.Fig.7 shows an example that illustrates the variation of the mean values of the equivalent continuum Young's modulus and Poisson's ratio as a function of SLR using the field data collected by Gauthier and Lake(1993).When SLR is relatively large,the mean values remain relatively constant and behaves as a continuum independent of the size of the sampling box.This observation is consistent with the formal definition of the REV as the“volumetric dimensions of the scale in which the continuum approach can be used”.For SLR less than a certain threshold value,the mean elastic parameter values start to oscillate and drastically increase,and finally reach the host rock's properties, because the volume scale is too small to contain the proper fracture length.The REV can now be simply defined as the value of the SLR where the equivalent continuum elastic parameters start to significantly deviate from their asymptotic constant values.Similar results were obtained for all the simulations using the different field data sets listed in Table 2.
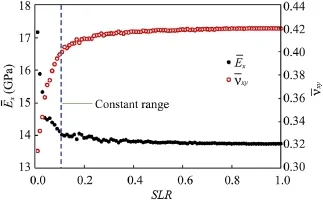
Fig.7.Equivalent Young's modulus and Poisson's ratio as a function of SLR from field data collected by Gauthier and Lake(1993).
Additional analyses were performed in order to quantify the variation of the equivalent continuum elastic parameters from their asymptotically constant values.The deviations of the values of the equivalent continuum elastic parameters from their asymptotic values are quantified by the following RE values:
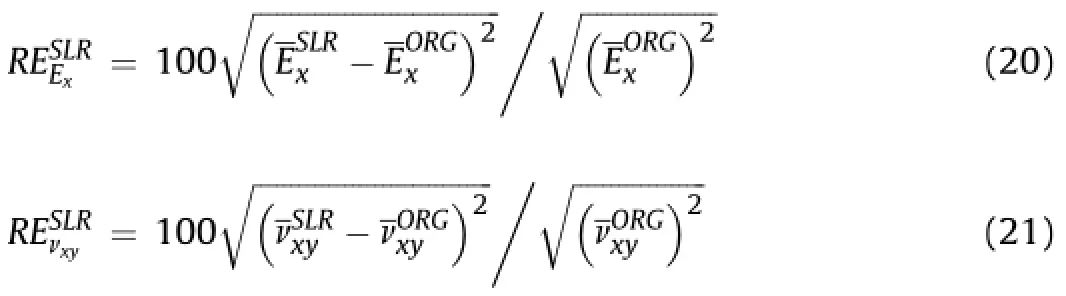
where the superscripts SLR and ORG indicate the elastic parameters measured when SLR<1 and SLR=1,respectively.By using these additional data processing calculations,it is possible to standardize the threshold to determine the data oscillation.As an example, Fig.8 shows the RE values as a function of SLR for both the equivalent continuum Young's modulus and Poisson's ratio.It is assumed that the variation of the elastic parameter values is no longer constant when the errorlevel is higher than 5%relative tothe stable value from the original volume of fractured rock,which is indicated by the blue line in Fig.8.Thus,the lowest SLR in the constant RE range can be used to calculate the REV of the sample as

where Area is the original rock outcrop area shown in Tables 2 and 4.
The second parameter used to investigate the effects of length scale on the equivalent continuum compliance of the fractured rock mass and the validity of the use of an REV is the fracture length scale parameter MOV.This parameter is defined as the maximum length of fracture over the total area of the region of interest:
MOV=rmax/Area(23)
where rmaxis the maximum fracture length(m)in an area.
Table 4 lists the MOV values for the different sets of in-situ fracture data given in Table 2.As can be seen,most field sites have MOV magnitudes in the range of 10-7-1 m-1.

Fig.8.RE values for Young's modulus and Poisson's ratio as a function of SLR from field data collected by Fossen and Hesthammer(1997).
To recapitulate,the results from an extensive stochastic simulation of the compliance of fractured rock masses indicated that the REV can be formally defined as the value of the SLR below which the RE of the mean Young's modulus or Poisson's ratio starts to exceed the threshold value.Using this definition,REV values were determined for all the different cases used in the stochasticsimulations and are plotted against MOV in Fig.9.The plot shows that a linear relationship exists between the logarithmic values of MOV and REV.More importantly,the plotapplies for awide rangeof MOV values ranging from 10-7m-1to 1 m-1,and REVs from 10-3m2to 1012m2.If the MOV value can be calculated from a rock outcrop,then REV can be easily calculated using Fig.9.

Table 4 Compilation of MOV and fracture length data.
The best-fit linear relationship between the logarithmic values of MOV and REV shown in Fig.9 is given as
REV=0.06MOV-1.79(24)
where MOV is expressed in m-1and REV in m2.R2value for Eq.(24)is 0.81.For guidance in determining MOV,typical values are given in Table 4 for different sites.REV values obtained from Eq.(24)can be employed to decide on the size of elements,relative to the fracture length scale,that can be used in finite element or finite difference mechanical simulations for fractured rock masses.

Fig.9.REV as function of MOV.
It should be noted in Fig.9 that the value of REV can be as large as 1000 m2.This size of REV is impossible to be used in numerical modeling.In fact,for most cases studied and shown in Fig.9,the use of equivalent continuum modeling and REV appears to be not viable.The required large REV sizes are contrary to the small discretization(i.e.size of elements)needed to achieve accurate results in numerical methods such as the finite element or finite difference methods.Therefore,it can be concluded that for very large REV,the equivalent approach is not valid,and other approaches(e.g.DEM or DFN)need to be used.For problems which involve a range of large and small REVs,an approach combining DFN/DEM techniques with equivalent continuum models have to be used.Alternatively,scaling laws must be developed to ensure that the calculated parameters from equivalent continuum models are independent of the REV or the discretization used in numerical modeling.
5.Conclusions
This paper extensively evaluated the sensitivities of the elastic parameters calculated from an equivalent continuum model based on Oda's compliance tensor to quantify the effects of fracture distribution and length scale on the compliance of fractured rock masses.A parametric study covering a wide range of field data was conducted to evaluate the dependence of rock mass elastic compliance on fracture geometrical parameters and sampling volume.A large number of fracture geometry realizations were generated using MCS based on different PDFs to reflect thevariability of fracture geometry.Fracture geometrical parameters were based on field data obtained from different sources in studies of fracturing from varied geological sites.The results were used to establish relationships between variations in fracture geometry, length scale,and rock mass stiffness.The following conclusions are drawn from the study:
(1)A high fractal dimension in the power law fracture length distribution results in higher Young's modulus and smaller Poisson's ratio distributions,which indicates higher equivalent continuum stiffness.The deviation of the elastic parameters is linearly related to the magnitude of fractal dimension.
(2)A high fracture normal stress produces higher fracture stiffness parameters,and ultimately results in larger Young's modulus and smaller Poisson's ratio.Owing to directional sensitivities for both Young's modulus and Poisson's ratio,a lower normal stress yields strong directional variations and produces clear anisotropy of the elastic parameter distributions.When the normal stress is extremely high,the mechanical effect of the fracture system may be ignored because of the low fracture stiffness ratio with R approaching 1 and high fracture stiffnesses(not exceeding intact rock stiffness)corresponding to the intact rock mass mechanical behavior.
(3)Increasing the number of fracture sets results in increasingly isotropic elastic parameter distributions.The convergence rate decreases exponentially when the number of fracture sets is relatively large.
(4)Using the side length ratio SLR,which is equal to the length of the side of the squaresampling area divided bythe length of the square region of interest,it was found that the mean values of the equivalent continuum Young's modulus and Poisson's ratio are independent of SLR above a certain threshold of SLR value and oscillate below this threshold.
(5)REV was defined by the SLR below which both the mean equivalent continuum Young's modulus and Poisson's ratio values start to oscillate.Above this SLR value,the mean elastic stiffness parameters remain relatively constant and independent of the size of the sampling volume.In order to suggest a quantified oscillation value in a general manner,a relative error calculation was applied.
(6)A linear relationship was obtained between the logarithmic values of MOV,which is the maximum length of fracture over the total sampling volume,and the REV.The relationship between REV and MOV can be used as a guideline to determine the REV and the size of elements that can be applied in numerical simulations of mechanical behavior of fractured rock masses based on the degree of fracturing.
(7)Sizes of the REV obtained from the study can be as large as 1000 m2,which are impossible to be used in numerical modeling usingthefiniteelementand finite difference methods.These methods require small elements to achieve reliable results.Thus,other approaches(e.g.DEM or DFN)need to be used potentially in combination with equivalent continuum models in case of large REV sizes.Alternatively, scaling laws must be developed to ensure that the calculated parameters from equivalent continuum models are scale independent.
Conflict of interest
The authors wish to confirm that there are no known conflicts of interest associated with this publication and there has been no significant financial support for this work that could have influenced its outcome.
Acknowledgments
This work is supported as part of the project funded by the U.S. Department of Energy under Grant No.DE-FE0002058.This support is gratefully acknowledged.
References
Ackermann RV,Schlische RW.Anticlustering of small normal faults around larger faults.Geology 1997;25(12):1127-30.
Baecher GB,Lanney NA,Einstein HH.Statistical description of rock properties and sampling.In:Proceedings of the 18th US Symposium on Rock Mechanics. Colorado School of Mines;1977.p.5c1.1-5c1.8.
Baecher GB,Lanney NA.Trace length biases in joint surveys.In:Proceedings of the 19th US Symposium on Rock Mechanics.Mackay School of Mines;1978.p.56-65.
Bahat D.Jointing and fracture interactions in middle Eocene chalks near Beer-Sheva,Israel.Techtonophysics 1987;136(3-4):299-321.
Bandis SC,Lumsden AC,Barton NR.Experimental studies of scale effects on the shear behavior of rock joints.International Journal of Rock Mechanics and Mining Sciences 1981;18(1):1-21.
Bandis SC,Lumsden AC,Barton NR.Fundamentals of rock joint deformation.International Journal of Rock Mechanics,Mining Sciences&Geomechanics Abstracts 1983;20(6):249-68.
Barton NR,Choubey V.The shear strength of rock joint in theory and practice.Rock Mechanics 1977;10(1-2):1-54.
Bidgoli MN,Jing L.Anisotropy of strength and deformability of fractured rocks. Journal of Rock Mechanics and Geotechnical Engineering 2014;6(2):156-64.
Blackstone DL.Traveler's guide to the geology of Wyoming.2nd ed.Laramie,USA:Bulletin of Geological Survey of Wyoming;1988.
Bonnet E,Bour O,Odling NE,Davy P,Main I,Cowie P,Berkowitz B.Scaling of fracture systems in geological media.Reviews of Geophysics 2001;39(3):347-83.
Cacas M,Ledoux E,De Marsily G,Barbreau A,Calmels P,Gaillard B,Margritta R. Modeling fracture flow with a stochastic discrete fracture network:Calibration and validation:2.The transport model.Water Resources Research 1990;26(3):491-500.
Cai M,Horii H.A constitutive model of highly jointed rock masses.Mechanics of Materials 1992;13(3):217-46.
Call RD,Savely JP,Nicholas DE.Estimation of joint set characteristics from surface mapping data.In:Monograph on rock mechanics applications in mining. Englewood:AIME;1976.p.65-73.
Cladouhos TT,Marrett R.Are fault growth and linkage models consistent with power-law distributions of fault lengths?Journal of Structural Geology 1996;18(2-3):281-93.
Clark RM,Cox SJD,Laslett GM.Generalizations of power law distributions applicable to sampled fault trace lengths:model choice,parameter estimation and caveats.Geophysical Journal International 1999;136(2):357-72.
De Borst R,Remmers JJC,Needleman A,Abellan M.Discrete vs.smeared crack models for concrete fracture:bridging the gap.International Journal for Numerical and Analytical Methods in Geomechanics 2004;28(7-8):583-607.
De Dreuzy J,Davy P,Bour O.Hydraulic properties of two-dimensional random fracture networks following power law distributions of length and aperture. Water Resources Research 2002;38(12):12-1-12-9.
Dershowitz WS,Einstein HH.Characterizing rock joint geometry with joint system models.Rock Mechanics and Rock Engineering 1988;21(1):21-51.
Eshelby JD.The determination of the elastic field of an ellipsoidal inclusion,and related problems.Proceedings of the Royal Society A:Mathematical,Physical and Engineering Science 1957;241(1226):376-96.
Esmaieli K,Hadjigeorgiou J,Grenon M.Capturing the complete stress-strain behaviour of jointed rock using a numerical approach.International Journal for Numerical and Analytical Methods in Geomechanics 2015;39(10):1027-44.
Fisher R.Dispersion on a sphere.Proceedings of the Royal Society A:Mathematical, Physical and Engineering Science 1953;217(1130):295-305.
Fossen H,Hesthammer J.Geometric analysis and scaling relations of deformation bands in porous sandstone.Journal of Structural Geology 1997;19(12):1479-93.
Gauthier BDM,Lake SD.Probabilistic modeling of faults below the limit of seismic resolution in Pelican Field,North Sea,offshore United Kingdom.AAPG Bulletin 1993;77(5):761-77.
G1adyszewska B.Poisson's ratio of anisotropic biological media.Teka.Commission of Motorization and Energetics in Agriculture 2012;12(2):53-7.
Gudmundsson A.Geometry,formation,and development of tectonics fractures on the Reykjanes Peninsula,southwest Iceland.Tectonophysics 1987a;139(3-4):295-308.
Gudmundsson A.Tectonics of the Thingvellir fissure swarm,SW Iceland.Journal of Structural Geology 1987b;9(1):61-9.
Guvanasen V,Chan T.A three-dimensional numerical model for thermo-hydromechanical deformation with hysteresis in a fractured rock mass.International Journal of Rock Mechanics and Mining Sciences 2000;37(1-2):89-106.
Heffer K,Bevan T.Scaling relationships in natural fractures:data,theory,and application.In:Proceedings of the 2nd European Petroleum Conference. Richardson,USA:Society of Petroleum Engineers;1990.p.367-76.
Kakimi T.Magnitude-frequency relation for displacement of minor faults and its significance in crustal deformation.Bulletin of the Geological Survey of Japan 1980;31:467-87.
Knott SD,Beach A,Brockbank PJ,Lawson Brown J,McCallum JE,Welbon AI.Spatial and mechanical controls on normal fault populations.Journal of Structural Geology 1996;18(2-3):359-72.
Krantz RW.Multiple fault sets and three-dimensional strain:theory and application.Journal of Structural Geology 1988;10(3):225-37.
Lee CH,Deng BW,Chang JL.A continuum approach for estimating permeability in naturally fractured rocks.Engineering Geology 1995;39(1-2):71-85.
Long JCS,Remer JS,Wilson CR,Witherspoon PA.Porous media equivalents for networks of discontinuous fractures.Water Resources Research 1982;18(3):645-58.
Mathworks.MATLAB(matrix laboratory)-User's manual,version 7.14.2012.
McMahon BK.A statistical method for the design of rock slopes.In:Proceedings of the 1st Australia-New Zealand Conference on Geomechanics.Melbourne;1971. p.314-21.
Min KB.Fractured rock masses as equivalent continua-a numerical study.PhD Thesis.Stockholm:KTH;2004.
Min KB,Jing L.Stress-dependent mechanical properties and bounds of Poisson's ratio for fractured rock masses investigated by a DFN-DEM technique. International Journal of Rock Mechanics and Mining Sciences 2004;41(3):390-5.
Min KB,Rutqvist J,Tsang CF,Jing L.Stress-dependent permeability of fractured rock masses:a numerical study.International Journal of Rock Mechanics and Mining Sciences 2004;41(7):1191-210.
Oda M,Yamabe T,Ishizuka Y,Kumasaka H,Tada H,Kimura K.Elastic stress and strain in jointed rock masses by means of crack tensor analysis.Rock Mechanics and Rock Engineering 1993;26(2):89-112.
Oda M.An experimental study of the elasticity of Mylonite rock with random cracks.International Journal of Rock Mechanics and Mining Sciences&Geomechanics Abstracts 1988;25(2):59-69.
Oda M.Fabric tensor for discontinuous geological materials.Soils and Foundations 1982;22(4):96-108.
Oda M.Stereology on crack geometry.In:Research of pattern Formation.Tokyo, Japan:KTK Scientific Publishers;1986.p.517-53.
Odling NE,Gillespie P,Bourgine B,Castaing C,Chiles JP,Christensen NP,Fillion E, Genter A,Olsen C,Thrane L,Trice R,Aarseth E,Walsh JJ,Watterson J.Variations in fracture system geometry and their implications for fluid flow in fractures hydrocarbon reservoirs.Petroleum Geoscience 1999;5(4):373-84.
Ouillon G,Casting C,Sornette D.Hierarchical geometry of faulting.Journal of Geophysical Research 1996;101(B3):5477-87.
Park YJ,De Dreuzy JR,Lee KK,Berkowitz B.Transport and intersection mixing in random fracture networks with power law length distributions.Water Resources Research 2001;37(10):2493-501.
Pickering G,Peacock DCP,Sanderson DJ,Bull JM.Modeling tip zones to predict the throw and length characteristics of faults.AAPG Bulletin 1997;81(1):82-99.
Post RM,Kemeny JM,Murphy R.Image processing for automatic extraction of rock joint orientation data from digital images.In:Proceedings of the 38th US Rock Mechanics Symposium,Washington,DC;2001.p.877-84.
Priest SD.Discontinuity analysis for rock engineering.London-New York:Chapman &Hall;1993.
Rashid YR.Analysis of prestressed concrete pressure vessels.Nuclear Engineering Design 1968;7:334-44.
Reches Z.Network of shear faults in the field and in experiment.In:Englman R, Jaeger Z,editors.Fragmentation,form and flow in fractured media.Annals of the Israel Physical Society;1986.p.42-51.
Robertson A.The interpretation of geological factors for use in slope theory.In:Proceedings of Symposium on the Theoretical Background to the Planning of Open Pit Mines with Special Reference to Slope Stability;1970.p.55-71.
Rots JG.Smeared and discrete representations of localized fracture.International Journal of Fracture 1991;51(1):45-59.
Schlische RW,Young SS,Ackermann RV,Gupta A.Geometry and scaling relations of a population of very small rift-related normal faults.Geology 1996;24(8):683-6.
Scholz CH,Dawers NH,Yu JZ,Anders MH,Cowie PA.Fault growth and fault scaling laws:preliminary results.Journal of Geophysical Research 1993;98(B12):21951-61.
Scott RB,Castellanos M.Stratigraphic and structural relations of volcanic rocks in drill holes USW GU-3 and USW G-3,Yucca Mountain,Nye County,Nevada. Open-File Report.US Geological Survey 1984:84-491.
Segall P,Polland DD.Joint formation in granitic rock of the Sierra Nevada.Geological Society of America Bulletin 1983;94(5):563-75.
Stewart JH.Geology of Nevada:a discussion to accompany the geologic map of Nevada.In:Special Publication of Nevada Bureau of Mines and Geologyvol.4;1980.p.132.
Villemin T,Sunwoo C.Distribution logarithmique self-similaire des rejets et longueurs de failles:exemple du Bassin Houiller Lorrain.Comptes Rendus de l'Académie des Sciences Série 2,Gauthier-Villars 1987;305(16):1309-12(in French).
Watterson J,Walsh JJ,Gillespie PA,Easton S.Scaling systematics of fault sizes on a large-scale range fault map.Journal of Structural Geology 1996;18(2-3):199-214.
Yielding G,Needham T,Jones H.Sampling of fault populations using sub-surface data:a review.Journal of Structural Geology 1996;18(2-3):135-46.
Yoshida H,Horii H.Micro-mechanics based continuum analysis for the excavation of large-scale underground cavern.In:Proceedings of the SPE/ISRM Rock Mechanics in Petroleum Engineering Conference,Trondheim,Norway;1998. p.209-18.
Zienkiewicz OC,Pande GN.Time dependent multi-laminate model of rocks-a numerical study of deformation and failure of rock masses.International Journal for Numerical and Analytical Methods in Geomechanics 1977;1(3):219-47.

Dr.Marte Gutierrez is currently Professor and Chair of the Department of Civil Infrastructure and Environmental Engineering at Khalifa University.Previously,he was the James R.Paden Distinguished Professor at the Department of Civil and Environmental Engineering,Colorado School of Mines(CSM).Prior to joining CSM in 2008,he was Postdoctoral Fellow,Senior Engineer and Program Leader at the Norwegian Geotechnical Institute,and Associate Professor/Professor at Virginia Tech.He has held visiting professorship and researcher positions in China,Chile,France, Japan,Korea and the UAE.He is a member of the Editorial Board of four International Journals.He was the recipient of the 2011 Geotechnical Research Medal from UK's Institute of Civil Engineers.Dr.Gutierrez's main research interests are in Geomechanics,and Energy and Environmental Sustainability.

Dong-Joon Youn is currently a Ph.D.student at CSM.He received his BS and MS degrees from Konkuk University in South Korea,and he was formerly research assistant at Korea Institute of Construction Technology.
23 March 2015
*Corresponding author.Tel.:+1 303 273 3507.
E-mail address:mgutierr@mines.edu(M.Gutierrez).
Peer review under responsibility of Institute of Rock and Soil Mechanics, Chinese Academy of Sciences.
1674-7755©2015 Institute of Rock and Soil Mechanics,Chinese Academy of Sciences.Production and hosting by Elsevier B.V.All rights reserved.
http://dx.doi.org/10.1016/j.jrmge.2015.07.006
杂志排行

Journal of Rock Mechanics and Geotechnical Engineering的其它文章
- Characterizing the influence of stress-induced microcracks on the laboratory strength and fracture development in brittle rocks using a finite-discrete element method-micro discrete fracture network FDEM-μDFN approach
- Shear strength behavior of geotextile/geomembrane interfaces Belén M.Bacasa,*,Jorge Cañizalb,Heinz Konietzkyc
- Engineering properties for high kitchen waste content municipal solid waste
- Effects of spatial variation in cohesion over the concrete-rock interface on dam sliding stability
- Evaluation of the effect of sodium silicate addition to mine backfill, Gelfill-Part 2:Effects of mixing time and curing temperature
- Studies on the key parameters in segmental lining design