Li3V2(PO4)3/C正极材料在不同电压区间的电化学行为及容量衰减原因
2015-08-15钟艳君欧庆祝钟本和郭孝东王辛龙四川大学材料科学与工程学院成都60065四川大学化学工程学院成都60065
唐 艳 钟艳君 欧庆祝 刘 恒 钟本和 郭孝东 王辛龙(四川大学材料科学与工程学院,成都60065;四川大学化学工程学院,成都60065)
Li3V2(PO4)3/C正极材料在不同电压区间的电化学行为及容量衰减原因
唐艳1,2钟艳君2欧庆祝2刘恒1,*钟本和2郭孝东2王辛龙2,*
(1四川大学材料科学与工程学院,成都610065;2四川大学化学工程学院,成都610065)
采用溶胶-凝胶法制备锂离子电池正极材料Li3V2(PO4)3/C.通过恒电流充放电测试、循环伏安(CV)、电化学阻抗谱(EIS)等方法,研究了Li3V2(PO4)3/C在不同电压区间的电化学行为(3.0-4.5 V和3.0-4.8 V).结果表明,3.0-4.8 V电压区间的循环性能和倍率性能均不及3.0-4.5 V电压区间的.3.0-4.5 V区间0.1C(1C=150 mA·g-1)倍率首次放电比容量为127.0 mAh·g-1,循环50次后容量保持率为99.5%,而3.0-4.8 V区间的分别为168.2 mAh·g-1和78.5%.经过高倍率测试后再回到0.1C倍率充放电,3.0-4.5 V和3.0-4.8 V的放电比容量分别为初始0.1C倍率的99.0%和80.7%.经过3.0-4.8 V电压区间测试后,少部分第三个锂离子能够在低于4.5 V的电压脱出,使3.0-4.5 V电压区间的放电比容量提升了7.4%.CV结果表明3.0-4.8 V区间的容量损失主要表现为第一个锂离子的不可逆损失.极片的X射线衍射(XRD)和X射线光电子能谱(XPS)分析测试结果表明经过3.0-4.8 V测试后,Li3V2(PO4)3的结构发生了轻微的改变.电感耦合等离子体(ICP)测试结果表明循环后的电解液中含有少量的V.结构变形和V溶解可能是Li3V2(PO4)3在3.0-4.8 V区间容量衰减的主要原因.
Li3V2(PO4)3/C;电化学行为;电压区间;容量衰减
www.whxb.pku.edu.cn
1 lntroduction
Lithium-ion batteries are considered the most efficient energy storage systems owing to their high power density and long cycle life.The cathode material plays an important role in lithium-ion batteries,because it mainly decides the cost and performance of lithium-ion batteries.In particular,recent interest has been focused on lithium transition metal phosphates such as LiFePO4and Li3V2(PO4)3due to low cost,good thermal stability,environmental friendliness,and long cycle life.1-6Compared with one-dimensional(1D)channels in LiFePO4,the Li3V2(PO4)3crystal is in a structure similar to the open framework NASICON structure with corner-shared VO6octahedra and PO4tetrahedra forming large three-dimensional(3D)channels for fast ionic conductivity.7Monoclinic Li3V2(PO4)3containing three mobile lithium ions can extract and insert two lithium ions reversibly between 3.0 and 4.5 V based on the V3+/V4+redox couple with a capacity of 133 mAh· g-1.8When charged to 4.8 V,all the three lithium ions can be removed to form a mixed V4+/V5+state getting a total capacity of 197 mAh·g-1.9,10
It is found that the electrochemical performance of Li3V2(PO4)3in different voltage ranges is in great difference.The cycling performance and rate capability are better in the voltage ranges of 3.0-4.3/4.5 V than those in 3.0-4.8 V range.7,11-16Although many strategies have been employed to improve the electrochemical performance of Li3V2(PO4)3in voltage range of 3.0-4.8 V,significant fading of capacity still exists as the increased charge/ discharge rate or cycle number.17-19Jiang et al.7synthesized graphene-modified Li3V2(PO4)3via a spray-drying process.The capacity retention was 98.43%of the initial capacity at 0.1C rate after 100 cycles in the potential range of 3.0-4.3 V,but only 84.4%in 3.0-4.8 V.Qiao et al.12synthesized Li3V2(PO4)3via a hydrothermal synthesis,it exhibited capacity ranges of 130.8 mAh· g-1at 0.5C rate to 101.4 mAh·g-1at 10C rate between 3.0 and 4.3 V,and 156.6 to 106.6 mAh·g-1between 3.0 and 4.8 V,the capacity retentions were 77.52%and 68.07%,respectively.Yin et al.20has found that the volume of reinserted sample R-Li1V2(PO4)3is smaller to deinserted sample D-Li1V2(PO4)3,indicating that the volume contracted after the extraction and insertion of the third lithium ion,which may have influence on the electrochemical performance.Besides,the dissolution of cathode active material,electrolyte decompose,and the formation of solid electrolyte interface(SEI)film may also do bad to the electrochemical performance under long-time cycle.21
Therefore,the essential reasons for the capacity fading in voltage range of 3.0-4.8 V need to be studied deeply.Based on this,in this paper,the electrochemical performance of different voltage ranges and the related structure of the cycled electrodes were systematically investigated and thus put forward the reasons of the capacity fading in a wider charge and discharge voltage range.
2 Experimental
2.1Material synthesis
The Li3V2(PO4)3/C cathode material was prepared via a sol-gel method as described below.LiOH·H2O(99%),NH4VO3(99%),H3PO4(85%),and citric acid(99.5%)with molar ratios of 3:2:3:1.5 were used as raw materials.The starting materials and 100 mL deionized water were mixed together at 80°C under continuous stirring for 2 h.Then the excess solvent was removed byvacuum distillation,the resulting gel precursor was dried in a vacuum oven at 90°C for 15 h.Finally,the precursor was decomposed in tube furnace at 350°C for 4 h,then heated at 700°C for 6 h under flowing argon to obtain the Li3V2(PO4)3/C powders.
2.2Materials characterization
The purity and crystalline structure of the sample were analyzed by X-ray diffraction(XRD,D/max-rB,Rigaku)at the 2θ range of 10°-70°using Cu Kαradiation.The particle morphology and particle size of the sample were observed by scanning electron microscopy(SEM,SPA400 Seiko Instruments).X-ray photoelectron spectroscopy(XPS,Quantum 2000)was employed to measure the chemical or electronic state of each element,and Al Kα(1486.6 eV)was the photon energy of choice.The V element in the electrolyte was quantified by ICAP-55 inductively coupled plasma-mass spectroscopy(ICP-MS,Nippon Jarrell Ash Co.).
2.3Electrochemical measurements
The cathode was fabricated as follows:80%(w)active material,13%(w)acetylene black(conducting additive),and 7%(w)poly(vinylidene fluoride)(PVDF,binder)were mixed in an appropriate amount of N-methyl-2-pyrrolidine to form slurry.Then it was pasted onto anAl foil and dried at 100°C in vacuum for 15 h,follow by cutting into electrode slices.The cells were assembled by stacking a cathode electrode,separator(Celgard 2400),lithium foil as anode and electrolyte containing 1 mol·L-1LiPF6solution in ethylene carbonate(EC)and diethyl carbonate(DMC)(1:1 in volume).Galvanostatic charge/discharge tests were operated in voltage ranges of 3.0-4.3 V,3.0-4.5 V,and 3.0-4.8 V at room temperature with a battery test system(Neware BTS-610).Cyclic voltammetry(CV)was carried out by a LK9805 electrochemical analyzer in voltage ranges of 3.0-4.5 V and 3.0-4.8 V at a scanning rate of 0.10 mV·s-1.Electrochemical impedance spectroscopy(EIS)was performed in a frequency range of 100 kHz-10 mHz with an AC amplitude of 5 mV using a Zennium electrochemical work station(Zahner).For XRD studies of the electrodes,the cells were dismantled in the glovebox and the composite electrodes were recovered,washed with diethyl carbonate(DMC)solvent,dried and analyzed by X-ray diffraction.
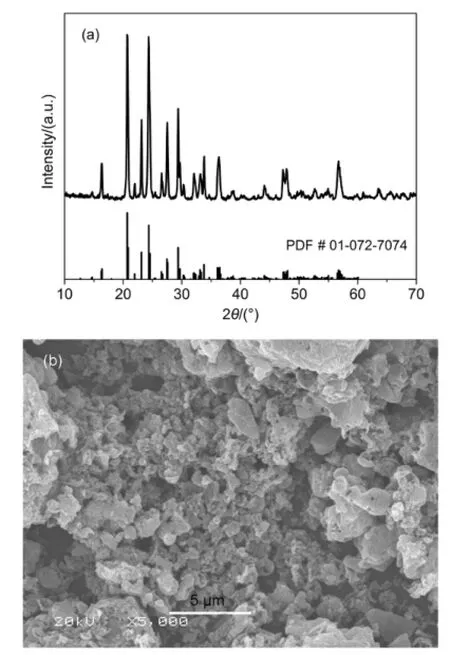
Fig.1 (a)XRD pattern and(b)SEM image of Li3V2(PO4)3/C sample
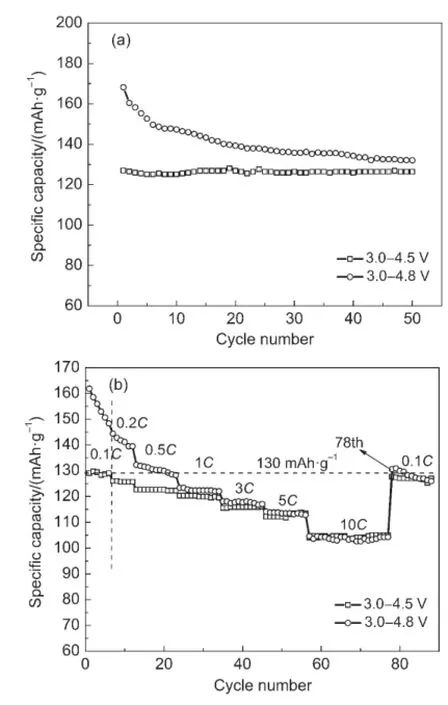
Fig.2 Electrochemical performance of Li3V2(PO4)3/C in different voltage ranges(a)cycle performance at 0.1C rate;(b)rate capability
3 Results and discussion
Fig.1(a)shows the XRD pattern of Li3V2(PO4)3/C sample.It can be seen that the sharp diffraction peaks can be indexed to monoclinic structure Li3V2(PO4)3with space group P21/n(PDF#01-072-7074).No related-carbon diffraction peak was detected in Fig.1(a)due to the small carbon content(2.6%(mass fraction,w)verified by CS-902 analytical instrument)left in the Li3V2(PO4)3/ C or the amorphous form.The morphology of Li3V2(PO4)3/C sample is shown in Fig.1(b).It can be seen that the morphology is irregular particle with a rough surface.The irregular shape powder has particle size in the range of 0.5 to 3.0 μm with some micropores,which may facilitate to the penetration of the electrolyte and do good to the electrochemical performance.
Fig.2 shows the electrochemical performance of the sample in different voltage ranges.As we can see,the electrochemical properties in voltage ranges of 3.0-4.5 V and 3.0-4.8 V are quite distinct from each other.Cycle performances(Fig.2(a))at 0.1C rate declare that the electrode measured in 3.0-4.5 V displays lower capacities but a better cycle stability,with a initial specific discharge capacity of 127.0 mAh·g-1and 99.5%of the initial capacity is maintained after 50 cycles,in contrast to 168.2 mAh· g-1and 78.5%in 3.0-4.8 V.Fig.2(b)shows the rate capabilities of the two voltage ranges,the initial discharge capacities in voltage range of 3.0-4.5 V are 129.0,120.3,112.2,and 104.1 mAh·g-1at 0.1C,1C,5C,and 10C rates,respectively;those in voltage range of 3.0-4.8 V are 161.8,123.4,114.1,and 104.1 mAh·g-1,respectively.Obviously,the rate capability in voltage range of 3.0-4.5 V is better than that in voltage range of 3.0-4.8 V.Besides that,when the charge/discharge rate is recovered to 0.1C rate after the high rate test,the discharge capacities in voltage ranges of 3.0-4.5 V and 3.0-4.8 V are 127.7 and 130.6 mAh·g-1,respectively,which are 99.0%and 80.7%of the initial 0.1C rate.These results indicate that irreversible capacity fading exists in the charge/discharge process in voltage range of 3.0-4.8 V.
In order to discuss the effects of voltage ranges on the electrochemical performance,the cells were alternate cycled in different voltage ranges.Fig.3 shows the initial charge/discharge curves in voltage ranges of 3.0-4.3/4.8/4.3 V and 3.0-4.5/4.8/4.5 V.First operation in 3.0-4.3/4.5/4.8 V is denoted as“D”and reoperation is denoted as“R”.From Fig.3(a)it can be seen that when first charge to 4.3 V,there are three charge/discharge voltage plateaus,which are corresponding to extraction/insertion of two lithium ions.The legible voltage plateaus indicate good phase transition during the extraction/insertion process.Another voltageplateau at 4.54 V can be found when charging to 4.8 V,which is corresponding to extraction of the third lithium ion.However,the voltage plateaus become inclined when operation in the voltage range of 3.0-4.3 V again.It shows that the electrochemical behavior transits from two-phase behavior to solid solution behavior. The initial charge/discharge curves show the same trends with the voltage ranges alternating between 3.0-4.5 V and 3.0-4.8 V (shown in Fig.3(b)).The initial dishcarge capacities of D-3.0-4.3 V,D-3.0-4.8V,andR-3.0-4.3Vare128.7,174.1,and128.7mAh· g-1,respectively,shown in Fig.3(a).The initial discharge capacities of D-3.0-4.5 V,D-3.0-4.8 V,and R-3.0-4.5 V are 130.1,170.4 and 139.8 mAh·g-1shown in Fig.3(b),the capacity of R-3.0-4.5 V increases 7.4%comparing with D-3.0-4.5 V,and maintains a capacity of 136.9 mAh·g-1after 11 cycles(Fig.3(c)). Make comparsion of the two group of discharge capacities,it can be concluded that part of the third lithium ion can be extracted under 4.5Vafter beingcycledseveral timesinvoltagerangeof 3.0-4.8 V.We suspect that the structure of Li3V2(PO4)3is more or less changed when charged/discharged in voltage range of 3.0-4.8 V.
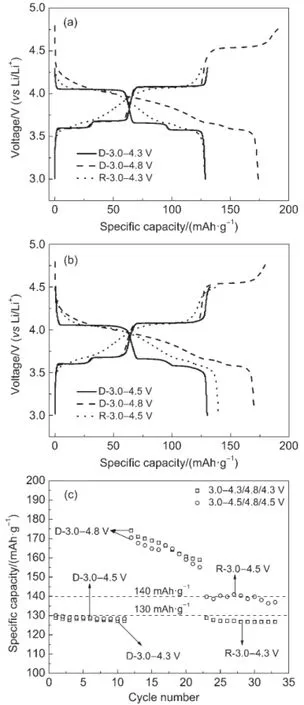
Fig.3 Electrochemical performance of Li3V2(PO4)3/C by alternate cycling in different voltage ranges(a)the charge/discharge curves in 3.0-4.3/4.8 V;(b)the charge/discharge curves in 3.0-4.5/4.8 V;(c)the cycle performance
To further investigate the electrochemical behaviors of the Li3V2(PO4)3/C cathode material,the CV curves of the electrode that were performed at a scan rate of 0.1 mV·s-1successively in voltage ranges of 3.0-4.5 V,3.0-4.8 V,and 3.0-4.5 V are shown in Fig.4.There are three sharp and symmetrical redox peaks in the curve of D-3.0-4.5 V,representing the reversible extraction/insertion behavior of the first two lithium ions involving V3+/V4+redox couple.When scanning to 4.8 V,the first three oxidation peaks are fully coincidence with D-3.0-4.5 V,the oxidation peak appeared at 4.61 V is representing the third lithium ion involving V4+/V5+redox couple.However,there are only three reduction peaks appeared at 3.56,3.62,3.91 V,the wide reduction peak at 3.91 V is corresponding to the solid solution behvior of V2(PO4)3→Li2V2(PO4)3.The ten continuous CV curves in 3.0-4.5 V are almost completely overlap,while the peak currents of 3.0-4.8 V decline fast with the increase of the cycle number,indicating the good cycle performance when charge/discharge in 3.0-4.5 V. What′smore,it can be clearly seen that the reduction peak currents mainly decline at 3.56 and 3.62 V.This indicates that the irreversible capacity decay may be attribute to the irreversible behavior of the first lithium ion.When scanning between 3.0 and 4.5 V again(Fig.4(c)),there are also three couples of oxdation and reduction peaks,but the currents of the peaks are only half of D-3.0-4.5V′sand the peaks become wide and smooth,indicating that the two-phase behavior becomes blurred.These results are in good agreement with the charge/discharge plateaus presented in Fig.3.Therefore,the extraction of the third lithium ion leads to some irreversible changes to the Li3V2(PO4)3cathode material and results in the difficult extraction/insertion behavior of the first lithium ion and bad cycle performance.
In order to further investigate the electrochemical behavior of the Li3V2(PO4)3/C electrodes in different voltage ranges,the electrochemical impedance spectra measured at different states of the charge and discharge processes are presented in Fig.5(a,c). EIS patterns are composed of a small intercept in high frequencies,two partially overlapped semicircles at high and medium frequency,and a straight line at low frequency.The insets of Fig.5 (a,c)present equivalent circuits to simulate the electrochemical impedance data.Rerepresents the solution resistance;Rsland Csldesignate the Li+migration resistance and capacity of surface layer,respectively;Rctand Cdlstand for the related charge-transfer resistance and double-layer capacitance,respectively;W represents the diffusion-controlled Warburg impedance.The computed resistances and Li+diffusion coefficients in various states are shown in Table 1.After comparison,the charge-transfer impedance decreases as the potential increases,because higher potential can accelerate the transfer of the charge.When operated in voltage range of 3.0-4.8 V(Fig.5(c)),the charge-transfer resistances are bigger than those in 3.0-4.3 V(Fig.5(a)),and the discharge stateof 3.7 V provides the highest charge-transfer resistance of 116.30 Ω.Moreover,the charge-transfer resistance is 63.38 Ω at the end of the discharge process,which is higher than that in 3.0-4.3 V (38.64 Ω).From the results,we can conclude that the extraction of the third lithium ion may lead to structural distortion and increase the charge-transfer resistance of Li3V2(PO4)3/C electrode.

Fig.5(b,d)shows the relationship between Zʹreand square root of frequency(ω1/2)in the low frequency region.The Li+diffusion coefficient is calculated according to the following equation:22,23where R is the gas constant(J·mol-1·K-1),T is the absolute temperature(K),A is the surface area of the cathode(m2),n is the number of electrons per molecule during oxidization,F is the Faraday constant(C·mol-1),C is the Li+concentration(mol·L-1),andσis the Warburg factor,which has relationship with Zʹre: where Reis the resistance between the electrolyte and electrode (Ω),Rslis Li+migration resistance of the SEI film(Ω),and Rctis the charge transfer resistance(Ω).

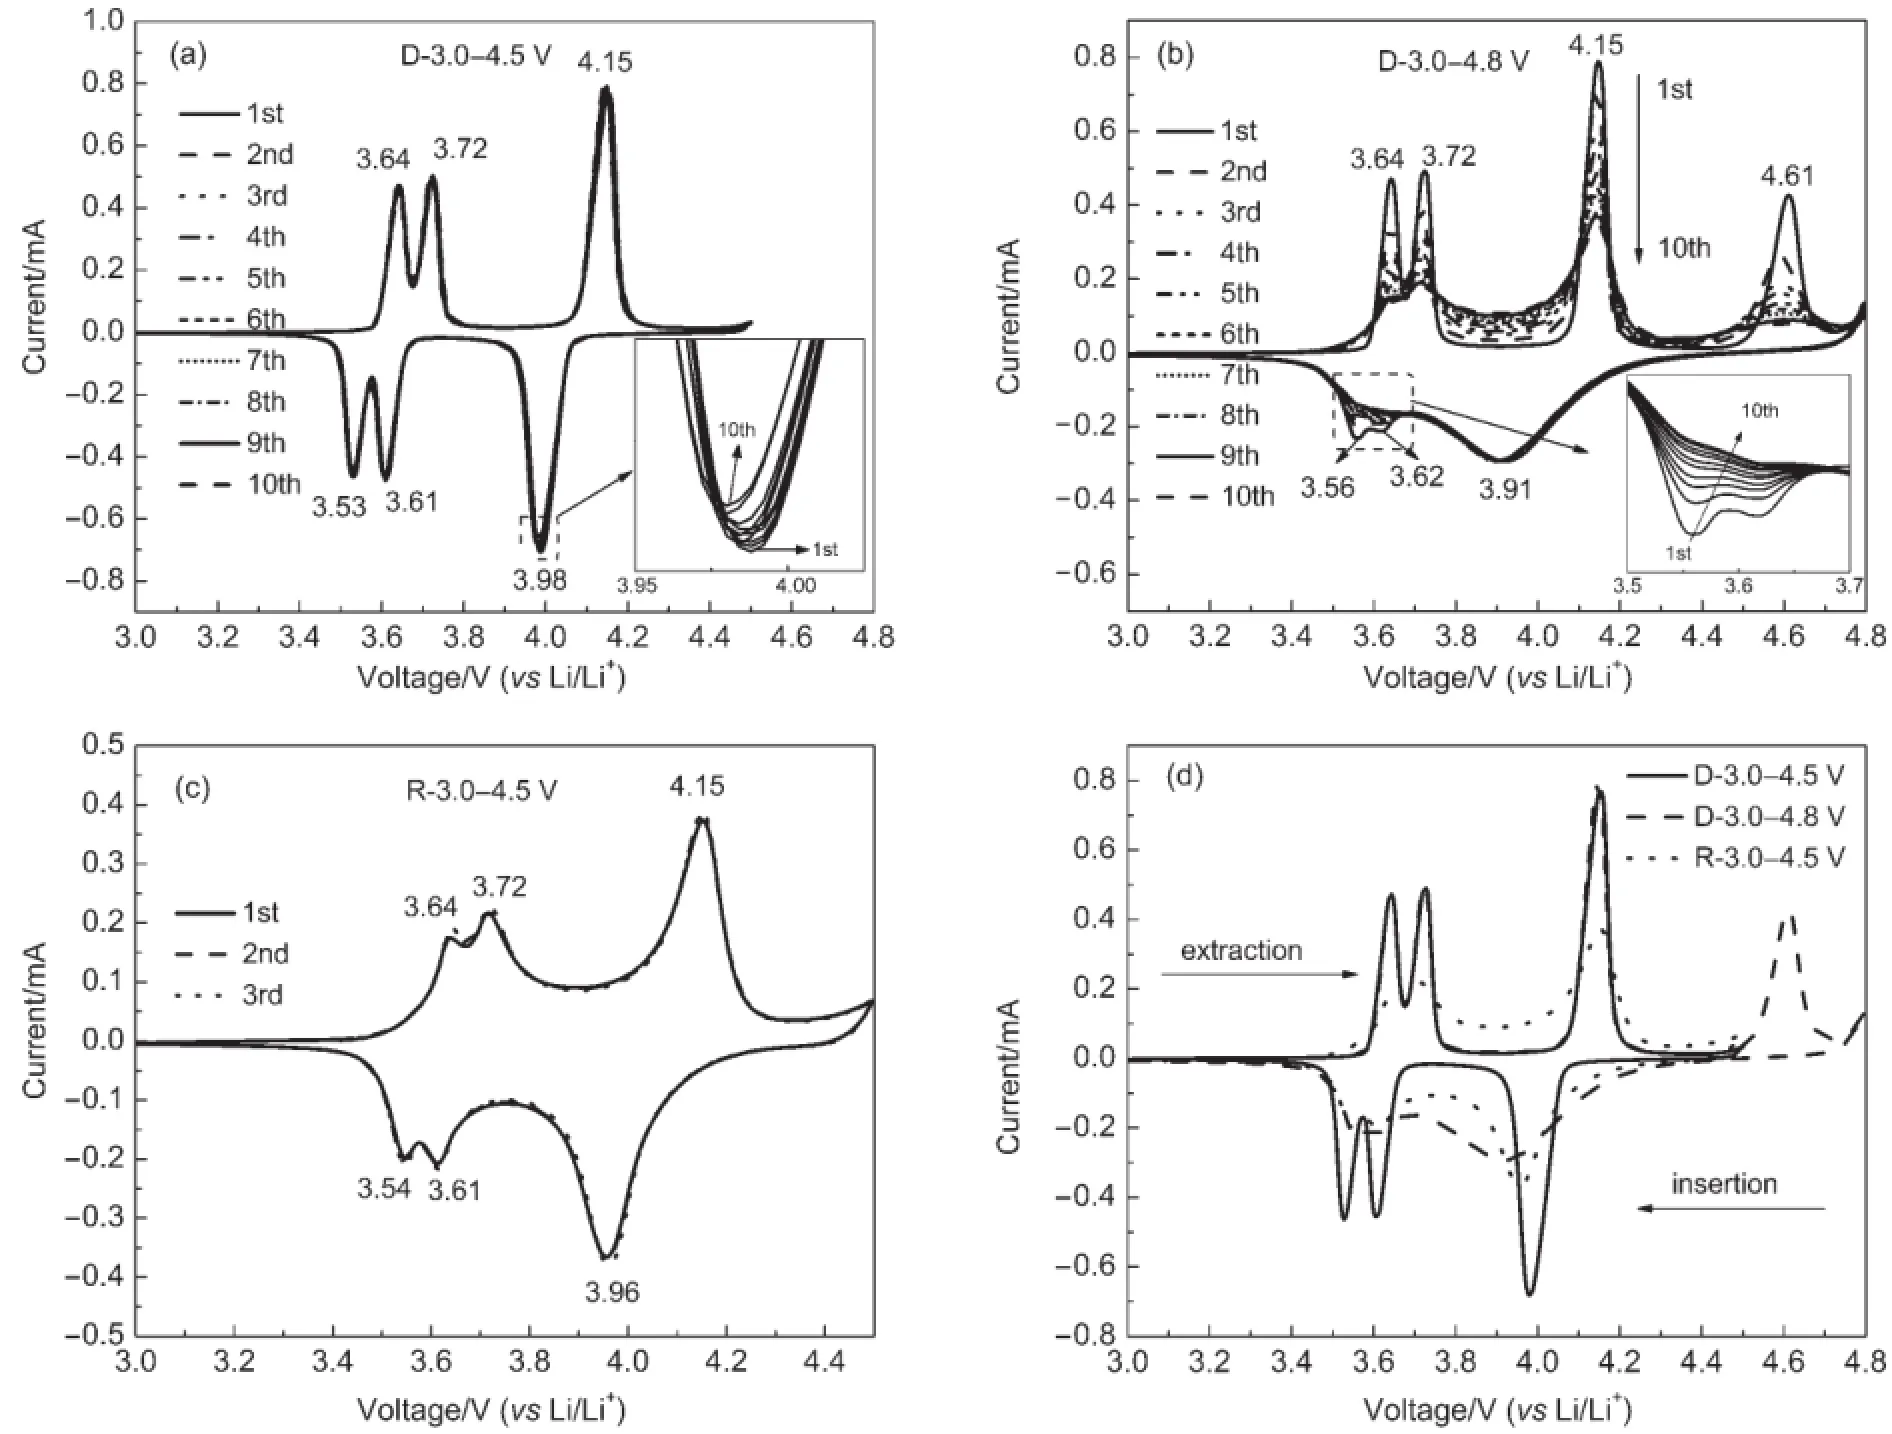
Fig.4 CV curves of the Li3V2(PO4)3/C sample in different voltage ranges
Based on Eq.(1),the apparent diffusion coefficients of Li+of different potential states are shown in Table 1.It can be seen that the apparent diffusion coefficients are greatly related to the potential in the state of charge/discharge.The apparent diffusion coefficient of Li+decreases with the increase of potential in the state of charge,the apparent diffusion coefficient of Li+at 4.8 V is the lowest(5.86×10⁻¹¹cm2·s-1),because the Li+ion concentration in the electrode decreases with the increase of the potential,so that the diffusion of Li+becomes increasingly difficult in kinetics.In the discharge process,the apparent diffusion coefficient of Li+decreases with the decreases of the potential,because the vacancy for the insertion of Li+becomes scarcer with the decreases of the potential.The apparent diffusion coefficients of Li+at 3.0 V in voltage range of 3.0-4.5 V are about 3 times of the one in 3.0-4.8 V,indicating that the Li+diffusion resistance increases after charge/discharge in 3.0-4.8 V.
Based on the aforementioned analysis of electrochemical performance of Li3V2(PO4)3/C cathode material in different voltages,we derive that the extraction of the third lithium ion may lead to some irreversible changes during charging and discharging processes.So what changes have occurred to the structure of the electrodes during and after cycling?To find out,the structures of the Li3V2(PO4)3/C electrodes cycled at 0.1C rate in voltage ranges of 3.0-4.5 V and 3.0-4.8 V were investigated by XRD.From the collected patterns shown in Fig.6,the three peaks marked with“↓”can be indexed to single phase of Al,the cathode current collector.It can be seen that the patterns of cycled electrodes are similar to the original sample,illustrating that the originalmonoclinic phase can be recovered even after many charge/discharge cycles at high discharge rate.The interplanar spacings of (211)plane24calculated by Jade 5.0 for the pristine sample,3.0-4.5 V and 3.0-4.8 V cycled electrodes are 0.36564,0.36541 and 0.36526 nm,respectively,indicating that the interplanar spacing decreases after long-time cycles,which makes it difficult to lithiumiondiffusioninkinetics.Thepatterns enlargement of 23.5°-25.5°are shown in inset of Fig.6,from which the diffraction peak positions in 3.0-4.8 V obviously shift to the right,however,the diffraction peaks position in 3.0-4.5 V slightly shift to the left. The diffraction peak positions shift to the right indicating that the cell volume decreases,otherwise increases.The cell parameters of the Li3V2(PO4)3/C sample and the cycled electrodes are shown in Table 2.It shows that the cell volume increases after cycled in 3.0-4.5 V and decreases after cycled in 3.0-4.8 V than the origin Li3V2(PO4)3sample.These results are in good agreement with the results studied by other groups.20,25The reduced cell volume makes the insertion of Li+become difficult,so that part of the Li+cannot insert smoothly into the Li3V2(PO4)3structure again during the discharge process and thus results in bad cycling performance.

Fig.5 Nyquist plots of the Li3V2(PO4)3/C sample measured under various open-circuit potentials in different charge/discharge states;relationship plots between Zʹreand ω-1/2of the material at various open-circuit potentialsThe insets in the figures(a)and(c)are the equivalent circuits.(a,b)3.0-4.3 V,(c,d)3.0-4.8 V

Table 1 Resistances of Re,Rsl,Rct,and the lithium ion diffusion coefficient at different potentials

Fig.6 XRD patterns of Li3V2(PO4)3/C sample and the cycled electrodes
In order to study the chemical states of the elements in Li3V2(PO4)3/C,sample and the cycled electrodes,the XPS spectrawere conducted on pristine sample and cathode electrodes after being cycled in 3.0-4.5 V and 3.0-4.8 V.Broad spectra of three specimens shown in Fig.7(a)imply that they contain all the necessary elements and there are no any impurity element.26,27Fig.7 (b)shows the collected V 2p spectra of pristine Li3V2(PO4)3sample and cathode electrodes after being cycled in 3.0-4.5 V and 3.0-4.8 V.The binding energy of V 2p in pristine Li3V2(PO4)3/C sample is 516.52 eV,corresponding to the oxidation state of V of +3.Towards to the cycled electrodes,the V 2p reflects higher binding energies than that of the pristine sample,with 516.56 and 516.65 eV in 3.0-4.5 V and 3.0-4.8 V,respectively,indicating the higher mean valance of V in the cycled electrodes.This is because that a few of Li+cannot return to the Li3V2(PO4)3electrodes in the discharge process,the reactions mechanism can be expounded as follows:
chargeLi3V2(PO4)3→Li3-xV2(PO4)3+xLi++xe-(0≤x≤3)(3)
discharge Li3-xV2(PO4)3+yLi++ye-→Li3-x+yV2(PO4)3(0≤y<x≤3)(4)
LiV2(PO4)3is gotten when charging to 4.5 V,the rest of Li ion can make the structure stable and beneficial to the insertion for the other Li+.When charging to 4.8 V,further Li+ions are extracted to from V2(PO4)3,the structure is easy to distort without the support of Li+,which make the insertion of Li+become difficult.
The content of V element in the used electrolyte after long-time cycles in different voltage ranges was quantified by ICP analysis. The contents of V element are about 1.056 and 1.460 mg·L-1in the electrolyte after long-time cycles in voltage ranges of 3.0-4.5 V and 3.0-4.8 V.It can be seen that V element is easier to dissolve in the electrolyte in high voltage range.Therefore,the V element dissolution may be another reason for the capacity fading in voltage range of 3.0-4.8 V.

Table 2 Cell parameters of Li3V2(PO4)3/C sample and the cycled electrodes
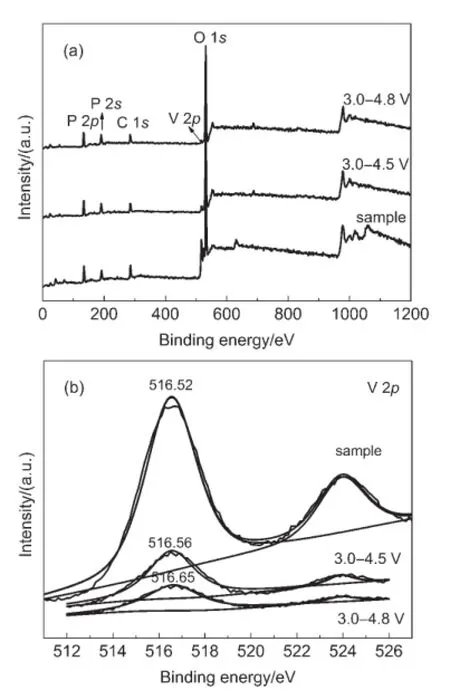
Fig.7 (a)XPS survey spectra and(b)V 2p XPS spectra of Li3V2(PO4)3/C sample and the cycled electrodes
4 Conclusions
In summary,Li3V2(PO4)3/C cathode material was synthesized via a sol-gel method,and the electrochemical performances under different voltage ranges were investigated.The results show that the voltage ranges have remarkable influence on the electrochemical performance,especially the cycle stability.The cycle performance and rate capability in voltage range of 3.0-4.5 V are better than those in voltage range of 3.0-4.8 V.It also turns out that more lithium ion can be extracted and inserted in voltage range of 3.0-4.5 V after being operated in 3.0-4.8 V.CV results indicate that the capacity fading in voltage range of 3.0-4.8 V is mainly at the position of 3.56 and 3.62 V involving to the extraction/insertion of the first lithium ion.According to the XRD and XPS of the electrodes after long-time cycles,the structure of Li3V2(PO4)3electrodes has been slightly changed during the charge/ discharge process in voltage range of 3.0-4.8 V.The structure distortion and V element dissolved in the electrolyte may be the key reasons leading to bad cycling performance.
References
(1)Zhang,B.;Zheng,J.C.Electrochim.Acta 2012,67,55.
(2)Zhang,L.;Xiang,H.F.;Li,Z.;Wang,H.H.J.Power Sources 2012,203,121.doi:10.1016/j.jpowsour.2011.11.082
(3)Wu,F.;Wang,F.;Wu,C.;Bai,Y.J.Alloy.Compd.2012,513,236.doi:10.1016/j.jallcom.2011.10.028
(4)Wang,L.J.;Tang,Z.Y.;Ma,L.;Zhang,X.H.Electrochem. Commun.2011,13,1233.doi:10.1016/j.elecom.2011.08.036
(6)Kong,L.B.;Zhang,P.;Liu,M.C.;Liu,H.;Luo,Y.C.;Kang,L. Electrochim.Acta 2012,70,19.doi:10.1016/j. electacta.2012.02.102
(7)Jiang,Y.;Xu,W.W,;Chen,D.D.;Jiao,Z.;Zhang,H.J.;Ma,Q. L.;Cai,X.H.;Zhao,B.;Chu,Y.L.Electrochim.Acta 2012,85,377.doi:10.1016/j.electacta.2012.08.067
(8)Rui,X.H.;Yan,Q.Y.;Skyllas-Kazacos,M.;Lim,T.M. J.Power Sources 2014,258,19.doi:10.1016/j. jpowsour.2014.01.126
(9)Wang,L.;Jiang,X.Q.;Li,X.;Pi,X.Q.;Ren,Y.;Wu,F. Electrochim.Acta 2010,55,5057.doi:10.1016/j. electacta.2010.03.062
(10)Ou,Q.Z.;Tang,Y.;Zhong,Y.J.;Guo,X.D.;Zhong,B.H.;Liu,H.;Chen,M.Z.Electrochim.Acta 2014,137,489.doi:10.1016/ j.electacta.2014.04.178
(11)Qiao,Y.Q.;Wang,X.L.;Mai,Y.J.;Xiang,J.Y.;Zhang,D.;Gu,C.D.;Tu,J.P.J.Power Sources 2011,196,8706.doi:10.1016/j. jpowsour.2011.06.056
(12)Qiao,Y.Q.;Tu,J.P.;Xiang,J.Y.;Wang,X.L.;Mai,Y.J.;Zhang,D.;Liu,W.L.Electrochim.Acta 2011,56,4139.doi:10.1016/j.electacta.2011.01.109
(13)Chang,C.X.;Xiang,J.F.;Shi,X.X.;Han,X.Y.;Yuan,L.J.;Sun,J.T.Electrochim.Acta 2008,53,2232.doi:10.1016/j. electacta.2007.09.038
(14)Tang,Y.;Zhong,B.H.;Guo,X.D.;Liu,H.;Zhong,Y.J.;Nie,X.;Tang,H.Acta Phys.-Chim.Sin.2011,27,869.[唐艳,钟本和,郭孝东,刘恒,钟艳君,聂翔,唐红.物理化学学报,2011,27,869.]doi:10.3866/PKU.WHXB20110416
(15)Zhang,L.;Wang,S.Q.;Cai,D.D.;Lian,P.C.;Zhu,X.F.;Yang,W.S.;Wang,H.H.Electrochim.Acta 2013,91,108.doi:10.1016/j.electacta.2012.12.098
(16)Teng,F.;Hu,Z.H.;Ma,X.H.;Zhang,L.C.;Ding,C.X.;Yu,Y.;Chen,C.H.Electrochim.Acta 2013,91,43.doi:10.1016/j. electacta.2012.12.090
(17)Zhang,L.L.;Duan,S.;Peng,G.;Liang,G.;Zou,F.;Huang,Y. H.J.Alloy.Compd.2013,570,61.doi:10.1016/j. jallcom.2013.03.189
(18)Wang,S.L.;Zhang,Z.X.;Fang,S.H.;Yang,L.;Yang,C.C.;Hirano,S.I.Electrochim.Acta 2013,111,685.doi:10.1016/j. electacta.2013.08.086
(19)Pei,B.;Jiang,Z.Q.;Zhang,W.X.;Yang,Z.H.;Manthiram,A. J.Power Sources 2013,239,475.doi:10.1016/j. jpowsour.2013.03.171
(20)Yin,S.C.;Grondey,H.;Strobel,P.;Anne,M.;Nazar,L.F. J.Am.Chem.Soc.2003,125,10402.doi:10.1021/ja034565h
(21)Tang,Z.Y.;Ruan,Y.L.Progress in Chemistry 2005,17,1.[唐致远,阮艳莉.化学进展,2005,17,1.]
(22)Qiao,Y.Q.;Wang,X.L.;Xiang,J.Y.;Zhang,D.;Liu,W.L.;Tu,J.P.Electrochim.Acta 2011,56,2269.doi:10.1016/j. electacta.2010.11.073
(23)Gao,C.;Liu,H.;Liu,G.B.;Zhang,J.;Wang,W.Mat.Sci.Eng. B-Solid 2013,178,272.doi:10.1016/j.mseb.2012.11.016
(24)Liu,S.Q.;Li,S.C.;Huang,K.L.;Chen,Z.H.Acta Phys.-Chim.Sin.2007,23,537.[刘素琴,李世彩,黄可龙,陈朝晖.物理化学学报,2007,23,537.]doi:10.1016/S1872-1508(07)60035-7
(25)Yoon,J.;Muhammad,S.;Jang,D.;Sivakumar,N.,Kim,J.;Jang,W.H.;Lee,Y.S.;Park,Y.U.;Kang,K.;Yoon,W.S. J.Alloy.Compd.2013,569,76.doi:10.1016/j. jallcom.2013.03.188
(26)Liu,Q.J.;Yang,F.;Wang,S.P.;Feng,L.J.;Zhang,W.J.;Wei,H.Y.Electrochim.Acta 2013,111,903.doi:10.1016/j. electacta.2013.08.122
(27)Wang,H.Li,Y.J.;Huang,C.H.;Zhong,Y.D.;Liu,S.Q. J.Power Sources 2012,208,282.doi:10.1016/j. jpowsour.2012.02.055
Electrochemical Behavior and Reasons for the Decrease in Capacity of the Li3V2(PO4)3/C Cathode Material in Different Voltage Ranges
TANG Yan1,2ZHONG Yan-Jun2OU Qing-Zhu2LIU Heng1,*ZHONG Ben-He2GUO Xiao-Dong2WANG Xin-Long2,*
(1College of Materials Science and Engineering,Sichuan University,Chengdu 610065,P.R.China;2College of Chemical Engineering,Sichuan University,Chengdu 610065,P.R.China)
Li3V2(PO4)3/C cathode material was synthesized by the sol-gel method.The electrochemical properties of the sample in different voltage ranges(3.0-4.5 V and 3.0-4.8 V)were investigated by galvanostatic charge/discharge tests,cyclic voltammetry(CV),and electrochemical impedance spectroscopy (EIS).Results show that the cycling performance and rate capability of Li3V2(PO4)3/C in voltage range of 3.0-4.8 V are worse than those in voltage range of 3.0-4.5 V.The initial specific discharge capacity in voltage range of 3.0-4.5 V at 0.1C rate(1C=150 mA·g-1)is 127.0 mAh·g-1,and 99.5%of the initial capacity was maintained after 50 cycles in contrast to 168.2 mAh·g-1and 78.5%in voltage range of 3.0-4.8 V.The discharge capacities in voltage ranges of 3.0-4.5 V and 3.0-4.8 V are 99.0%and 80.7%of the initial 0.1C rate respectively when the charge/discharge rate recovered to 0.1C rate after the high rate test.Part of the third lithium ion may be extracted at less than 4.5 V after several cycles in voltage range of 3.0-4.8 V with a capacity increase of 7.4%. CV results indicate that the irreversible capacity fading between 3.0 and 4.8 V may be attributed to irreversiblebehavior of the first lithium ion.X-ray diffraction(XRD)and X-ray photoelectron spectroscopy(XPS)results show that the structure of Li3V2(PO4)3changes slightly after operating between 3.0 and 4.8 V.Inductively coupled plasma(ICP)results indicate the presence of dissolved V in the cycled electrolytes.The structural distortion and the V dissolved in the electrolyte may be the main reasons for the decrease in capacity.
October 27,2014;Revised:December 17,2014;Published on Web:December 17,2014.
Li3V2(PO4)3/C;Electrochemical behavior;Voltage range;Capacity fading
O646;O614.1;TM912.9
10.3866/PKU.WHXB201412172
WANG Xin-Long,Email:wangxl@scu.edu.cn;Tel:+86-28-85405235;Fax:+86-28-85405235.
The project was supported by the China Postdoctoral Science Foundation(2014M562322)and Research Fund for the Doctoral Program of Higher Education,Ministry of Education of China(20120181120103).
中国博士后科学基金(2014M562322)和高等学校博士学科点专项科研基金(20120181120103)资助项目
©Editorial office ofActa Physico-Chimica Sinica
