Research on Calibration Transfer across Infrared Spectrometric Instruments for Fast Evaluation of Crude Oils
2015-06-21LiJingyanChuXiaoliTianSongbai
Li Jingyan; Chu Xiaoli; Tian Songbai
(Research Institute of Petroleum Processing, SINOPEC, Beijing 100083)
Research on Calibration Transfer across Infrared Spectrometric Instruments for Fast Evaluation of Crude Oils
Li Jingyan; Chu Xiaoli; Tian Songbai
(Research Institute of Petroleum Processing, SINOPEC, Beijing 100083)
The spectral analysis method is suitable for the process control and the process analysis such as the fast evaluation of crude oils. In this study, model transfer between the same type of spectrometer and different type of spectrometers was discussed respectively, and the results have shown that the transfer of calibration model can satisfy the demand of rapid analysis.
petroleum; IR; calibration transfer; process analysis
1 Introduction
Crude oil assay plays a very important role in petroleum exploitation, trading and processing. To cope with the diversification of crude oil sources, refinery usually runs on a variety of crude oils or blended crude oil as raw material. It is difficult to make the efficient operation of crude distillation unit if the crude oil properties cannot be timely monitored. Therefore, rapid evaluation of crude oil is needed. Vibrational spectroscopic analyses[1], such as the infrared and near-infrared spectroscopy in combination with multivariate calibration methods, are powerful analytical techniques which have received wide utilization during the past decade[2-4]. The application of MIR technology coupled with multivariate quantitative calibration methods is necessary to quantify the physical and chemical properties of crude oils since these samples are highly complicated with their composition and spectral distribution being in the gross overlapped. In many studies, the partial least square (PLS) regression algorithm was employed to build quantitative calibration models for key properties of petroleum.
The application of spectral analysis to the process parameters analysis, however, has been largely limited by a problem identified as calibration transfer[5]. The changes in spectral variations between the two systems may make the model invalid in predicting the new system. Moreover, with the use of instruments, components will need to be replaced and reviewed, and this would also result in the spectra changes. A solution to this calibration transfer problem is to re-measure every sample and construct a new model for the newly acquired spectra, and this approach would be both costly and time consuming. A more acceptable way is to apply the chemometrics methods to correct the difference of spectra collected on two analytical instruments. Great attempts have been devoted to transfer a well-established calibration model from one instrument (master) to another instrument of the same type or different type. Various standardization methods have been developed to enable a calibration model to be effectively transferred between two systems. The commonly used model transfer methods include the direct correction (DS)[6], the piecewise direct standardization (PDS), the Shenk’s algorithm[7], and the Procrustes analyses[8].
In order to obtain fast-evaluation data for crude oils, which are based on a traditional laboratory infrared spectrometer (Nicolet 6700) and a portable infrared spectrometer, this paper presents different methods used for calibration transfer.
2 Experimental
2.1 Samples
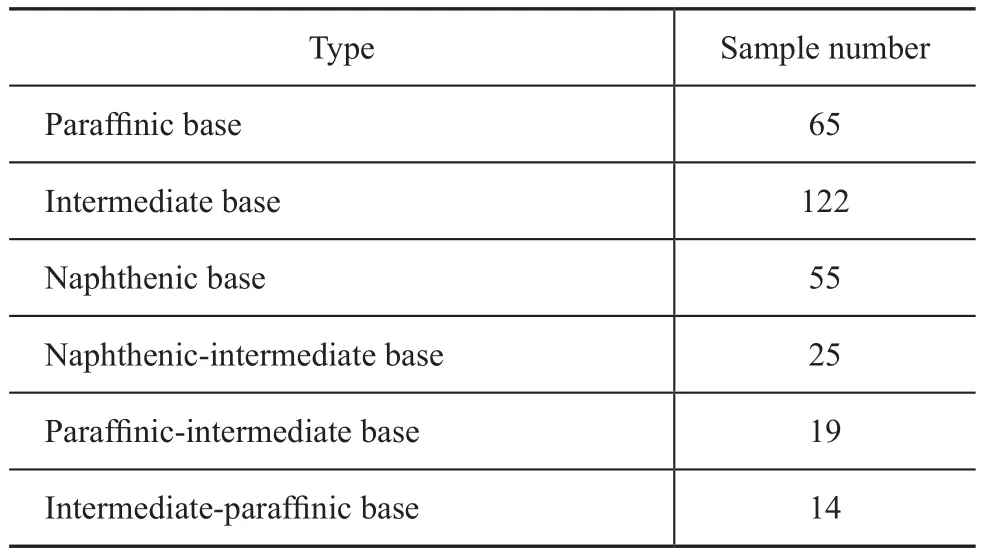
From 2001 to 2010, a total of 300 crude oil samples were collected by the Crude Oil Evaluation Department in the Research Institute of Petroleum Processing (RIPP) ofSINOPEC. These petroleum samples originated from oil fields located inside China and other countries around the world. The samples with diverse variations of properties were carefully collected in order to build up a more robust calibration model. The density distribution of all samples covers 0.768 7—1.009 g/cm3. The detailed information of these crude oil datasets is listed in Table 1.

Table 1 The information of crude oil samples (collected in the 2001-2010 period)
2.2 Acquisition of MIR spectra
(1) Traditional laboratory instrument: The mid-infrared (MIR) spectra of petroleum were collected using a Nicolet 6700 FT-IR spectrometer equipped with the deuterated triglycine sulfate detectors (DTGS) and the horizontal attenuated total reflectance (ATR) temperature control zinc selenide (ZnSe) sample cells accessory. Spectra were collected by filming the petroleum samples into the ATR plate with a ZnSe crystal while maintaining the temperature at 25±0.1 ℃ by a temperature control unit. After the spectral acquisition, the crude oil remaining on the surface of ATR was removed gently with the absorbent cotton and rinsed with petroleum ether. The ATR accessory is easily manipulated to give reproducible spectra for high precision quantitative analysis. The MIR spectra were collected over the spectral region from 4 000 cm-1to 650 cm-1. The resolution of collected spectra was 8 cm-1, and each spectrum corresponded to an accumulation of 64 scans, at approximately 55 s. The background spectra of air were collected for each sample instantly before the collection of the crude oil sample spectra. The spectral files were transformed into ASCII format by the Thermo Nicolet OMNIC8.1 software provided to the spectrometer. Figure 1 shows the raw MIR spectra of petroleum samples analyzed by the ATR-cell. (2) Portable instrument: The MIR spectra of petroleum samples were collected by the Agilent (A2) 4 500 t and Agilent 4500 dialpath FT-IR spectrometers, respectively, which were equipped with an 100-μm TumblIR (ZnSe cell). The MIR spectra were collected over a spectral region from 4 000 cm-1to 650 cm-1. The resolution of collected spectra was 8 cm-1, with each spectrum corresponding to an accumulation of 64 scans. Figure 2 shows the raw MIR spectra of petroleum samples analyzed by the Agilent A2 4500t spectrometer.

Figure 1 Raw mid-infrared spectra of crude oil obtained from the Nicolet spectrometer

Figure 2 Raw mid-infrared spectra of crude oil obtained from the Agilent A2 4500t spectrometer
2.3 Algorithm
Two different types of portable infrared spectrometers manufactured by the same factory have the same optical length albeit with a slight difference in data collection. In this case, two spectrometers have no difference in absorbance. The spectral measurement and optical structure show a significant difference between the laboratory infrared spectrometer and portable spectrometer, such as theNicolet-6700 equipped with ATR and the portable spectrometer equipped with a 100 μm transmission cell. The absorbance and sampling points measured by both instruments vary widely, and different algorithms are employed in these two different cases.
Interpolation algorithm was employed to solve the inconsistency of spectral range, which is a method adopted to estimate the unknown interpolation by the known discrete values. Various methods for calibration transfer exist in the literature, such as the Lagrange interpolation, the Newton interpolation, the Hermite interpolation, the piecewise polynomial interpolation and the spline interpolation. This study used the cubic spline interpolation, also known as the piecewise smooth curve interpolation. Procrustes analysis (PA) was employed to eliminate the difference between the Nicolet-6700 spectrometer and the Agilent A2 4500 t spectrometer. The standardization setX1is selected among the calibration set of master instrument using a subset selection approach, and the same subset was selected for the slave instrument setX2. Spectral regression is carried out toX1andX2, respectively. The transformation matrixU1andU2map the standardization sets to two low-dimensional subspaces. The mathematical model can be expressed asX1=X2×F+E, with the objective function being: min tr(Et×E). The Procrustes analysis can be realized by the singular value decomposition method.
The specific algorithm of Procrustes analysis can be described as follows:
(1) Singular value decomposition is carried out toX1andX2, respectively, whereX1=U1S1V1, andX2=U2S2V2.X1represents a spectral matrix from the master or‘primary’spectrometer andX2represents a spectral matrix from the slave or ‘secondary’ spectrometer. The spectra have been pretreated by the 2nd derivative approach.
(2) ObtainZ1andZ2viaZ1=U1S1andZ2=U2S2, respectively, and then the number of principal components is determined.
(3) The conversion matrixFofZ1andZ2is given byX1=X2×F+E.
(4) By virtue of the matrixF, the spectral acquisition from the target machine can be converted to the master spectrum.
2.4 Data analysis
All 300 samples are divided into the calibration sets and the validation sets by using the Kennard–Stone method. The calibration sets consist of 200 samples, while the validation sets consist of 100 samples. A multivariate quantitative calibration model including density, TAN, and sulfur content of oil samples, has been established by PLS based on MIR collected by the Agilent A2 4500 t spectrometer. All data processing programs employed in this paper, including the spectral pretreatment and the PLS regression, were written in the Matlab 6.5 code and the program file was run on a HP Compaq dc7800 business PC.
3 Results and Discussion
3.1 Calibration transfer between Portable instrumentThe difference between infrared spectra of various crude oils is reflected in their wavelength points and absorbance values. Differences only exist in wavelength points between two portable infrared spectrometers. There are 1802 sampling points for the Agilent A2 4500 t spectrometer, and 1798 sampling points for the Agilent 4500 dialpath spectrometer, respectively. The interpolation method is employed for correction of the wavelength point.
We define the Agilent A2 4500 t spectrometer as the master spectrometer, and the Agilent 4500 dialpath spectrometer as the secondary spectrometer, respectively. The spline interpolation approach can have access to data ofXandYas well as the expected value ofXi, which can allow for fitting cubic spline interpolation polynomial forXandY, and finally calculating everyYivalue for the correspondingXiby the polynomial.
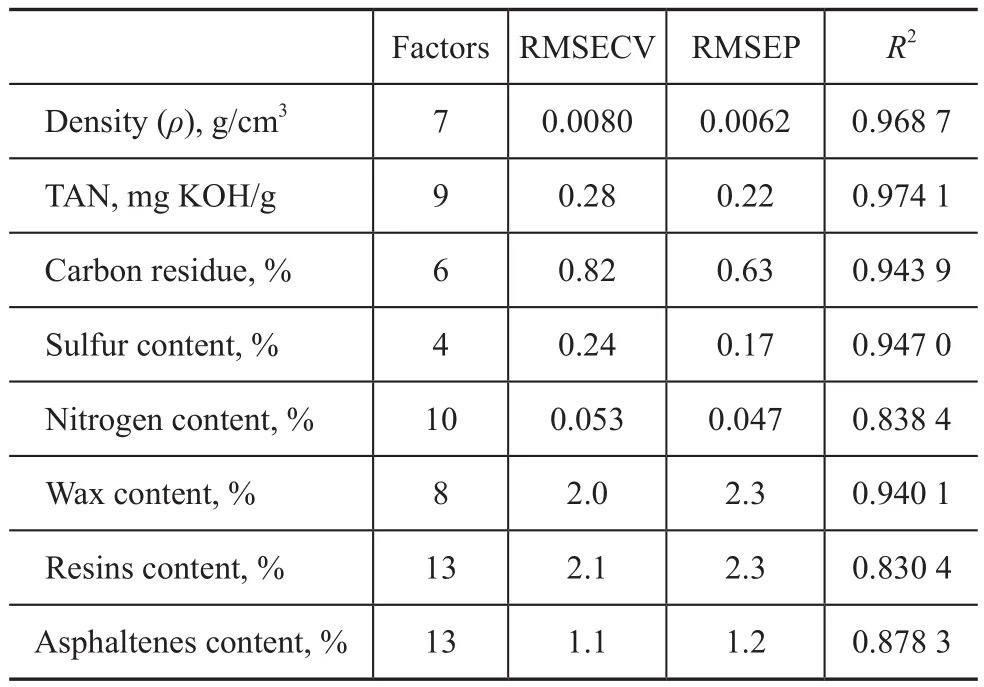
Before model transfer, the properties of crude oil calibration models have been developed by means of the partial least squares (PLS) regression method in the master spectrometer. The full leave one out cross-validation was used to determine the optimal number of latent variables (factors). Predictive performance was reported as a root mean square error of prediction (RMSEP). The RMSEP and other model parameters of the prediction sets are shown in Table 2. The MIR spectra of three unknown crude oils labeled as #221, #266, and #316 were obtained both in the master and the secondary spectrometers. After interpolation, spectra measured on the secondary instrument were predicted with the calibration model developed on the master spectrometer. The results of prediction are givenin Table 3. The deviation of density was the minimum in eight basic profile data of three kinds of crude oils, and basically, the error was less than 0.004 g/cm3. Deviations of TAN were within 0.1 mgKOH/g. Other deviations were also within the acceptable error range.

Table 2 PLS parameters of A24500t
3.2 Calibration transfer between Nicolet-6700 spectrometer and portable instrument
In order to apply calibration model established for the laboratory infrared spectrometers to the process control field, and to avoid re-acquisition of spectra, the Procrustes analysis is adopted to correct the difference between the laboratory spectrometer Nicolet-6700 (secondary) and the portable Agilent A2 4500 t (master) spectrometer. The Procrustes analysis approaches applicable to the calibration transfer require the spectra of a few well-chosen samples measured on the ‘master’ instrument and the same samples collected on the ‘secondary’ instrument before obtaining the transfer parameters matrixF. The samples used to compute the transfer matrixFmust be fully representative to describe the difference between the relevant spectrometers. The standardization samples are selected among the calibration samples collected on the ‘master’ spectrometer by the Kennard-Stone algorithm. This method allows us to get the samples that can span the entire experimental domain. About 30 crude oil samples are selected from 200 calibration set samples.
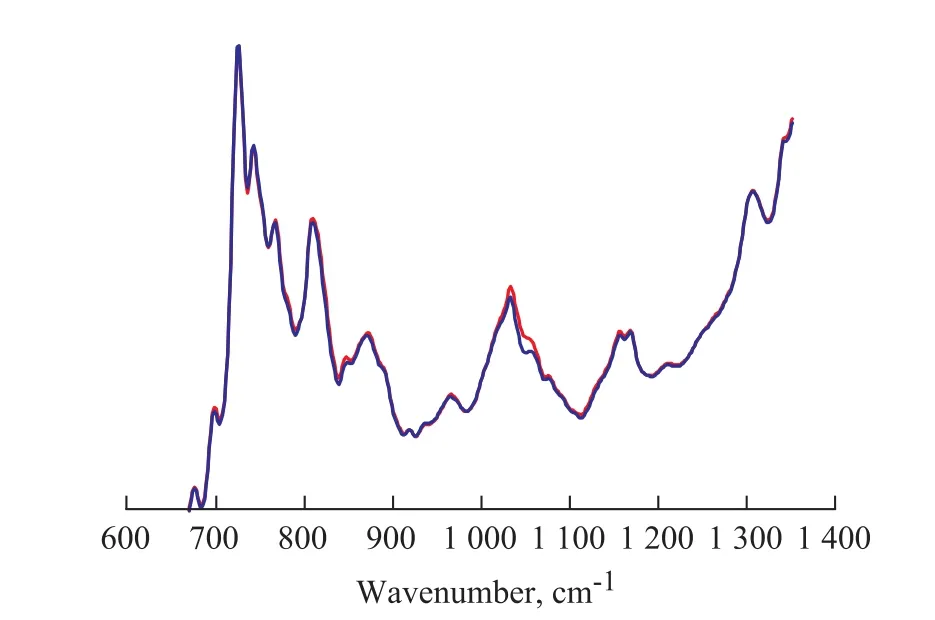
The MIR spectra of crude oil sample #211 collected from the master spectrometer and the corrected spectra from secondary spectrometer are given in Figure 3, and the two spectra showed high consistency in most spectral intervals. As shown in Figure 2, before model transfer, an appropriate spectral interval should be selected for the absorbance within the spectral interval between 1 500 cm-1and 3 000 cm-1, and this paper selects an interval in the range of 670—1 350 cm-1and 1 600—1 800 cm-1, respectively.
The spectra measured by the Nicolet-6700 spectrometer (secondary) are converted to master spectrometer’s spectra by the Procrustes analysis, and then the PLS model are established, with the PLS model parameters presented in Table 4. It can be seen from Table 4 that all related properties are predicted accurately except TAN. Compared with the data listed in Table 2, the model established onthe basis of the Agilent A2 4500t performance is better than the model established on the basis of the corrected spectra collected from the Nicolet-6700 spectrometer, nevertheless the model is still applicable.

Table 3 Prediction of master and secondary samples

Figure 3 MIR from master spectrometer and the corrected spectrum
The MIR spectra of three unknown crude oils labelled as #221, #266, and #316 were measured both by the master and the secondary spectrometers. After correction, spectra measured by the secondary instrument were predicted with the calibration model developed on the master spectrometer. The prediction results are given in Table 5. As shown in Table 5, the deviation of density is around 0.008 g/cm3. Deviations of TAN are within 0.3 mgKOH/g. Other deviation values are also within the acceptable error range.

Table 4 Corrected PLS model parameters applicable to the Nicolet-6700 spectrometer

Table 5 Prediction results of master spectra and corrected spectra
4 Conclusions
The results presented in this study show that the method based on spline interpolation was successfully used to correct the differences between portable infrared spectrometers. The Procrustes analysis (PA) was employed to eliminate the difference between the Nicolet-6700 spectrometer and the Agilent A2 4500t spectrometer. The prediction results have shown that the calibration transfer can preliminarily satisfy the needs of crude oil rapid assay.
[1] Kemeny G J. Handbook of Near-infrared Analysis[M]. New York: Marcel Dekker, 2001: 1-6
[2] Chu Xiaoli, Tian Songbai, Xu Yupeng. A study of crude oil rapid assay by near infrared spectroscopy[J]. Petroleum Processing and Petrochemicals, 2012, 43(1): 72-77 (in Chinese)
[3] Aske N, Kallevik H, Sjoblom J. Determination of saturate, aromatic, resin, and asphaltenic (SARA) components in crude oils by means of infrared and near-infrared spectroscopy[J]. Energy Fuels, 2001, 15(5): 1304-1312
[4] Chen Pu, Sun Jian, Zhang Fenghua, et al. Development and industrial application of rapid crude oil evaluation system by NIR[J]. Petroleum Processing and Petrochemicals, 2014, 45(8): 97-101
[5] Robert N, Nathaniel A, Tan Huwei. Transfer of multivariate calibration models: a review[J]. Chemometrics and Intelligent Laboratory Systems, 2002, 64(2): 181-192
[6] Benoit I, Charles R, Hurburgh J. Standardization of near infrared spectrometers: Evaluation of some common techniques for intra- and inter-brand calibration transfer [J]. J Near Infrared Spectrosc, 2008, 16(6): 539-550
[7] Bouveressee, Massart D, Dardenne P. Calibration transfer across near-infrared spectrometric instruments using Shenk’s algorithm: effects of different standardisation samples[J]. Analytica Chimica Acta, 1994, 297(4): 405-416
[8] Chu Xiaoli, Yuan Hongfu, Lu Wanzhen. Calibration transfer of spectra from near infrared spectrometers by Procrustes analysis [J]. Chinese Journal of Analytical Chemistry, 2002, 30(1): 114-119 (in Chinese)
date: 2014-09-12; Accepted date: 2014-10-30.
Dr. Li Jingyan, Telephone: +86-10-82368342; E-mail: lijy.ripp@sinopec.com.
杂志排行
中国炼油与石油化工的其它文章
- Study on Surface Adsorption and Inhibition Behavior of Corrosion Inhibitors Contained in Copper Foil Rolling Oil
- Synthesis of Petroleum Sulfonate Surfactant with Ultra-Low Interfacial Tension in Rotating Packed Bed Reactor
- Simultaneous Removal of H2S and Organosulfur Compounds from Lique fied Petroleum Gas Using Formulated Solvents: Solubility Parameter Investigation and Industrial Test
- Effect of Dodecylbenzene Sulfonic Acid Used as Additive on Residue Hydrotreating
- Sulfur Distribution during Hydrothermal Liquefaction of Lignite, Wheat Straw and Plastic Waste in Sub-Critical Water
- Simulation Optimization and Experimental Study of Cross-Wall Adiabatic Dividing Wall Column Used to Separate Hexane-Heptane-Octane System
