Better parameters of ventilation-CO2output relationship predict death in CHF patients
2015-05-22YouxiuYAOXingguoSUNZheZHENGGuizhiWANGJamesHansenWilliamStringerKarlmanWassermanShengshouHU
You-xiu YAO, Xing-guo SUN, Zhe ZHENG, Gui-zhi WANG, James E. Hansen, William W. Stringer, Karlman Wasserman, Sheng-shou HU
1. State Key Laboratory of Cardiovascular Disease, Fuwai Hospital, National Center for Cardiovascular Diseases, Chinese Academy of Medical Sciences and Peking Union Medical College, Beijing 100037, China; 2. Peking University Third Hospital, Beijing 100191, China; 3. Respiratory and Critical Care Physiology and Medicine,Los Angeles Biomedical Research Institute at Harbor-UCLA Medical Cente, St. John's Cardiovascular Research Center,Torrance, CA 90502,USA; 4. Department of Anesthesiology, Weifang Medical College, Weifang 261061, China
Original article
Better parameters of ventilation-CO2output relationship predict death in CHF patients
You-xiu YAO1,2, Xing-guo SUN1,3, Zhe ZHENG1, Gui-zhi WANG3,4, James E. Hansen3, William W. Stringer3, Karlman Wasserman3, Sheng-shou HU1
doi 10.13459/j.cnki.cjap.2015.06.005
1. State Key Laboratory of Cardiovascular Disease, Fuwai Hospital, National Center for Cardiovascular Diseases, Chinese Academy of Medical Sciences and Peking Union Medical College, Beijing 100037, China; 2. Peking University Third Hospital, Beijing 100191, China; 3. Respiratory and Critical Care Physiology and Medicine,Los Angeles Biomedical Research Institute at Harbor-UCLA Medical Cente, St. John's Cardiovascular Research Center,Torrance, CA 90502,USA; 4. Department of Anesthesiology, Weifang Medical College, Weifang 261061, China
Objective: Measures of ventilation-co2output relationship have been shown to be more prognosc than peak O2uptake in assessinglife expectancy in paents with chronic heart failure (CHF). Because both the ratios and slopes of ventilation-co2output of differing durations can be used, we aim to ascertain which measurements best predicted CHF life expectancy. Methods: Two hundred and seventy-one CHF paents with NYHA class II-IV underwent incremental cardiopulmonary exercisetesting (CPET) and were followed-up for a median duraon of 479 days. Four di ff erent linear regression slopes were calculated from warm-up exerciseonset to: 180 s, anaerobic threshold (AT), venlatory compensaon point (VCP); and peak exercise. Five raos were calculated for the following dura-ons: rest (120 s), warm-up (30 s), AT (60 s), lowest value (90 s), and peak exercise (30 s). Death or heart transplant were considered end-points. Mulple stascal analyses were performed. Results: CHF paentslowest(41.0±9.2, 141±30%pred), highat AT (42.5±10.4, 145±35%pred), and highslope to VCP (37.6±12.1, 126±41%pred). The best predictor of death was a higher lowest (≥42, ≥141%pred), whereas the slope to VCP was less variable than other slopes. For death prognosis in 6 months, %pred values were superior: for longermes, absolute values were superior. Conclusion: The increased lowest rao easily idenfi able and simply measured during exercise, is the best measurement to assess the venlaon-co2output relaonship in prognoscang death in CHF paents.
cardiopulmonary exercise testing; ventilation-co2output relationship; lowestdeath prognosis; chronic heart failure
Introduction
The search for better ways to assess survival duration in patients with chronic heart failure (CHF) continues. Several gas exchange measures during cardiopulmonary exercise testing (CPET) have been shown to be more useful than more invasive and expensive resting measurements[1,2]. Initially,Peak oxygen uptakeand anaerobic threshold (AT) measurements were identified as optimal in evaluating suitability for heart transplantation[3-16]. Later it became evident that measures of the relationships of ventilationto CO2outputcommonly called ventilatory inef ficiency or ventilatory efficiency, were equally or even more useful in predicting survival duration in CHF patients[17-29].e relationships can be assessed by linear regression ofand by ratios ofor reversed ratio. Both the slopes and ratios during CPET can be assessed at dif f ering times, with conf f icting opinions as to their merit. Unfortunatelyslope assessments are a ff ected by their intercepts, which are variable and usually ignored[29, 32], and may or may not include nonlineardata near the end of exercise[7, 33-35], when ventilation is driven by increasing[H+][28, 30, 36, 37]. Nevertheless some investigators consider the slope ofover the entire CPET as the superior measure for prognosis[17, 18, 34, 35]. Although slopes may appear to be linear, ratios ofvary signi fi cantly during the a CPET[1, 29, 32]. We found the lowest and ratio ofat AT, had less variability, was more reproducible in normal subjects[32] and in CHF patients[38]; and predicted early death better than other slopes or ratios[29].
As the Core Laboratory of CPET in a multi-center CHF study, i.e. Resynchronization for Hemodynamic Treatment for Heart failure Management (RHYTHM) sponsored by St Jude Medical[29, 38-40], we had the opportunity to re-analyze the CPET database, including theandrelationships. Other data including New York Heart Association symptom classification (NYHA), common resting cardiovascular measures, and longer term followup were also available to us. Therefore, a complete analysis of the several dif f erent methods of assessing the ventilation-CO2output relationships during CPET allowed us to evaluate these prognostic indicators of survival in stable CHF patients.
Methods
Patients
This re-analysis study was approved by our Institutional Review Board (Fuwai-2013-ZX29). The original study was initiated and fi nanced by St. Jude Medical, Inc38. Informed consents were obtained at each site where the CPET were performed. All patients were NYHA Class II-IV systolic CHF with ejection fraction <35%, QRS-complexes >120 ms and implantation of biventrivular pacing (BVP) electrodes two weeks before CPET.
CPET protocol and gas exchange measurements
The protocol[29, 38, 40] required measurements during 3 minutes of rest, 3 minutes of unloaded cycling or warm-up treadmill, followed by continuous or one-minute increments of work (ramp pattern) to maximum tolerance. Work rate was increased at 5-25watts/min, depending on the patient’s NYHA class and gender in an attempt to have the patients become limited in 6-15 min of incremental exercise. Quality control methods were as previously reported [38].
Gas exchange measurements
As previously reported, breath-by-breath CPET gas exchange data were collected at 60 Sites (see lists in Acknowledgements) using one of five commercial systems [29, 38, 40].e AT was measured by the V-slope method[41] using 10 s averaged gas exchange data. The peakwas determined as the highest 30s average value near peak exercise. Peak HR and peak O2-pulse were averaged at that same time. All calculations of %predicted values (%pred) depended on age, gender, height, weight, and type of ergometry[1, 29, 32, 37, 39].
Analysis of ventilation-CO2output relationships
Follow up data
Statistical analysis
Data, are expressed as mean±SD, unless specially noted and were analyzed by unpaired t and chi-square tests with a two-tailedPvalue <0.05 considered signif i cant. NYHA and BVP ON/OFF were analyzed by Mann-Whitney U-test[42]. Area under curve (AUC) of receiver operating characteristic (ROC) was used to assess survival/death[29, 43]. Optimal cutoff values were determined by the shortest distance of its ROC using steps of whole numbers for ratios and slopes of ventilation-CO2output relationships, one decimal numbers for resting cardiac output and two decimal numbers for peak[29, 44]. Usingthe optimal cut-of f value, univariate and multivariate regression analyses were performed to obtain optimal prognostic predicting models[45, 46]. Kaplan-Meier survival curves were constructed and log rank tests were used to compare the most important predictors. The Microsoft Professional Office XP2003, SPSS Statistics 17.0, Origin 7.0 and Sigmaplot 8.0 computer soware were used for all calculations and graphs.
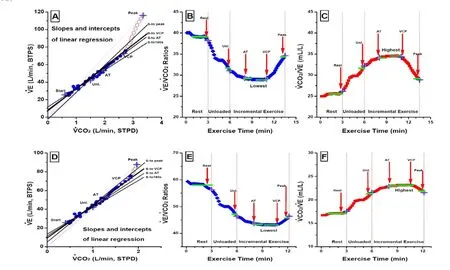
Fig. 1 Different measurements of ventilation-CO2output relationship during CPET in different severity CHF patients. Panel A, B and C shown the data from a mild CHF patient, and panel D, E and F shown those from a severe CHF patient. Panel A and D shown slopes and intercepts ofand Panels B, C, E and Fratios using the different part or entire database.four differentsolid lines in panel A and D indicate thatslopes were calculated by linear regressionintercept+slope×) using four durations from the onset of warmup to: (1)end of warmup (180 s); (2)AT; (3)ventilatory compensation point (VCP, the thicker solid line); and (4)peak exercise. The opened diamond/crosses in panel B, E and the red dotted lines from origin to the different opened circles/crosses in panel A, D indicated that thewerevalues as the slopes (doted lines) only when the intercepts were zero. Panel B, C, E and F shown the ratios of and in ml/L at differing times, i.e. rest, unloaded (Unl.), AT, lowest (or highest) and peak exercise.
Results
Background information
CHF patients’ ages were 69±10 years, weights were 86±18 kg and BMIs were 28.7±5.3 kg/m2. Approximately three quarters were men. All were maintained on optimal pharmaceutical regimens, and implanted with a BVP-ICD.e 271 patients’ BVP-ICD setting were: 212 BVP-ON (147 labeled “synchronized”, i.e. simultaneous stimulation and 65 labeled “optimized”, i.e. stimulation of right and leventricle slightly different to achieve optimized contraction) and 59 temporary BVP-OFF in 6 months. Aer 6 months BVPOFF, 24 crossed over of the BVP-OFF to the BVP-ON for the study and all others was turned BVP-ON by the doctor, but not enrolled in the cross-over study. Patients’ resting hemodynamic measurements and their prognostic values are shown in Table 1.e 271 patients were followed 469±94 days, with 12 deaths in 6 months and a total of 28 deaths overall. None of the resting cardiovascular measurements discriminated survival except for cardiac output (P<0.05) and NYHA (P<0.001).
All 271 CHF patients safely performed symptom-limited maximal CPET with qualified systems; 33 were initially unsatisfactory and required repeat studies after repair or retraining [38]. Common limiting symptoms were fatigue (197), dyspnea or shortness of breath (101), leg fatigue/pain (26), and chest pain or tightness(10). Less common were dizziness (4), lightheadedness (3), dry-mouth (2) and palpitation (2). 9 tests, all of which were considered maximal, were stopped by physicians or technicians
due to serious ECG abnormalities (3), BP decrease (2), SpO2decline (2) or other causes (2). 198 patients stated they were limited by a single symptom; others were limited by two or more symptoms.

Tab. 1 Resting cardiovascular measurements for longer term death/survival prognosis in CHF patients.
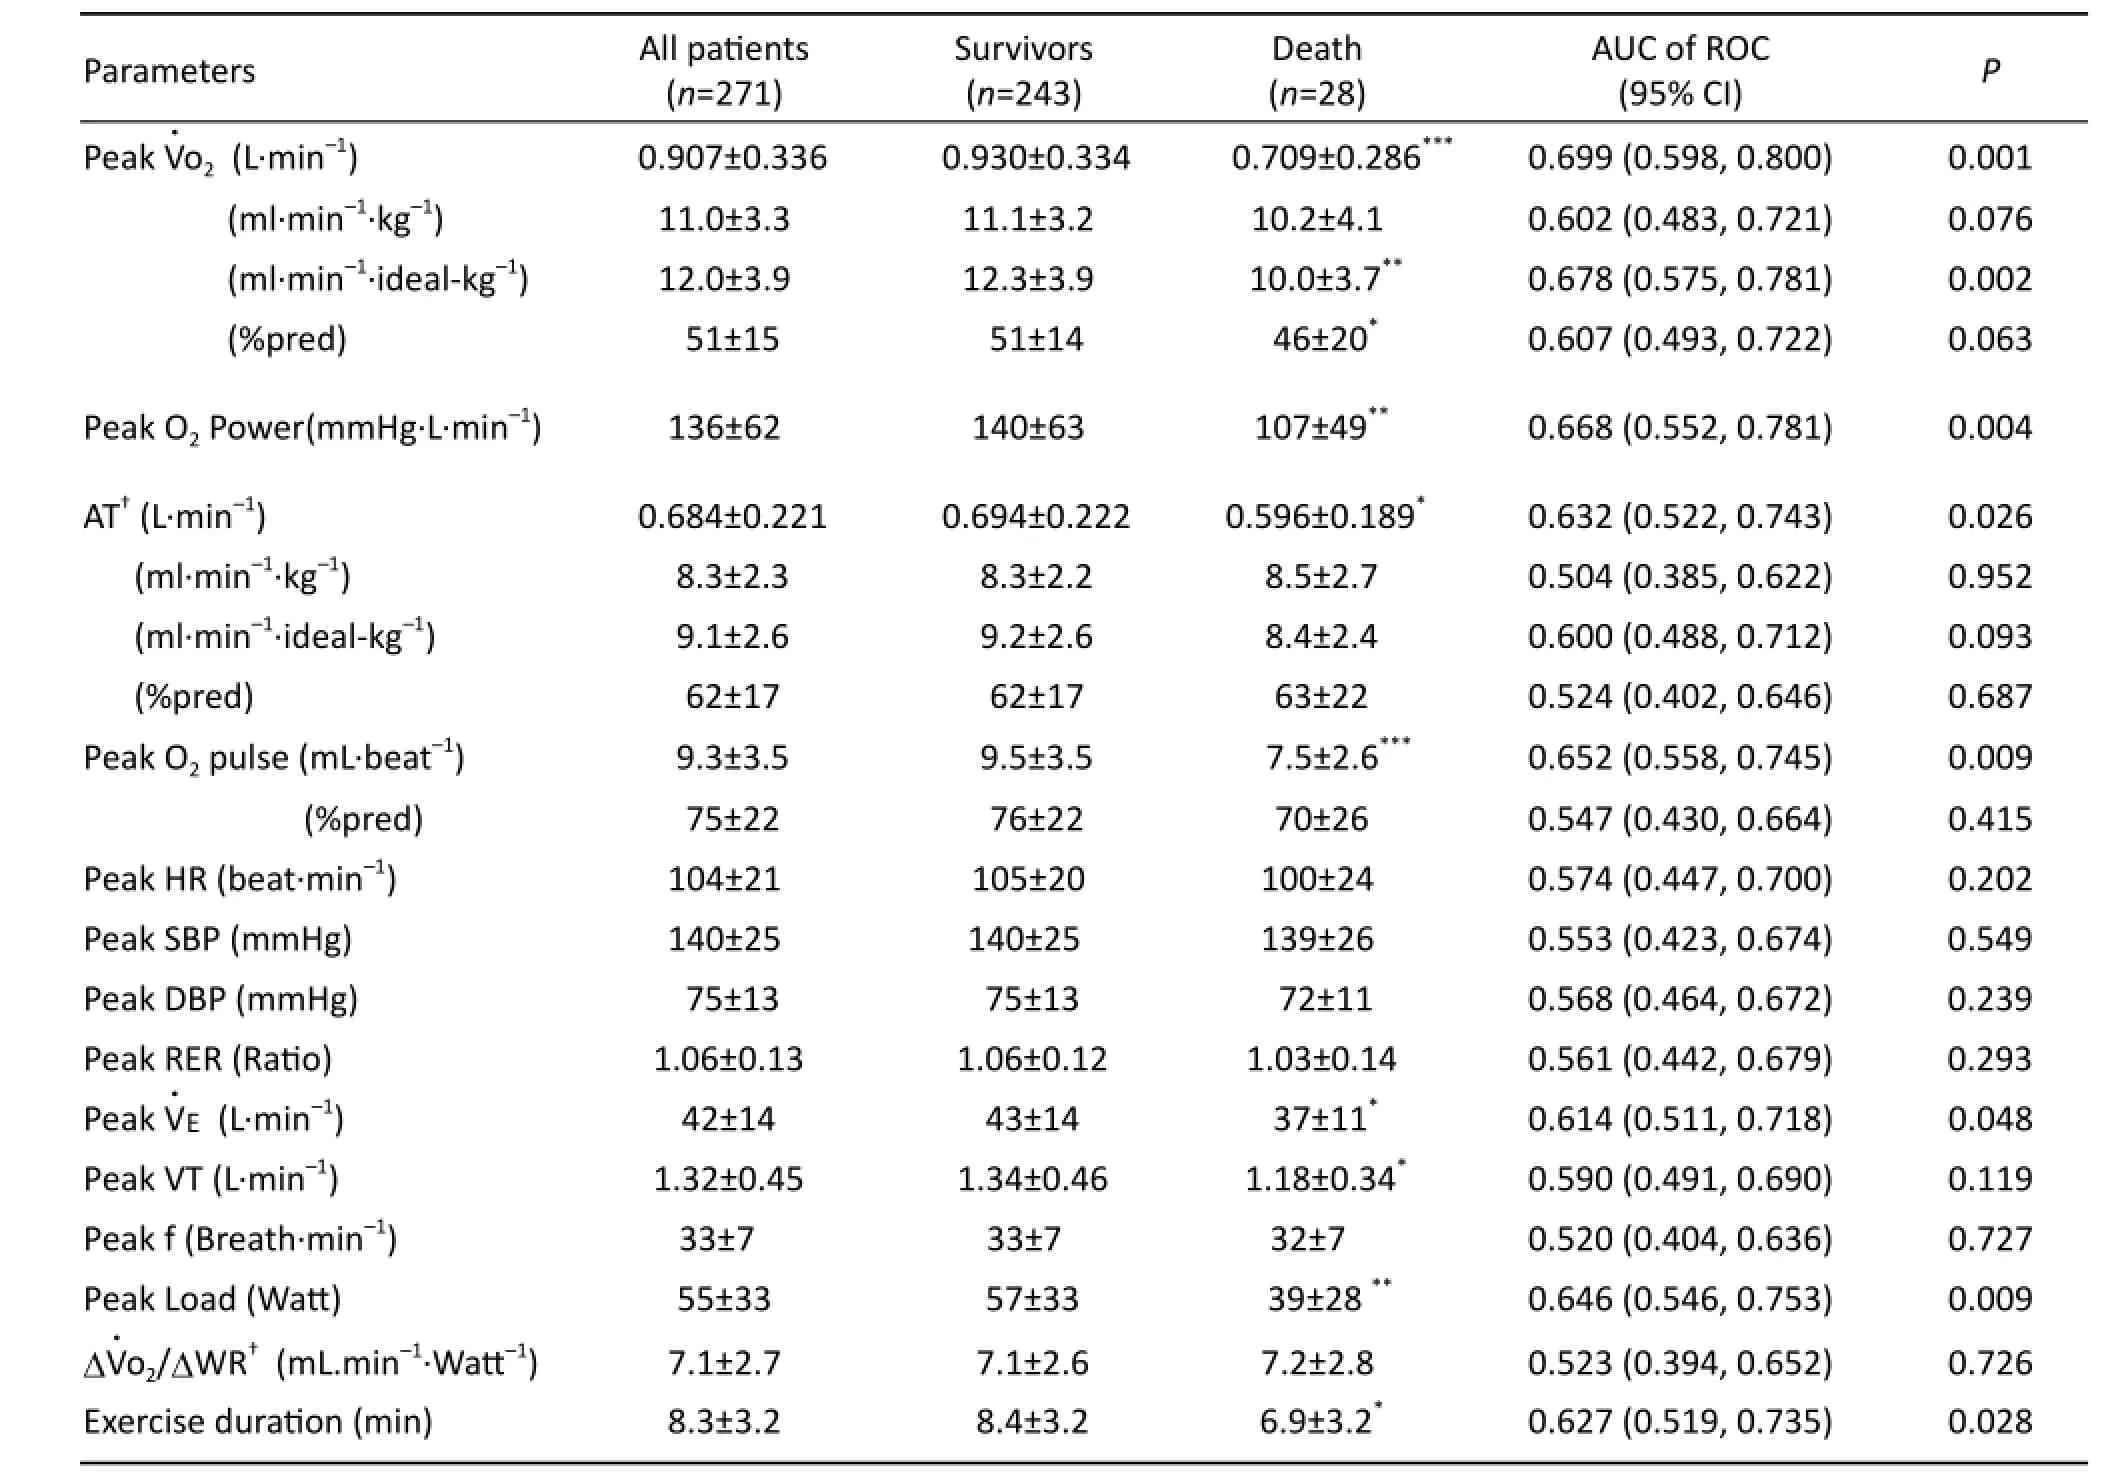
Tab. 2 CPET variables other than ventilation-CO2output for longer term death/survival prognosis in CHF patients.
Only 12 patients completed their CPET during the 3 minute unloaded/warm-up period. 202 performed more than 3 minutes ramp testing and hadΔWR calculations (183 survivors and 19 deaths). In 260 tests the AT could be satisfactorily detected. Table 2 show the differences between groups and AUC of ROC survival/death analysis of common CPET measurements. The peakand AT were 51±14%pred and 62±17%pred respectively. PeakAT, peak O2pulse, peakpeak work load, and exercise duration dif f ered signif i cantly between survival and death groups (P<0.05). Survival and death differences of HR, SBP, MAP, DBP, RPP, RER and RR at peak exercise and their AUC were not statistically signif i cant (P>0.05).
Ventilation-CO2output relationships
Table 3, Figure 2A, 2B show the dif f erences between survival and death groups and AUC of ROC survival/ death analysis of measurements of ventilatory inef fi ciency during CPET. As shown in Table 3, CHF patients had elevated absolute values and high %pred ratios for2at all stages of exercise.e lowestandwere 41±9 and 43±10. At all time periods, theratios di ff ered between survival and death groups (P<0.05) with significant AUC (P≤0.002).e highest AUC (0.712) was lowestor highestthe next highest AUC (0.708) wasat AT (P<0.001).
Although the absolute and %pred values ofslopes at each time measured were high, and dif f ered signif i cantly between survival and mortality groups. All slopes ofhad a lower AUC than comparable related ratios ofdue to the effect of their intercepts. Only theintercept below AT dif f ered signif i cantly (P<0.05) between the survivors and deaths.slope to VCP was 38±12 and 126±41 %pred.e AUC values ofslopes were high to low in the following order from start to: VCP (0.701,P<0.001), AT(0.684,P<0.01); unloaded (0.662,P<0.01); and peak exercise (0.624,P<0.05).

Tab. 3 Ventilation-CO2output measurements for long term death/survival prognosis in CHF patients.
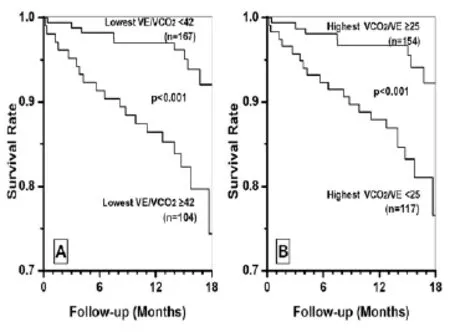
Fig. 2 Kaplan-Meier survival curves of lowestUsing the best cutoff value, the Cox regression risky ratio step wiseonly picked up the absolute ratio of lowestVco2with 42 as cutoff (P<0.001). After that step, all other ratios and slopesnon-significant (P>0.05). The patients with lowesta significantly higher survival ratewith lowest≥42 (P<0.001). The highestin ml/L had similar prognosis (P<0.001).

Tab. 4 The absolute and relative key measurements of CPET and ventilation-CO2output for early death/survival prognosis in 6 months.
Percent predicted values nearly always had lower AUC than absolute values.e relative %pred of lowest(141±30 %pred),@AT (145±35 %pred) andslope (126±41 %pred) had signif i cant AUC (P<0.002).e AUC values (0.698, 0.695 and 0.694) of %pred lowest@AT andslope were relatively lower than those of the absolute, but non-significant (P>0.05).
When combining the best cutof f values for all absolute and %pred of dif f erent ratios, slopes, and intercepts, Cox regression risky likelihood ratio step wise automatic selection only picked up the lowest(P=0.001). After that selection, all other measures became non-signif i cant (P>0.05). Kaplan-Meier survival curves of lowestand <42, and highestand≥25 were signif i cantly dif f erent as shown in Figure 2A, B (P=0.001) .
Table 4 shows the AUC of ROC analysis for six months death/survival prognosis of several other often used measurements. Thus, in CHF patients, the lowestratio had a higher AUC (0.751,P<0.001) than resting cardiac output, peakor the bestslope. For longer term death/ survival, the AUC values for all measurements tended to be lower than those of early death/survival. Interestingly, in longer time death/survival AUC analyses, %pred values tended to higher AUC than their absolute values. For 6 months, the highest AUC was 0.807 (P<0.0001) for the %pred lowestThe Cox regression step wise selection only picked up the %pred lowestwith best cutoff of 155%pred (P<0.001), after which all others became non-signif i cant (P>0.05).
Discussion
Clinical importance of ventilatory inefficiency in CHF prognosis.
It is clear from this and other studies that exercise tests, particularly peak gas exchange measurements, e.g. peakand peak O2pulse, are important prognosticators in patients with left and right heart failure[1, 5, 6, 8-16, 37, 38, 47]. The AT, occurring during moderate rather than maximal exercise, is also very useful in categorizing fi tness and prognosis, but cannot always be identif i ed [22, 29, 39] and has more variability than peak measurements even in experienced hands[48].
Physiology and pathophysiology of ventilation-CO2output relationships in Normal and CHF
As demonstrated in a subject depicted in Figures 1 B, 1C and our previous work [31]as unloaded exercise begins, the increase in(by Fick principle, equal to cardiac output times mixed venous and systemic arterial O2content dif f erences) exceeds the increase in total ventilation, so that theratio increases and theratio declines. Then thedeclines further up to the AT as perfusion and mixed venous CO2contents continue to rise more than ventilation. Shortly after the AT,rises during heavy exercise because the lactateinduced metabolic acidosis increases ventilation (to eliminate excess CO2and minimize acidemia) more than the(product of cardiac output and mixed-venous to systemic arterial CO2differences) can increase.us, the lowestand highestvalues are likely to be found in younger, taller, fi tter men[32]. with higherand lowervalues in those with more severe CHF.
The reasons why absolute ratios are better than %pred values for a longer term prognostication (see Tab.3, Fig.2) is obscure but may relate to the absence of a large number of deaths (Tab.4).
The advantages and disadvantages forandratio in clinical practice
Why do the slope and ratio values dif f er?
It all relates to the intercept value. When the slope ofgoes through the origin (0,0), the slope (Fig.1A, D) and ratio (Fig.1B, E) values are equal. When they do not, they dif f er.e ratio, as a single value, slightly better ref f ects the relationship between the two variables. When magnified plots ofslopes are visualized (Fig.1A, D), it is clear that the relationships are never truly linear throughout a single CPET. Furthermore, the decline and later rise inratios during a CPET indicates that the relationship is rarely linear, even though r values of the correlation betweenare very high. The slope is calculated from the linear regression, i.e.intercept+slope×So the relationship ofis related by two variables, slope and intercept (Fig.1). For CHF patients regression analyses, the intercepts were positive value (3±4) except slightly smaller using entire CPET data (Tab.3).ere are many studies for slope. However, there was none of slope study to report the intercept and to discuss the ef f ect of intercept on the slope analysis. Ratio is the only variable for the relationship ofat that time period, but ratios are changed and dif f erent at dif f erent time period of CPET. We found that the values around AT and aer (or above) AT are more stable and predictable in normal subjects [32]and they have more prognostic power for early death [24, 29]. When the linear regression forced to go to origin, the slope is same as the ratio (Fig.1A).at maybe the explanation for entire slope is better predictor in the reports[34, 35]. Unfortunately there was none of investigation to fully compare the dif f erent ratios and slopes for dif f erent CPET data analysis yet.
Limitations
Small number of patients. Only about 2 years’ follow-ing up is not long enough? Some trend did not reach the statistic signif i cance, so the trendency of absolute better for long term and %pred normalization is better for short term prognosis need to be conf i rmed by future study.
Conclusion
Since, from a path-physiological point of view, so-called “ventilatory inefficiency” is higher in patients with CHF, this increase inin CHF is primarily and causally related to “perfusion insufficiency” type of “mismatching perfusionventilaion”. Over peaketc common used CPET key measures, lower lowestratio values, occurring just aer the AT, allowed the best predictor of longevity in this series of CHF patients.
Acknowledgements
1. Wasserman K, Hansen JE, Sue DY,et al. Principles of exercise testing and interpretation[M]. 5th Edition. Philadelphia: Lippincott Williama, Wilkins, 2011.
2. Wasserman K. Cardiopulmonary exercise testing and cardiovascular health[M]. Armonk (NY): Futura Publishing Co Inc, 2002.
3. Guazzi M, Myers J, Arena R. Cardiopulmonary exercise testing in the clinical and prognostic assessment of diastolic heart failure[J]. J Am Coll Cardiol, 2005, 46(10): 1883-1890.
4. Kleber FX, Vietzke G, Wernecke KD,et al. Impairment of ventilatory ef fi ciency in heart failure prognostic impact[J]. Circulation, 2000, 101(24): 2803-2809.
5. Mancini DM, Eisen H, Kussmaul W,et al. Value of peak exercise oxygen consumption for optimal timing of cardiac transplantation in ambulatory patients with heart failure[J]. Circulation, 1991, 83(3): 778-786.
6. Mancini D, LeJemtel T, Aaronson K. Peaka simple yet enduring standard[J]. Circulation, 2000, 101(10): 1080-1082.
7. Metra M, Dei CL, Panina G,et al. Exercise hyperventilation chronic congestive heart failure, and its relation to functional capacity and hemodynamics[J]. Am J Cardiol, 1992, 70(6): 622-628.
9. Opasich C, Pinna GD, Bobbio M,et al. Peak exercise oxygen consumption in chronic heart failure: toward efficient use in the individual patient[J]. J Am Coll Cardiol, 1998, 31(4): 766-775.
10. Osman AF, Mehra MR, Lavie CJ,et al.e incremental prognostic importance of body fat adjusted peak oxygen consumption in chronic heart failure[J]. J Am Coll Cardiol, 2000, 36(7): 2126-2131.
11. Robbins M, Francis G, Pashkow FJ,et al. Ventilatory and heart rate responses to exercise better predictors of heart failure mortality than peak oxygen consumption[J]. Circulation, 1999, 100(24): 2411-2417.
12. Stelken AM, Younis LT, Jennison SH,et al. Prognostic value of cardiopulmonary exercise testing using percent achieved of predicted peak oxygen uptake for patients with ischemic and dilated cardiomyopathy[J]. J Am Coll Cardiol, 1996, 27(2): 345-352.
13. Stevenson LW, Steimle AE, Fonarow G,et al. Improvement in exercise capacity of candidates awaiting heart transplantation[J]. J Am Coll Cardiol, 1995, 25(1): 163-170.
14. Sullivan MJ, Higginbotham MB, Cobb FB. Increased exercise ventilation in patients with chronic heart failure: Intact ventilatory control despite hemodynamic and pulmonary abnormalities[J]. Circulation, 1988, 77(3): 552-559.
15. Wasserman K. Measures of functional capacity in patients with heart failure[J]. Circulation, 1990, 81(1 Suppl: II): 1-4.
16. Wasserman K, Zhang YY, Gitt A,et al. Lung function and exercise gas exchange in chronic heart failure[J]. Circulation, 1997, 96(7): 2221-2227.
17. Arena R, Humphrey R. Comparison of ventilatory expired gas parameters used to predict hospitalization in patients with heart failure[J]. Am Heart J, 2002, 143(3): 427-432.
18. Arena R, Myers J, Hsu L,et al.e minute ventilation/ carbon dioxide production slope is prognostically superior to the oxygen uptake ef fi ciency slope[J]. J Card Fail, 2007, 13(6): 462-469.
19. Chase PJ, Kenjale A, Cahalin LP,et al. Ef f ects of respiratory exchange ratio on the prognostic value of peak oxygen consumption and ventilatory ef fi ciency in patients with systolic heart failure[J]. JACC Heart Fail, 2013, 1(5): 427-432.
20. Chua TP, Ponikowski P, Harrington D,et al. Clinical correlates and prognostic signif i cance of the ventila-tory response to exercise in chronic heart failure[J]. J Am Coll Cardiol, 1997, 29(7): 1585-1590.
21. Francis DP, Shamim W, Davies LC,et al. Cardiopulmonary exercise testing for prognosis in chronic heart failure: Continuous and independent prognostic value fromslope and peakEur Heart J, 2000, 21(2): 154-161.
22. Gitt AK, Wasserman K, Kilkowski C,et al. Exercise anaerobic threshold and ventilatory ef fi ciency identify heart failure patients for high risk of early death[J]. Circulation, 2002, 106(24): 3079-3084.
23. Johnson RL. Gas exchange efficiency in congestive heart failure II[J]. Circulation, 2001, 103(7): 916-918.
24. Myers J, Arena R, Oliveira RB,et al. The lowestratio during exercise as a predictor of outcomes in patients with heart failure[J]. J Card Fail, 2009, 15(9): 756-762.
25. Nanas SN, Nanas JN, Sakellariou DC,et al.slope is associated with abnormal resting haemodynamics and is a predictor of long-term survival in chronic heart failure[J]. Eur J Heart Fail, 2006, 8(4): 420-427.
26. Ponikowski P, Francis DP, Piepoli MF,et al. Enhanced ventilatory response to exercise in patients with chronic heart failure and preserved exercise tolerance marker of abnormal cardiorespiratory reflex control and predictor of poor prognosis[J]. Circulation, 2001, 103(7): 967-972.
27. Ribeiro JP, Stein R, Chiappa GR. Beyond peak oxygen uptake: New prognostic markers from gas exchange exercise tests in chronic heart failure[J]. J Cardiopulm Rehabil, 2006, 26(2): 63-71.
28. Stringer WW, Hansen JE, Wasserman K. Cardiac output estimated noninvasively from oxygen uptake during exercise[J]. J Appl Physiol, 1997, 82(3): 908-912.
29. Sun XG, Hansen JE, Beshai JF,et al. Oscillatory breathing and exercise gas exchange abnormalities prognosticate early mortality and morbidity in heart failure[J]. J Am Coll Cardiol, 2010, 55(17): 1814-1823.
30. Sun XG, Hansen JE, Stringer WW,et al. Carbon dioxide pressure-concentration relationship in arterial and mixed venous blood during exercise[J]. J Appl Physiol, 2001, 90(5): 1798-1810.
31. Hansen JE, Sun XG, Stringer WW. A simple new visualization of exercise data discloses pathophysiology and severity of heart failure[J]. J Am Heart Assoc, 2012, 1(3): e001883.
32. Sun XG, Hansen JE, Garatachea N,et al. Ventilatory ef fi ciency during exercise in healthy subjects[J]. Am J Respir Crit Care Med, 2002, 166(11): 1443-1448.
33. Arena R, Humphrey R, Peberdy MA. Prognostic ability ofslope calculations using di ff erent exercise test time intervals in subjects with heart failure[J]. Eur J Cardiovasc Prev Rehabil, 2003, 10(6): 463-468.
34. Ingle L, Goode K, Carroll S,et al. Prognostic value of theslope calculated from different time intervals in patients with suspected heart failure[J]. Int J Cardiol, 2007, 118(3): 350-355.
35. Tabet JY, Beauvais F, Thabut G,et al. A critical appraisal of the prognostic value of theslope in chronic heart failure[J]. Eur J Cardiovasc Prev Rehabil, 2003, 10(4): 267-272.
36. Sun XG, Hansen JE, Ting H,et al. Comparison of exercise cardiac output by the fi ck principle using oxygen and carbon dioxide[J]. Chest J, 2000, 118(3): 631-640.
37. Sun XG, Hansen JE, Oudiz RJ,et al. Exercise pathophysiology in patients with primary pulmonary hypertension[J]. Circulation, 2001, 104(4): 429-435.
38. Wasserman K, Sun XG, Hansen JE. Ef f ect of biventricular pacing on the exercise pathophysiology of heart failure[J]. Chest J, 2007, 132(1): 250-261.
39. Sun XG, Hansen JE, Stringer WW. Oxygen uptake ef fi ciency plateau: Physiology and reference values[J]. Eur J Appl Physiol, 2012, 112(3): 919-928.
40. Sun XG, Hansen JE, Stringer WW. Oxygen uptake effi ciency plateau best predicts early death in heart failureoxygen uptake e ffi ciency: Early death predictor[J]. Chest J, 2012, 141(5): 1284-1294.
41. Beaver WL, Wasserman K, Whipp BJ. A new method for detecting anaerobic threshold by gas exchange[J]. J Appl Physiol, 1986, 60(6): 2020-2027.
42. Glantz A. Primer of bio-statistics[M]. 4th edition, New York: McGraw-Hill, 1997.
43. Hanley JA, McNeil BJ. A method of comparing the areas under receiver operating characteristic curves derived from the same cases[J]. Radiology, 1983, 148(3): 839-843.
44. Nguyen TT, Adair LS, He K,et al. Optimal cutof f values for overweight: Using body mass index to predict incidence of hypertension in 18-to 65-year-old chinese adults[J]. J Nut, 2008, 138(7): 1377-1382.
45. Warner RM. Applied statistics: From bivariate through multivariate techniques[M].ousand Oaks, California: Sage publications, 2008.
46. Glantz A, Slinker B. Primer of applied regression and analysis of variance[M]. New York, NY: McGraw-Hill Book co., 1990.
47. Oudiz RJ, Midde R, Hovenesyan A,et al. Usefulness of right-to-leshunting and poor exercise gas exchange for predicting prognosis in patients with pulmonary arterial hypertension[J]. Am J Cardiol, 2010, 105(8): 1186-1191.
48. Hansen JE, Sun XG, Yasunobu Y,et al. Reproducibility of cardiopulmonary exercise measurements in patients with pulmonary arterial hypertension[J]. Chest J, 2004, 126(3): 816-824.
Xing-guo SUN, MD and Sheng-Shou Hu, MD, State Key Laboratory of Cardiovascular Disease, Fuwai Hospital, National Center for Cardiovascular Diseases, Chinese Academy of Medical Sciences and Peking Union Medical College, Beijing 100037, China. Tel: 86-10-88398300; E-mail: xgsun@labiomed.org
Received 2015-09-23; accepted 2015-10-16
杂志排行

中国应用生理学杂志的其它文章
- A mini review: Tau transgenic mouse models and olfactory dysfunction in Alzheimer’s Disease
- Ethical inspection about laboratory animals
- Association between endothelial nitric oxide synthase (ENOS) G894T polymorphism and high altitude (HA) adaptation: a meta-analysis
- Flow cytometric analysis of circulating microvesicles derived from myocardial ischemic preconditioning and cardioprotection of ischemia/reperfusion injury in rats
- Synergisms of cardiovascular effects between iptakalim and amlodipine, hydrochlorothiazide or propranolol in anesthetized rats
- Effects of curcumin on sodium currents of dorsal root ganglion neurons in type 2 diabetic neuropathic pain rats