Numerical Simulation of Typhoon Muifa (2011) Using a Coupled Ocean-Atmosphere-Wave-Sediment Transport (COAWST) Modeling System
2015-04-05LIUNaLINGTiejunWANGHuiZHANGYunfeiGAOZhiyiandWANGYi
LIU Na, LING Tiejun, WANG Hui, ZHANG Yunfei, GAO Zhiyi, and WANG Yi
Key Laboratory of Research on Marine Hazards Forecasting,National Marine Environmental Forecasting Center,Beijing100081,P. R. China
Numerical Simulation of Typhoon Muifa (2011) Using a Coupled Ocean-Atmosphere-Wave-Sediment Transport (COAWST) Modeling System
LIU Na*, LING Tiejun, WANG Hui, ZHANG Yunfei, GAO Zhiyi, and WANG Yi
Key Laboratory of Research on Marine Hazards Forecasting,National Marine Environmental Forecasting Center,Beijing100081,P. R. China
The newly developed Coupled Ocean-Atmosphere-Wave-Sediment Transport (COAWST) Modeling System is applied to investigate typhoon-ocean interactions in this study. The COAWST modeling system represents the state-of-the-art numerical simulation technique comprising several coupled models to study coastal and environmental processes. The modeling system is applied to simulate Typhoon Muifa (2011), which strengthened from a tropical storm to a super typhoon in the Northwestern Pacific, to explore the heat fluxes exchanged among the processes simulated using the atmosphere model WRF, ocean model ROMS and wave model SWAN. These three models adopted the same horizontal grid. Three numerical experiments with different coupling configurations are performed in order to investigate the impact of typhoon-ocean interaction on the intensity and ocean response to typhoon. The simulated typhoon tracks and intensities agree with observations. Comparisons of the simulated variables with available atmospheric and oceanic observations show the good performance of using the coupled modeling system for simulating the ocean and atmosphere processes during a typhoon event. The fully coupled simulation that includes a ocean model identifies a decreased SST as a result of the typhoon-forced entrainment. Typhoon intensity and wind speed are reduced due to the decrease of the sea surface temperature when using a coupled ocean model. The experiments with ocean coupled to atmosphere also results in decreased sea surface heat flux and air temperature. The heat flux decreases by about 29% compared to the WRF only case. The reduction of the energy induced by SST decreases, resulting in weakening of the typhoon. Coupling of the waves to the atmosphere and ocean model induces a slight increase of SST in the typhoon center area with the ocean-atmosphere interaction increased as a result of wave feedback to atmosphere.
COAWST modeling system; typhoon Muifa; WRF; ROMS; SWAN
1 Introduction
Tropical Cyclones (TC) strongly interact with the ocean dynamically and thermodynamically through the exchanges of momentum, heat, and moisture fluxes across the air-sea interface. For a positive feedback process, as TC intensifies, larger wind speeds increase the evaporation rate and supply more latent heat to drive the TC. Strong turbulent mixing developed under high wind conditions causes a decrease in the sea surface temperature (SST) due to entrainment of the cooler waters from the thermocline into the mixed layer (Price, 1981; Benderet al., 1993). This cooling SST, in turn, provides a negative feedback mechanism on TC intensity (Schade and Emanuel, 1999; Bosartet al., 2000; Chanet al., 2001; Linet al., 2005). The sea surface waves and sea spray have significant impacts on wind stress and air-sea momentum and heat fluxes (Donelan, 1990; Johnsonet al., 1998;Drennanet al., 2003). On the other hand, wind stress contributes to the generation of surface waves and forcing the local ocean currents (Doyle, 2002). To investigate various air-sea interaction processes, it is necessary to employ a coupled ocean-atmosphere-wave modeling system to investigate the development of a TC.
Three-dimensional (3D) coupled atmosphere-ocean models have been developed to consider and predict the interactions between a TC and the ocean (Baoet al., 2000; Bender and Ginis, 2000; Benderet al., 2007; Chenet al., 2007). To investigate wave-current interaction, previous studies developed a wave-current coupled modeling system which incorporates depth dependent radiation stress, surface and bottom shear stresses (Xieet al., 2001, 2008, 2009). More recently, 3-way ocean-atmosphere-wave coupled models are developed to investigate various physical process interactions. Fanet al.(2009) identified the significant impact of interaction on air-sea momentum flux and ocean response using a coupled wind waveocean model. Using a newly developed coupled modeling system, Warneret al.(2010) identified the model sensitiv-ity by exchanging prognostic variable fields between model components. Liuet al.(2011) developed a coupled atmosphere-wave-ocean modeling system (CAWOMS) which takes into account various physical effects including wave state and sea-spray-affected sea surface roughness, sea spray heat fluxes, and dissipative heating in atmosphere-wave coupling.
In this paper, a numerical simulation is performed employing the newly developed Coupled Ocean-Atmosphere-Wave-Sediment Transport (COAWST) Modeling System as described in Warneret al.(2010). The effects of the atmosphere-ocean-wave coupling on intensity and track of TC are explored based on numerical simulation of Typhoon Muifa (2011) over the Northwestern Pacific. The paper is organized as follows. A brief description of individual model components in the coupled modeling system is presented in Section 2. Section 3 describes the model settings and experiment design. Verification of model with observations and analyses for the application results are presented in Section 4. Summary and conclusions are given in Section 5.
2 Model Description
The COAWST Modeling System, described in detail by Warneret al.(2010), is comprised of several components including models for the ocean, atmosphere, sea surface waves, sediment transport and a coupler to exchange data fields to improve hurricane forecasting and investigate coastal processes and environment. It represents the state-of-the-art numerical coupled models. The COAWST Modeling System has been applied in examining coastal processes at regional scales (Olabarrietaet al., 2011, 2012; Kumaret al., 2012). The model components, improvements to individual components, and the coupler are described below.
The ocean model used in the COAWST is the Regional Ocean Modeling System (ROMS), a general class of free surface, terrain-following numerical models that solve the three dimensional Reynolds-averaged Navier-Stokes equations (RANS) using the hydrostatic and Boussinesq approximations (Shchepetkin and McWilliams, 2005; Haidvogelet al., 2008). ROMS uses finite-difference approximations on a horizontal curvilinear Arakawa C grid and on a vertical stretched terrain-following coordinate. Momentum and scalar advection and diffusive processes are solved using transport equations and an equation of state is used to compute the density field that accounts for temperature, salinity, and suspendedsediment contributions. ROMS offers a range of structures that allow various choices for model components such as advection schemes, turbulence closures, bottom- and surface-boundary layer submodels, ecosystem sub-models, and an adjoint model for computing model inverses and data assimilation. The sediment modeling components from the Community Sediment Transport Modeling System (CSTMS) (Warneret al., 2008) are integrated into the ROMS model. The sediment routines consist of algorithms for suspended-sediment transport, bed load transport by current and wave-current forcing, enhanced bottom stress due to surface waves, a multiple bed model to track stratigraphy, morphology, and the ability to transport multiple sediment classes.
The atmospheric model component in the coupled system is the Advanced Research Weather Research and Forecasting (WRF) Model (ARW) (Skamarocket al., 2005). It is a nonhydrostatic, quasi-compressible atmospheric model with boundary layer physics schemes and a variety of physical parameterizations of sub-grid scale processes for predicting meso- and microscales of motion. WRF utilizes Arakawa-C grid, and it uses a terrainfollowing hydrostatic pressure coordinate system in the vertical. WRF incorporates various physical processes including microphysics, cumulus parameterization, planetary boundary layer, surface layer, land surface, and longwave and shortwave radiations, with multiple options available for each process. It has been used extensively for operational forecasts as well as for realistic and idealized research experiments. In the COAWST Modeling System, WRF code is modified to provide an enhanced bottom roughness when computing the bottom stress over the ocean (Warneret al., 2010).
The wave model is Simulating WAves Nearshore (SWAN). SWAN is a spectral wave model specifically designed for shallow water that solves the wave action balance equation in both spatial and spectral spaces. SWAN simulates wind wave generation and propagation in coastal waters considering various source and sink terms including refraction, diffraction, shoaling, wavewave interactions, and dissipation terms. Wave characteristics such as significant wave height can be obtained from the wave action in the governing equation.
The coupler used in COAWST coupling system is the Model Coupling Toolkit (MCT) (Larsonet al., 2004; Jacobet al., 2005) that allows the transmission and transformation of various distributed data between component models using a parallel coupled approach. During model initialization each model decomposes its own domain into sections that are distributed to processors assigned for that component. Each grid section on each processor initializes with MCT and MCT identifies the distribution of model components on all the processors. MCT can then determine the grid distributions. During execution the models will advance in time until they reach a user- defined synchronization point. At that time each model fills its attribute vector to exchange prognostic variables through MCT to other models. The variables that are exchanged between each model are detailed in Warneret al.(2010) and are summarized here. The atmosphere model provides 10-m surface winds to the wave model. Ocean model receives heat fluxes and momentum flux computed by the atmosphere model. This approach assures consistent momentum and heat flux exchanges between the atmosphere and the ocean. The ocean model provides SST to the atmosphere model and provides surface currents, free surface elevation, and bathymetry to the wave model. The wave model provides significant wave height and wave length to the atmosphere and the ocean models. Theatmosphere model uses these wave values to compute an enhanced sea surface roughness. The wave model also provides to the ocean model wave direction, surface and bottom periods, percent wave breaking, wave energy dissipation, and bottom orbital velocity.
3 Model Application
The COAWST modeling system is applied to investigate atmosphere and ocean dynamics of Typhoon Muifa. It was a large, strong, and persistent typhoon. Typhoon Muifa originated in the Northwest Pacific on July 23rd. Early on July 28, it gradually drifted to the west and turned north near Philippines. At 08:00 on July 30, Muifa was upgraded into a severe tropical storm; it had rapidly strengthened from a tropical storm to a super typhoon twice and the storm sustained winds reached 260 km h-1. Then, it drifted straight northward, weakening steadily until it curved to the west again. The storm gradually moved northward and was finally downgraded into a severe tropical storm on August 7. After weakening to a tropical storm, Muifa made landfall as tropical storm. All the simulations in this study were initialized to start with a model time of August 2, 2011.
3.1 Atmospheric Model Setup
The atmospheric model WRF is initialized on the 2nd August 2011 using initial and boundary conditions from the National Centers for Environmental Prediction (NCEP) Global Forecast Model (GFS) 0.5 degree NCEP Final Analysis (FNL) data with a 6 hourly time resolution. In this study, WRF model is employed with a horizontal resolution of 15 km, and 30 sigma levels. The WRF model with horizontal resolution of 15 km is capable of resolving the typhoon with small diameters of several tens of kilometers. The WRF model domain is shown in Fig.1. Modification of large scale atmosphere background following application of the high-resolution grid is necessary for the simulating the typhoon system. We applied the spectral nudging (von Storchet al., 2000) on temperature, horizontal winds and geopotential height at upper layer (k〉10) towards global NCEP Final Analysis data. The nudging coefficients for all variables are set to be 0.0003 s-1, which means the relaxation time is about 1 hour. The wave number is set to be 3 in both directions, so the zonal and meridional waves with wave lengths above 2000 km are nudged. Nudging is conducted every 6 hours during the whole simulation time.
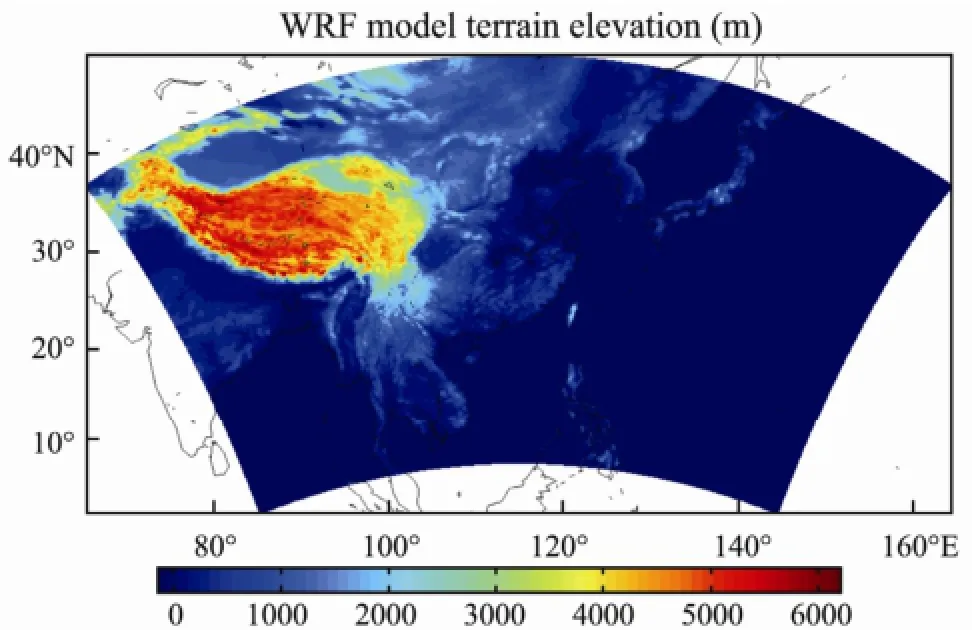
Fig.1 Model domain and the terrain elevation in atmosphere model WRF.
3.2 Hydrodynamic Module
In this application, ROMS adopted the same horizontal grid as WRF of approximately 15 km horizontal resolution with 40 vertically stretched layers (Fig.2). The ROMS model with this horizontal resolution is able to resolve the mesoscale oceanic characters which might influence the typhoon intensity. By applying the same grid in WRF and ROMS models, there’s no need to interpolate data on different grids, and hence the time for transmission of regridded data between models components is reduced.
The vertical stretching parameters were selected in order to have the first Sigma layer no deeper than 10 m. The hydrodynamic model was initialized on the 2nd August 2011 using the fields of currents, depth-averaged currents, water level, salinity, and temperature derived from outputs of global HYbrid Coordinate Ocean Model (HYCOM) simulation (GLBa0.08) from the Naval Research Laboratory. The lateral boundary conditions for currents, salinity, and temperature are obtained from the same database. Initial conditions for the ocean model will be obtained by running ROMS for a steady state, which will be a subject of future study. Data assimilation is not included in the hydrodynamic model simulation. It would be difficult to investigate the physical interactions if strong data assimilation is introduced. River runoff was not considered in this study. Open boundaries used Flather boundary condition (Flather, 1976) for the barotropic currents to allow the free propagation of wind-generated currents and tides.
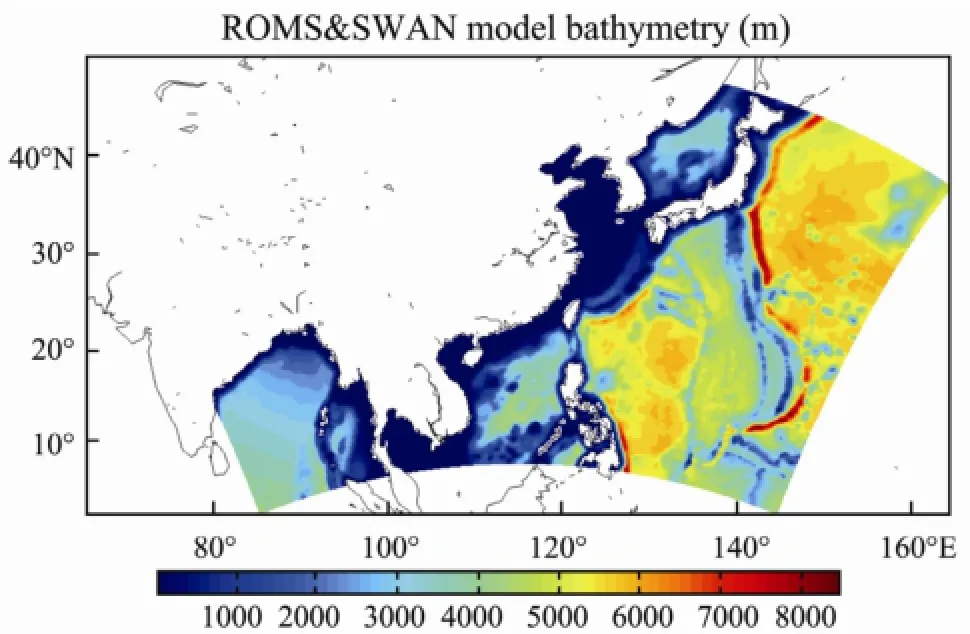
Fig.2 Model domain and the bathymetry in ocean model ROMS.
3.3 Wave Module
In this study, SWAN is run in the same grid as ROMS. Initial conditions for the wave model are obtained by running the model for a steady state simulation using GFS 0.5 degree winds. The boundary conditions for this initial stationary steady state simulation and the non-stationarysimulation are set to 0. In this specific model setting, the baroclinic time step used in ROMS was 300 s with a time splitting ratio of 30. SWAN ran with a 300 s time step, and WRF ran with a 25s time step. The data interchange between the models occurred every 3600 s.
4 Results and Discussion
The atmosphere-ocean-wave interactions are examined with three configurations. 1) Fully coupled: the fully coupled system with fields exchanged between all three models, WRF-ROMS-SWAN. 2) WRF-ROMS: The system with WRF and ROMS coupled. 3) WRF: Only WRF model with a constant SST of the initial SST from ROMS model, no feedback from ocean to atmosphere.
4.1 Typhoon Tracks and Intensity
Fig.3 shows the best track obtained from the China Meteorological Administration for Typhoon Muifa along with tracks computed by the different numerical simulations. The typhoon tracks agree well between different runs, and in general, they agree with the observation. As we applied the spectral data assimilation in WRF model, large-scale reasonable atmospheric characters are included. This agrees with previous studies that large-scale processes determine the tropical cyclone track forecast (Marks and Shay, 1998). By increasing the model interactions and allowing coupling to the ocean model, the SST becomes lower and more realistic. Consequently, the upper ocean mesoscale structure of typhoon is also changed, resulting in the path deviation.
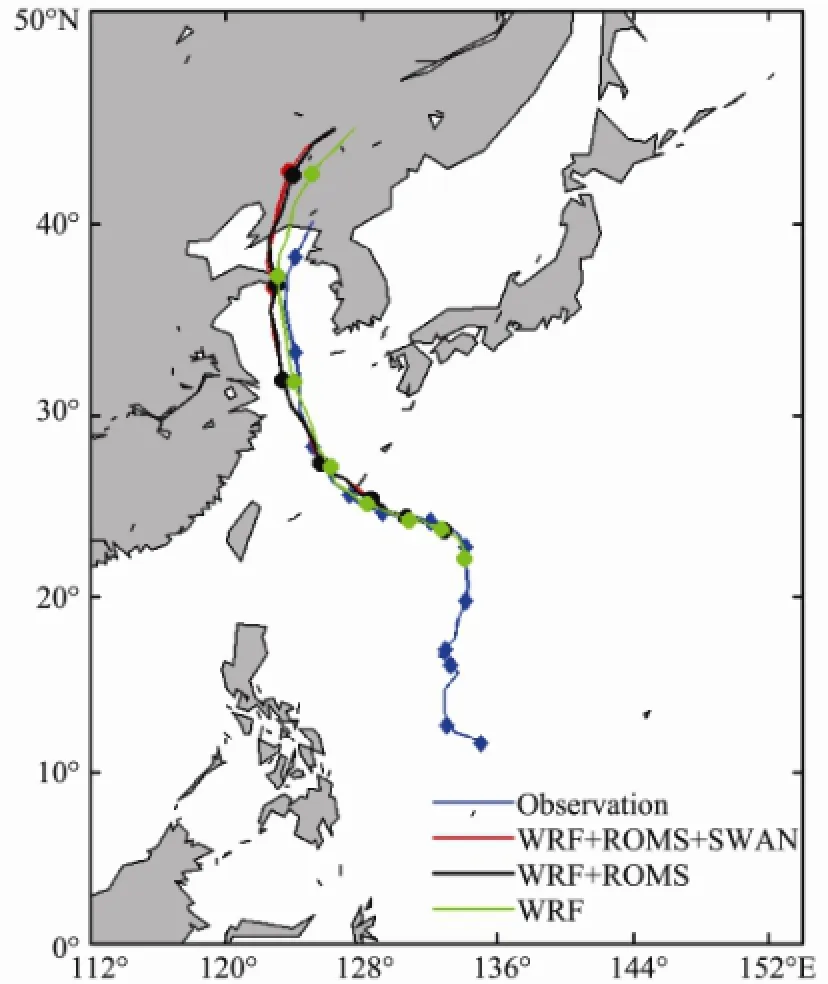
Fig.3 Typhoon path for the observed and three model scenarios.
Results comparing the typhoon intensities are shown in Fig.4. The intensity along the observed path (blue line) starts at approximately 945 hPa on 2 August and decreases to nearly 990 hPa on 8 August 1200. All the model intensities start at 973.7 hPa on 2 August. Simulations using the GFS 0.5 degree grid data for initial conditions yielded typhoons that are weak. For the WRFROMS case (black line) and the fully coupled case the intensities are approximately 5-30 hPa weaker than observation (blue line). The intensity is not reduced significantly although the waves are introduced to ROMS in the fully coupled case (red line). The WRF only case (green line) intensifies to approximately 940 hPa and then decreases before landfall. The intensity simulated in the WRF only case is more intense than observation (blue line) after 4 August.
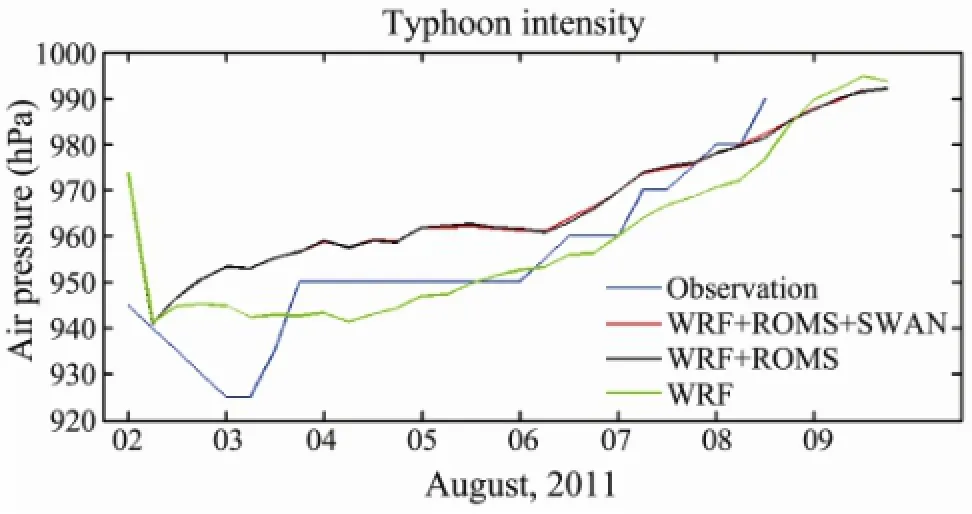
Fig.4 Typhoon intensity for the observed and three model scenarios.
4.2 Pressure and Wind Fields
Fig.5 shows the sea level pressure derived from WRF model simulation. These results indicate the path of Muifa from August 2 to 10 at 00 hour. It shows a minimum pressure on the 2nd of August. On August 3, the center of Muifa is at 132.8°E, 24.1°N, with the central pressure of more than 940 hPa. On August 6, the center of Muifa is at 126°E, 27°N, with the central pressure of 950 hPa. Muifa moved far away from China’s east coastal area and moved northward rapidly. Fig.6 shows wind vectors and intensities from the 2nd to the 10th of August from WRF with interaction between the ocean and wave modules. These results show the propagation of Typhoon Muifa through the Northwest Pacific, decreasing in intensity.
4.3 Buoy Comparison
The simulated variables from all the three cases are compared with observations from a buoy near the coast (Fig.7). The buoy station QF207L is located at 124°E, 29°N, in the middle of the East China Sea. It shows no obvious differences among the simulations compared with observations. The buoy began to show the impact of propagating typhoon on August 5. The buoy observation has a peak near 0600 of the 6th. The buoy QF207L is close to the track and the observation peaks just before the hurricane passes. For all three cases the magnitudes of wind speed and sea level pressure are in general agree ment with the observations; and the timing of the peak is consistent. In Fig.7 the winds from the WRF only simula-tion are too strong near Aug 06 noon, whereas the coupled simulations do show a decrease and then a strengthening in the wind speed during this time, which is more consistent with the observations. The air temperature isslightly higher than observation when typhoon is passing by. The SST from the fully coupled case and WRF-ROMS coupled cases are almost the same. Wave height from the fully coupled case agrees well with the observations in both magnitude and timing. Compared with the buoy observation, the COAWST model performs well in simulating typhoon around China coast areas.
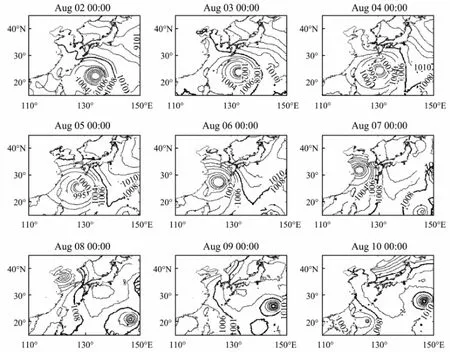
Fig.5 Spatial distribution of the sea level pressure (hPa) computed in fully coupled case from August 2 to 10 at 00 hour.
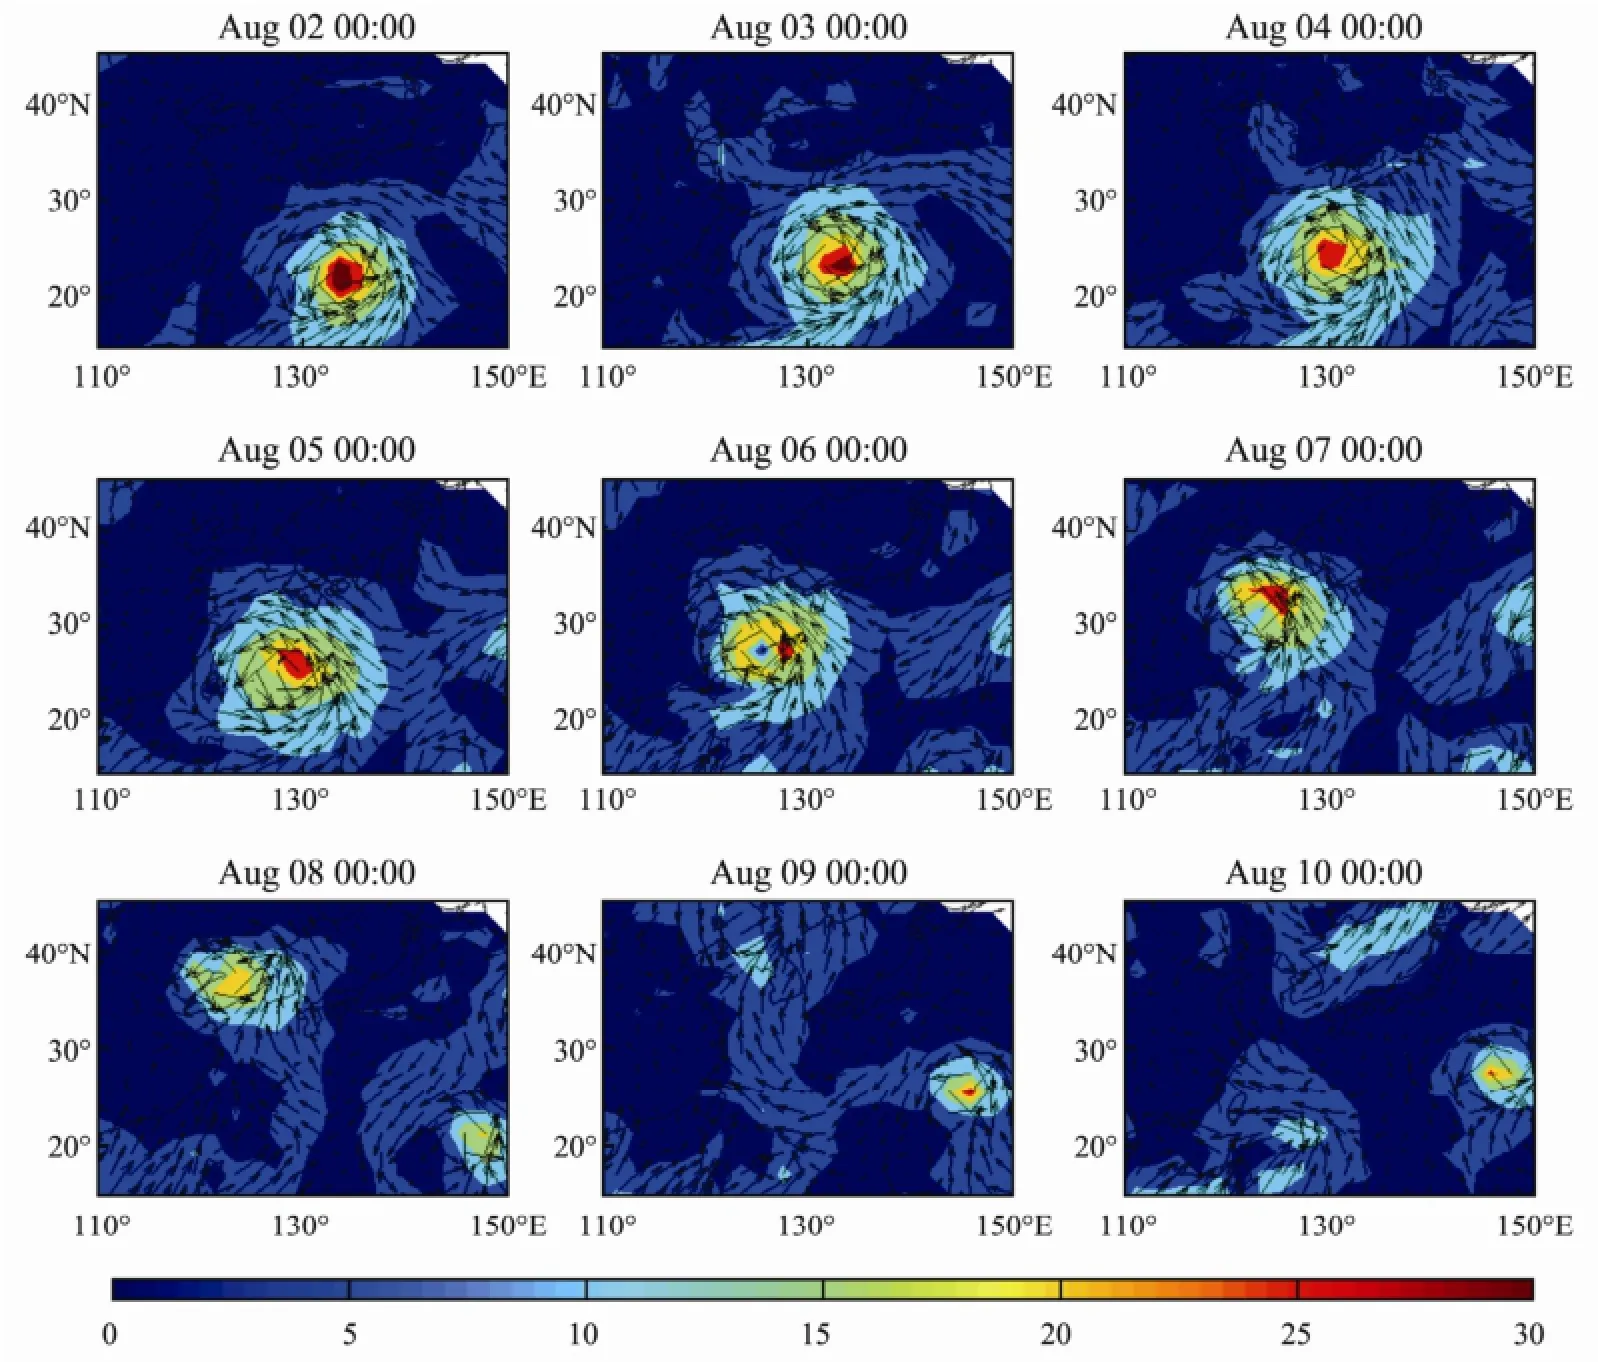
Fig.6 Same as Fig.5 but for wind speed (m s-1) and direction.
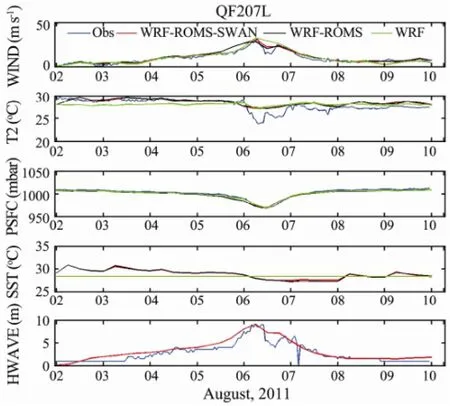
Fig.7 Comparison of measured and computed time series in QF207L station.
4.4 Oceanic Status and Wave Results
Fig.8 is the SST from ROMS model simulation in the fully coupled case. On August 3rd, the SST provided by COAWST correctly reproducs the SST front position east of the Kuroshio. As the tropical cyclone intensifies, strong turbulent mixing is induced by increasing wind stress in the upper ocean. The SST decreases significantly along the path of Typhoon Muifa due to entrainment of the cooler water into the mixed layer. In this study, the SST decreases by 1℃ to 3℃. Before typhoon arriving, the SST in the maximum cooling center is 29.5℃, while it decreases to 26.7℃ after the passage of Muifa. The maximum cooling exceeds 3℃. This is consistent with the maximum SST response of -3℃ predicted by Price (1981) using historical air-sea data and a three- dimensional numerical ocean model. Numbers of studies (Priceet al., 1994; Shayet al., 2000) indicate that upwelling and entrainment play an important role to the upper ocean response. Benderel al.(1993) summarized the average cooling for three groups of tropical cyclones of 5.38, 3.58 and 1.88℃, respectively. The amount of SST cooling under the passage of typhoon will significantly reduce the heat and moisture fluxes at the sea surface, which plays an important role in the typhoon evolution.
One of the direct consequences of wind blowing over the ocean is the energy or momentum transfer from the atmosphere to the water, which generates wind waves. Fig.9 shows the spatial distribution of significant wave heights in the fully coupled run for different periods during the Typhoon Muifa. Two different significant wave height maxima can be observed. One represents waves generated during the passage of Muifa, and the other represents those generated after August 8th. On August 3, the maximum wave height exceeds 10m during the passage of Muifa.

Fig.8 Same as Fig.5 but for sea surface temperature (℃).
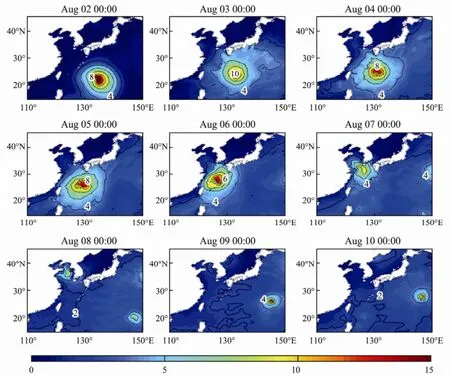
Fig.9 Same as Fig.5 but for significant wave height (m).
4.5 Sensitivity to the Air-Sea Coupling
We now investigate the sensitivity of air-sea coupling in different model coupling scenarios. The simulated variables along the typhoon track vary significantly between the different coupling configurations (Fig.10). In the first 24 h of integration, the 10 m wind speeds (U10) in the coupled cases are reduced by reaching up to 2 m s-1with respect to WRF only case. In the WRF only case, atmospheric simulation is forced by a constant SST taken as the initial SST from ROMS and does not have a SST update. As a result, the typhoon simulated by WRF is driven by too warm SST but it does not induce sea surface cooling. In the fully coupled and WRF-ROMS coupled cases, when allowing SST feedback, the SST along the typhoon track which forced WRF becomes colder by up to 2℃ (Fig.10c). Therefore, the 2 m air temperature (T2) is adjusted consequently, becoming also colder with respect to WRF only case (Fig.10b). Additionally, ocean feedback induces a smaller air-sea temperature difference which is associated with sensible heat flux. Along the storm track, the air-sea temperature gradient (T2-SST) is larger in the fully coupled case and WRF-ROMS coupled case compared to the WRF only case. This indicates that more sensible heat flux is released to the atmosphere in the coupled cases.
The latent and sensible heat fluxes transferred from ocean to atmosphere are an important energy source for the development of typhoon. Previous studies showed that the exchanged air-sea heat flux has important influence on the typhoon intensity (Zhuet al., 2004; Zhu and Zhang, 2006). The latent heat flux released to the atmosphere simulated in the fully coupled case is smaller than that in the WRF only case. Compared to the WRF only case, the SST decreases more in the fully coupled case. This causes a less release of latent heat flux with the air-sea interaction included in the fully coupled case. After integration to 1800 UTC 04 August, the sensible heat flux decreases noticeably in the typhoon center due to the coupling effect. The heat fluxes are influenced by the wave state through surface momentum flux. The decrease of SST and the sea surface roughness together produce a decrease of sensible latent heat flux in the coupled cases (Figs.11d-e).
The impact of the wave feedback to the atmosphere and ocean on the simulation is assessed by comparing fully coupled case and WRF-ROMS coupled case, respectively. The differences of variables between the fully coupled case and WRF-ROMS coupled case can be either positive or negative. And the differences are noticeable in the typhoon center. Indeed, the differences of SST and wave-caused roughness have a direct impact on the wind field. Fig.12a provides comparisons between the 10 m wind speeds at 1800 UTC 04 August 2011. In the fully coupled simulation, SST is warmer around typhoon center, but colder outside typhoon in the East China Sea. There are two main competing processes driving the response of models to the wave feedback. On one hand, the sea-state induced roughness changes the drag coefficient and decreases the momentum flux. This decreases the 10 m windspeed and, at the same time, induces more ocean vertical mixing and heat fluxes (Fig.13d) and therefore a less cooling of SST. On the other hand, the overall weakening of the winds has a negative feedback on the momentum flux estimation, which reduces cooling of SST.
The differences of simulated variables between WRFROMS coupled case and WRF only case are much larger than the differences shown in Fig.12. This indicates that the ocean plays an important role in the coupling processes. The SST simulated in the WRF-ROMS coupled case averaged over typhoon center area is overall up to 3℃ lower than the WRF only case, while the central pressure is approximately 30 hPa higher by comparing to the WRF only simulation. And the heat flux decreases by 230 W m-2, which is reduced by about 29% compared to the WRF only case. That means for the SST decrease of 1℃, the simulations indicate a decrease of 10 hPa for central pressure. This interaction between ocean and atmosphere produces a reduction in surface wind speeds in WRF-ROMS coupled case (shown in Fig.13a). The effect of local SST cooling on typhoon intensity is comparable with the theoretical estimates based on Emanuel (1988) and Holland (1997). And this decrease of central pressure induced by the decrease of SST is consistent with the model result shown in Cione and Uhlhorn (2003) and Zhu and Zhang (2006).
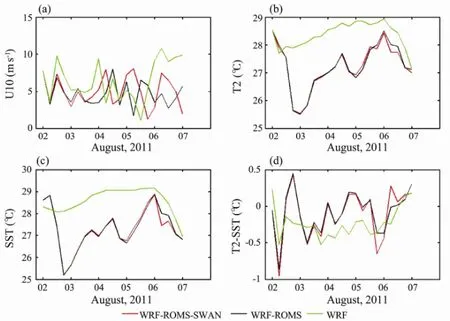
Fig.10 Variables along typhoon track for three model scenarios. (a) 10 m wind speed (U10), (b) 2 m air temperature (T2), (c) sea surface temperature and (d) difference between T2 and SST derived from WRF.
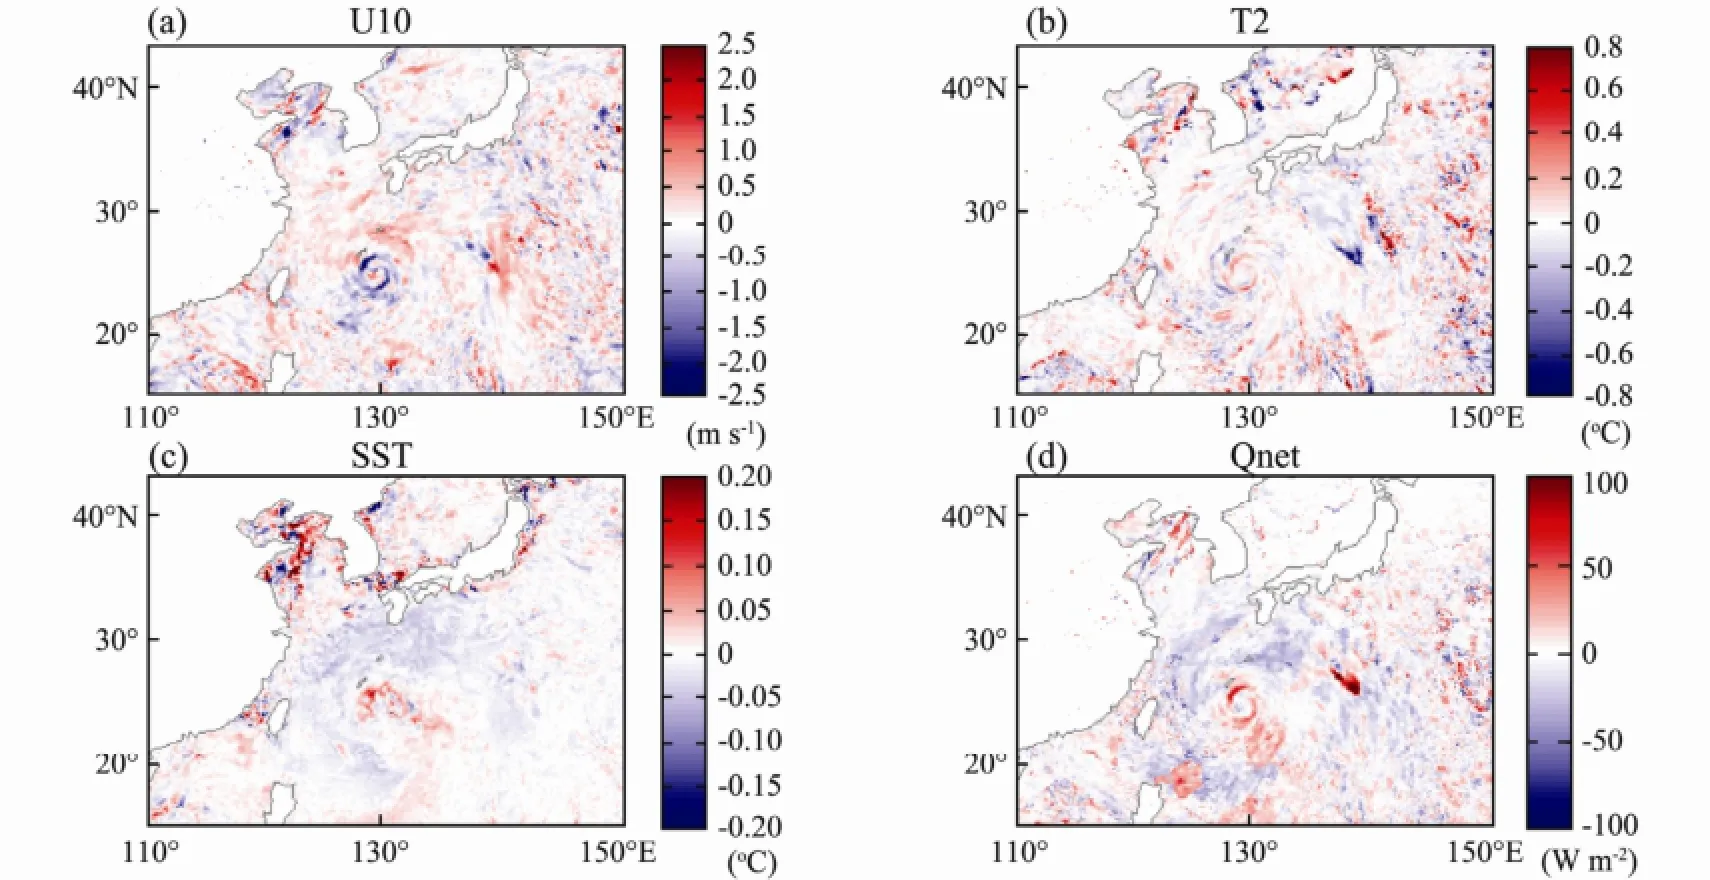
Fig.12 Differences of simulated (a) 10 m wind speed (U10), (b) 2 m air temperature (T2), (c) sea surface temperature and (d) net surface heat flux at 1800 UTC 04 August 2011 between fully coupled case and WRF-ROMS coupled case.
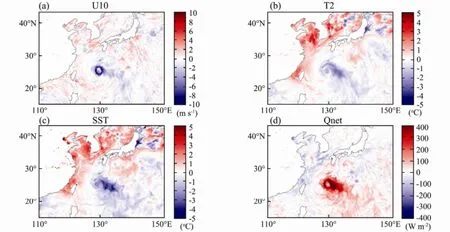
Fig.13 Differences of simulated (a) 10 m wind speed (U10), (b) 2 m air temperature (T2), (c) sea surface temperature and (d) net surface heat flux at 1800 UTC 04 August 2011 between WRF-ROMS coupled case and WRF only case.
5 Summary and Conclusions
In this study, we carried out coupled and uncoupled experiments using the newly developed Coupled Ocean-Atmosphere-Wave-Sediment Transport (COAWST) Modeling System to study the exchange between the atmosphere, ocean and waves. The modeling system is applied to simulate Typhoon Muifa (2011) in the Northwestern Pacific to explore the effect of the atmosphere-ocean-wave coupling on typhoon intensity and track. The ocean model and wave model have 15 km uniform resolution, which matches the horizontal resolution of the atmosphere model in its grid. The atmosphere-ocean-wave interactions are examined with three configurations with different coupling configurations. The simulated typhoon tracks and intensities agree with the observed. By comparing the simulated variables with the buoy observations, the COAWST modeling system provides effective performance in simulating typhoon around China coastal areas. The fully coupled scenario confirms that the atmosphere-ocean-wave coupled models improve the realism of the simulation.
Model sensitivity of exchanging variable fields among different model components are examined by three coupling configurations. The impact of the waves and other oceanic variables on the simulation is assessed by comparing the differences of simulated variables between three coupled configurations. The simulated variables along the typhoon track vary significantly in different coupling configurations. The fully coupled simulations with ocean model included identify a stronger surface wake signature than the WRF only simulation. In the fully coupled case, the amount of SST cooling under thepassage of typhoon significantly reduces the heat flux at the sea surface, and it plays an important role in the typhoon evolution. Typhoon intensity and wind speed are reduced when coupled to the ocean model due to the decrease of the SST. The overall decrease of the wind speed has a negative feedback on the momentum flux estimation. The reduction of the energy induced by SST decrease results in weakening of the typhoon. Coupling of the waves to the atmosphere and ocean models induces slight increase of SST in the typhoon center area with the ocean-atmosphere interaction enhanced as a result of wave feedback to atmosphere. Analysis shows that the SST simulated in the fully coupled case is 3℃ lower than the WRF only case, while the central pressure is 30 hPa higher when comparing to the WRF only simulation. And the heat flux decreases by 230 W m-2, which is reduced by about 29% compared to the WRF only case. Future efforts will focus on improving the initial conditions for WRF and ROMS models. And the physical parameterization will be improved to better understand the coupling processes.
Acknowledgements
The authors are grateful to Dr. John C. Warner for his help in setting up the COAWST modeling system at the beginning. The authors appreciate Mr. Xueming Zhu and Dr. Xiang Li for their valuable comments and suggestion on this work. They would also like to express their appreciation to Dr. Benxia Li for providing the buoy observation data and Mr. Jianyong Xing for providing the typhoon best track data. This research is supported by the Public Science and Technology Research Funds Projects of Ocean 201105018 and the National Natural Science Foundation of China 41106023.
Bao, J-W., Wilczak, J. M., Choi, J-K., and Kantha, L. H., 2000. Numerical simulations of air-sea interaction under high wind conditions using a coupled model: A study of hurricane development.Monthly Weather Review, 128: 2190-2210.
Bender, M. A., and Ginis, I., 2000. Real-case simulations of hurricane-ocean interaction using a high-resolution coupled model: Effects on hurricane intensity.Monthly Weather Review, 128: 917-946.
Bender, M. A., Ginis, I., and Kurihara, Y., 1993. Numerical simulations of tropical cyclone-ocean interaction with a highresolution coupled model.Journal of Geophysical Research, 98: 23245-23263.
Bender, M. A., Ginis, I., Tuleya, R., Thomas, B., and Marchok, T., 2007. The operational GFDL coupled hurricane-ocean prediction system and a summary of its performance.Monthly Weather Review, 135: 3965-3989.
Bosart, L. F., Velden, C. S., Bracken, W. E., Molinari, J., and Black, P. G., 2000. Environmental influences on the rapid intensification of Hurricane Opal (1995) over the Gulf of Mexico.Monthly Weather Review, 128: 322-352.
Chan, J., Duan, Y., and Shay, L., 2001. Tropical cyclone intensity change from a simple ocean-atmosphere coupled model.Journal of the Atmospheric Sciences, 58: 154-172.
Chen, S. S., Price, J. F., Zhao, W., Donelan, M. A., and Walsh, E. J., 2007. The CBLAST-Hurricane program and the nextgeneration fully coupled atmosphere-wave-ocean models for hurricane research and prediction.Bulletin of the American Meteorological Society, 88: 311-317.
Cione, J., and Uhlhorn, E., 2003. Sea surface temperature variability in hurricanes: Implications with respect to intensity change.Monthly Weather Review, 131: 1783-1795.
Donelan, M. A., 1990. Air-sea interaction. In:The Sea. LeMehaute, B., and Hanes, D. M., eds. Wiley and Sons: Ocean Engineering Science, 9: 239-292.
Doyle, J. D., 2002. Coupled atmosphere-ocean wave simulations under high wind conditions.Monthly Weather Review, 130: 3087-3099.
Drennan, W. M., Graber, H. C., Hauser, D., and Quentin, C., 2003. On the wave age dependence of wind stress over pure wind seas.Journal of Geophysical Research, 108, 8062, DOI:10.1029/2000JC000715.
Emanuel, K., 1988. Toward a general theory of hurricanes.American Scientist, 76: 371-379.
Fan, Y., Ginis, I., and Hara, T., 2009. The effect of wind-wavecurrent interaction on air-sea momentum fluxes and ocean response in tropical cyclones.Journal of Physical Oceanography, 39: 1019-1034.
Flather, R. A., 1976. A tidal model of the north-west European continental shelf.Memoires de la Societe Royale des Sciences de Liege, 6 (10): 141-164.
Haidvogel, D. B., Arango, H., Budgell, W. P., Cornuelle, B. D., Curchitser, E., Di Lorenzo, E., Fennel, K., Geyer, W. R., Hermann, A. J., Lanerolle, L., Levin, J., McWilliams, J. C., Miller, A. J., Moore, A. M., Powell, T. M., Shchepetkin, A. F., Sherwood, C. R., Signell, R. P., Warner, J. C., and Wilkin, J., 2008. Ocean forecasting in terrain-following coordinates:Formulation and skill assessment of the Regional Ocean Modeling System.Journal of Computational Physics, 227:3595-3624.
Holland, G. J., 1997. The maximum potential intensity of tropical cyclones.Journal of the Atmospheric Sciences. 54: 2519-2541.
Jacob, R., Larson, J., and Ong, E., 2005. M×N communication and parallel interpolation in CCSM using the model coupling toolkit. Preprint ANL/MCSP1225-0205. Mathematics and Computer Science Division, Argonne National Laboratory, 25pp.
Johnson, H. K., Hojstrup, J., Vested, H. J., and Larsen, S. E., 1998. On the dependence of sea surface roughness on wind waves.Journal of Physical Oceanography, 28: 1702-1716.
Kumar, N., Voulgaris, G., Warner, J. C., and Olabarrieta, M., 2012. Implementation of the vortex force formalism in the coupled ocean-atmosphere-wave-sediment transport (COAWST) modeling system for inner shelf and surf zone applications.Ocean Modelling, 47: 65-95.
Larson, J., Jacob, R., and Ong, E., 2004. The model coupling toolkit: A new Fortran90 toolkit for building multiphysics parallel coupled models. Preprint ANL/MCSP1208-1204. Mathematics and Computer Science Division, Argonne National Laboratory, 25pp.
Lin, I.-I., Wu, C.-C., Emanuel, K. A., Lee, I.-H., Wu, C.-R., and Pun, I.-F., 2005. The interaction of supertyphoon Maemi (2003) with a warm ocean eddy.Monthly Weather Review, 133: 2635-2649.
Liu, B., Liu, H., Xie, L., Guan, C., and Zhao, D., 2011. A coupled atmosphere-wave-ocean modeling system: Simulation ofthe intensity of an idealized tropical cyclone.Monthly Weather Review, 139: 132-152.
Marks, F., and Shay, L. K., 1998. Landfalling tropical cyclones:Forecast problems and associated research opportunities:Report of the 5th prospectus development team to the US weather research program.Bulletin of the American Meteorological Society, 79: 305-323.
Olabarrieta, M., Warner, J. C., and Kumar, N., 2011. Wavecurrent interaction in Willapa Bay.Journal of Geophysical Research, 116, C12014, DOI: 10.1029/2011JC007387.
Olabarrieta, M., Warner, J. C., Armstrong, B., Zambon, J. B., and He, R., 2012. Ocean-atmosphere dynamics during hurricane Ida and Nor’Ida: An application of the coupled ocean-atmosphere-wave-sediment transport (COAWST) modeling system,Ocean Modelling, 43-44: 112-137.
Price, J. F., 1981. Upper ocean response to a hurricane.Journal of Physical Oceanography, 11: 153-175.
Price, J. F., Sanford, T., and Forristall, G., 1994. Forced stage response to a moving hurricane.Journal of Physical Oceanography, 24: 233-260.
Schade, L. R., and Emanuel, K. A., 1999. The ocean’s effect on the intensity of tropical cyclones: Results from a simple coupled atmosphere-ocean model.Journal of the Atmospheric Sciences, 56: 642-651.
Shay, L., Goni, G., and Black, P., 2000. Effects of a warm oceanic feature on Hurricane Opal.Monthly Weather Review, 128:1366-1383.
Shchepetkin, A. F., and McWilliams, J. C., 2005. The regional ocean modeling system: A split-explicit, free-surface, topography-following coordinates ocean model.Ocean Modelling, 9: 347-404.
Skamarock, W. C., Klemp, J. B., Dudhia, J., Gill, D. O., Barker, D. M., Wang, W., and Powers, J. G., 2005.A Description of the Advanced Research WRF Version 2. NCAR Technical Note, NCAR/TN-468+STR.
von Storch, H., Langenberg, H., and Feser, F., 2000. A spectral nudging technique for spectral downscaling purposes.Monthly Weather Review, 128: 3664-3673.
Warner, J. C., Armstrong, B., He, R., and Zambon, J. B., 2010. Development of a coupled ocean-atmosphere-wave- sediment transport (COAWST) modeling system.Ocean Modelling, 35 (3): 230-244.
Warner, J. C., Sherwood, C. R., Signell, R. P., Harris, C. K., and Arango, H. G., 2008. Development of a three-dimensional, regional, coupled wave, current, and sediment-transport model.Computers & Geosciences, 34: 1284-1306.
Xie, L., Liu, B., Liu, H., and Guan, C., 2009. Numerical simulation of tropical cyclone intensity using an air-sea-wave coupled prediction system.Advances in Geosciences, 18: 19-43.
Xie. L., Liu, H., and Peng, M., 2008. The effect of wave-current interactions on the storm surge and inundation in Charleston Harbor during Hurricane Hugo 1989.Ocean Modelling, 20:252-269.
Xie, L., Wu, K., Pietrafesa, L., and Zhang, C., 2001. A numerical study of wave-current interaction through surface and bottom stresses: Wind-driven circulation in the South Atlantic Bight under uniform winds.Journal of Geophysical Research, 106: 16841-16855.
Zhu, H., Ulrich, W., and Smith, R., 2004. Ocean effects on tropical cyclone intensification and inner-core asymmetries.Journal of the Atmospheric Sciences, 61: 1245-1258.
Zhu, T., and Zhang, D., 2006. The impact of the storm-induced SST cooling on hurricane intensity.Advances in Atmospheric Sciences, 23 (1): 14-22.
(Edited by Xie Jun)
(Received June 6, 2013; revised December 19, 2013; accepted December 18, 2014)
© Ocean University of China, Science Press and Springer-Verlag Berlin Heidelberg 2015
* Corresponding author. E-mail: liuna@nmefc.gov.cn
杂志排行
Journal of Ocean University of China的其它文章
- Impacts of the Two Types of El Niño on Pacific Tropical Cyclone Activity
- Estimating the Turbulence Characteristics in the Bottom Boundary Layer of Monterey Canyon
- Composition and Origin of Ferromanganese Crusts from Equatorial Western Pacific Seamounts
- Hydroelastic Analysis of a Very Large Floating Structure Edged with a Pair of Submerged Horizontal Plates
- A Storm Surge Intensity Classification Based on Extreme Water Level and Concomitant Wave Height
- Synergetic Analysis and Possible Control of Vortex-Induced Vibrations in a Fluid-Conveying Steel Catenary Riser
