Research on assessing compression quality taking into account the space-borne remote sensing images*
2015-02-15HeHuaying赫华颖ZengYongWangWenyu
He Huaying (赫华颖), Zeng Yong, Wang Wenyu
(China Centre For Resources Satellite Data & Application, Beijing 100094, P.R.China)
Research on assessing compression quality taking into account the space-borne remote sensing images*
He Huaying (赫华颖)*, Zeng Yong, Wang Wenyu
(China Centre For Resources Satellite Data & Application, Beijing 100094, P.R.China)
According to the remote sensing image characteristics, a set of optimized compression quality assessment methods is proposed on the basis of generating simulative images. Firstly, a means is put forward that generates simulative images by scanning aerial films taking into account the space-borne remote sensing camera characteristics (including pixel resolution, histogram dynamic range and quantization). In the course of compression quality assessment, the objective assessment considers images texture changes and mutual relationship between simulative images and decompressed images, while the synthesized estimation factor (SEF) is brought out innovatively for the first time. Subjective assessment adopts a display setup — 0.5mm/pixel, which considers human visual characteristic and mainstream monitor. The set of methods are applied in compression plan design of panchromatic camera loaded on ZY-1-02C satellite. Through systematic and comprehensive assessment, simulation results show that image compression quality with the compression ratio of 4:1 can meet the remote sensing application requirements.
remote sensing images compression, images quality assessment, blocking standard variance, synthesized estimation factor (SEF), images display
0 Introduction
With the development of high resolution remote sensing satellites, the data amount of satellites storing and downloading is increasing sharply, which puts enormous pressure on the real-time downloading system. At present, lossy compression techniques are applied widely in the downloading system of high resolution remote sensing satellites. For example, as a high resolution commercial remote sensing satellite, IKONOS-2 uses the lossy compression technique with the compression ratio of 4.2:1 in its downloading system. Lossy compression may import fake information, such as blocking effect, noise, ring effect, ghost image, jaggies and fuzz. For space-borne remote sensing images compression, it is required generally that quality loss could not be perceived by vision. American NIMA has strict imagery transmission standard and compression standard[1].
Universal methods for assessing compression quality apply these indexes such as peak signal-to-noise ratio (PSNR) and mean square error (MSE) according to statistical parameters of images. PSNR and MSE are global parameters, and they only calculate relativity between pixels without considering scenery object characteristics and location information. So they may not accord with perceptive characteristic of human eyes, and can not reflect exactly descending of image quality. Recently, domestic and overseas scholars have made considerable headway on assessing compression quality. Ratchakit Sakuldee etc. propose a spatial frequency measurements (SFM) method[2]; Christophe Charrier etc. propose a maximum likelihood difference scaling (MLDS) method[3]; Donald Baile etc. propose a method of Measury the “strength” of the blocking artifacts[4]; Zianou Ahmed Seghir proposes edge-region information with distorted and displaced pixels measure method[5]; Zhu Haijun etc. propose explore band similarity with contrast sensitivity function (CSF) and mutual information method[6]; Zhang Hao etc. propose a method of marking the quality of decompressed images by percentage[7]. These methods have shortcomings of high computation complexity and poor maneuverability and only give consideration to general characteristics of images, but ignore specific properties of space-borne remote sensing images.
Standard images are used in general compression quality assessment internationally. For space-borne remote sensing cameras, images imaging at different time and different places may contain different surface features. During the phase of satellite design, it’s difficult to acquire real images which could reflect on-orbit status. So a typical standard remote sensing image is inexistent. This paper proposes a set of methods for assessing compression quality taking into account the space-borne remote sensing images. It contains simulative images generation, objective assessment and subjective assessment. The set of methods is applied in compression scheme design of panchromatic camera loaded on ZY-1-02C.
1 Simulative image generation
The input of the compression encoding device is usually image signals provided by the camera subsystem. So the simulative images for assessing compression quality should be similar to the input of compression encoding device as much as possible. Simulative image generation should obey the following constraint conditions:
(1) The pixel resolution and gray histogram dynamic range of simulative images should be in accordance with or be similar to that of the images generated by the camera subsystem observing real surface features as much as possible. It should take into account comprehensively the pixel resolution, modulation transfer function (MTF), band settings and quantization bits.
(2) The images that have been compressed once can not be the input of compression encoding device. Compression may cause image degradation[8]. The gray histogram of images which have been compressed once may be discontinuous. Instead, the gray histogram of images is continuous when the camera subsystem observes real surface features.
(3) The size of simulative images should be consistent with the input of compression encoding device. Otherwise, the simulative images should be cut off or jointed.
(4) Simulative images should reflect regional features and types of surface features, and also give consideration to imaging time phase.
(5) The number of images participating compression quality assessment should be above a certain number. It needs at least 6-10 images to insure the universality of assessment result.
The simulative images are generated by digital-scanning aerial films. Typical images are selected according to the above-mentioned constraint conditions. Specific operation steps are as follows:
(1) Simulative images contain the following surface features: cities, mountainous regions, coastal regions, deserts, lakes, vegetation etc.
(2) Setting scan aperture of a scanner makes pixel resolution values of simulative images in accordance with or similar to that of images generated by the camera subsystem when it observes real surface features. According to the similar triangle theory, pixel resolution = scan aperture/ flight scale.
(3) Gray average values of images rise with the enhancing of light source luminance of the scanner. Setting light source luminance of scanner could make histogram dynamic range of images in accordance with or similar to that of images generated by the camera subsystem when it observes real surface features.
(4) Setting quantization bits of the scanner makes quantization bits of images in accordance with that of images generated by camera subsystem when it observes real surface features.
With the P/MS camera loaded on ZY-1-02C as an example, the pixel resolution of panchromatic band is 2.36m, and quantization bit is 8. In order to reduce bandwidth of data downloading, the compression ratio is 4:1. When generating simulative images, scan aperture of a scanner is set according to flight scale in order to assure that the pixel resolution of simulative images is close to 2.36m. Set scan mode to panchromatic, and adjust the light source luminance of scanner in order to make histogram dynamic range (gray min 5%, gray max 5% and gray mean) of images similar to that of images generated by camera subsystem when it observes real surface features. The “gray min 5%” is defined as the gray value to which the accumulative histogram area from 0 is 5 percent of the total histogram area. And the “gray max 5%” is defined as the gray value to which the accumulative histogram area from 0 is 95 percent of the total histogram area. 8 images, which contain the following surface features: cities, farmland, vegetation, water substance, deserts etc., participate in the assessing experiment, as shown in Table 1 and Fig.1.
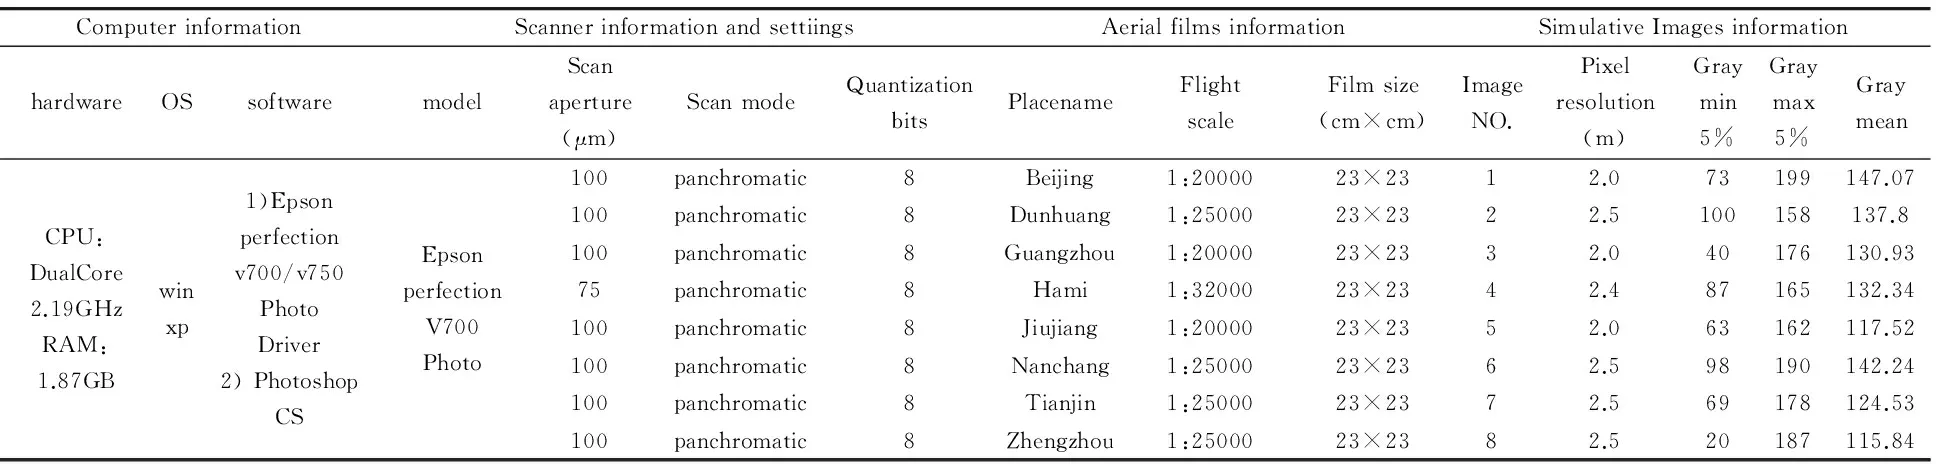
Table 1 The illustration of simulative images generation
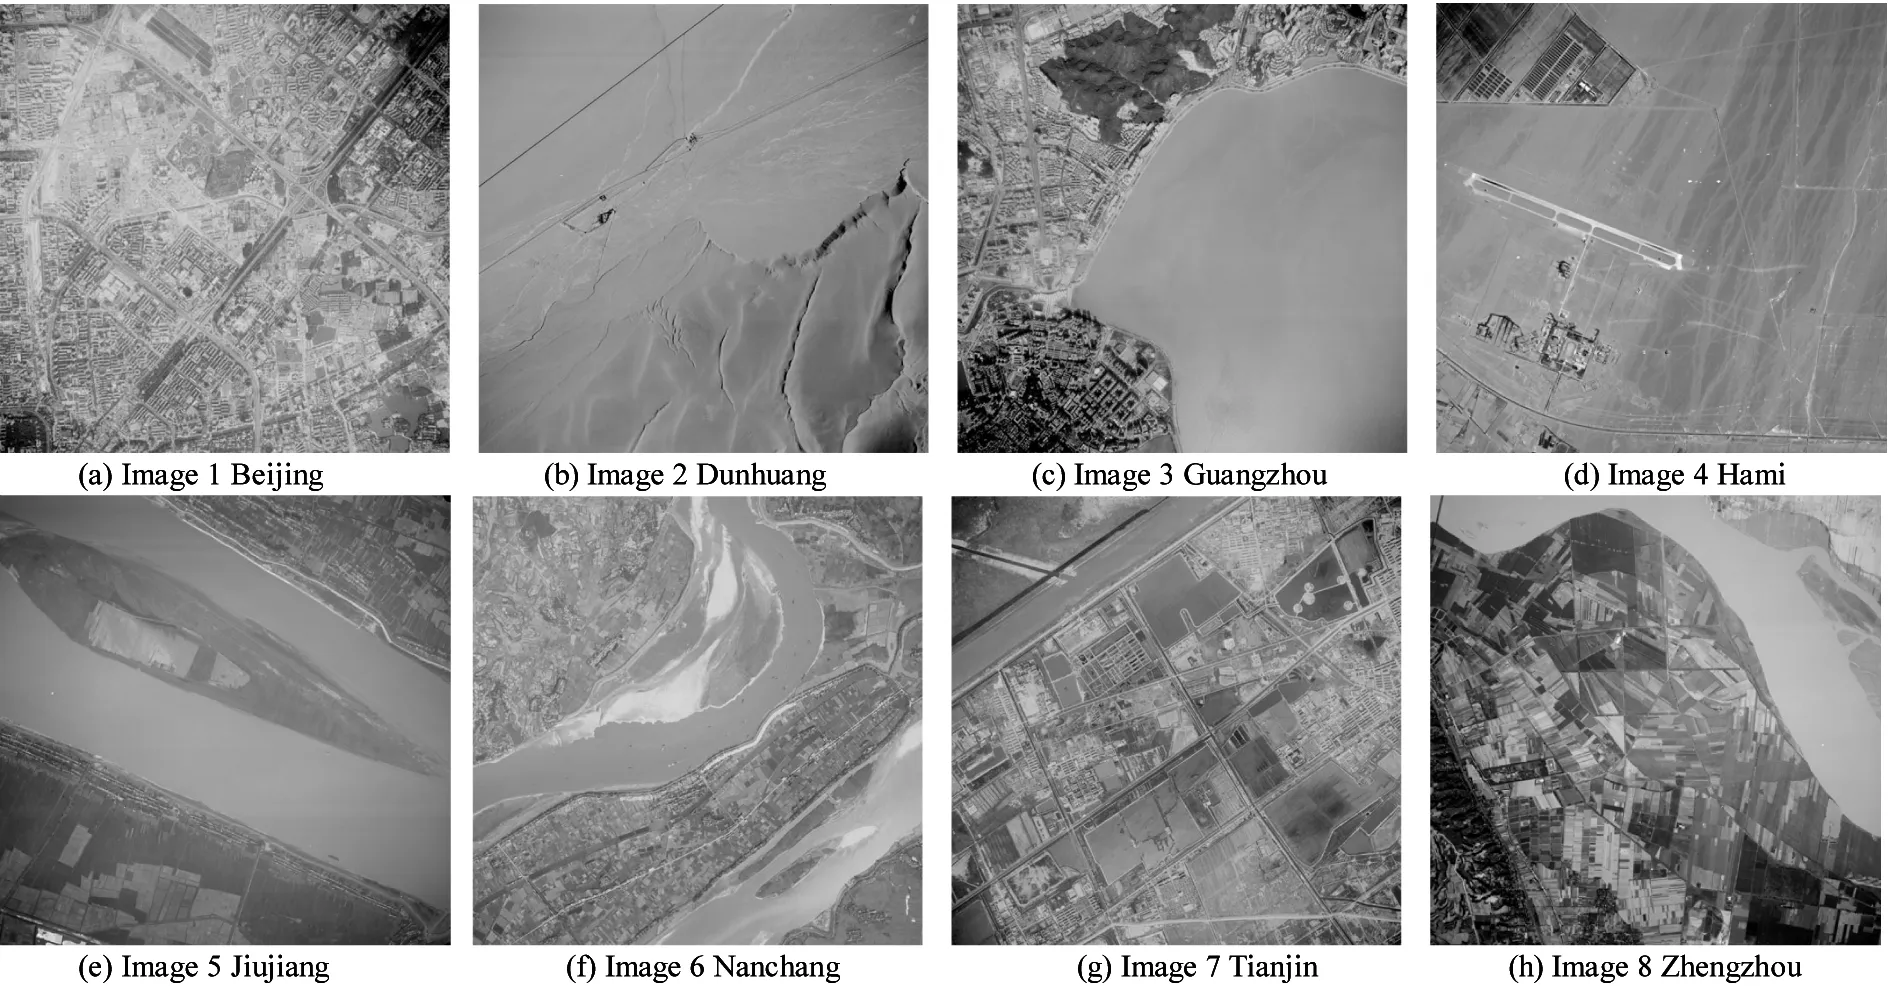
Fig.1 Simulative images of satellite
2 Subjective assessment methods
Subjective assessment for compression quality is grading images with visual effect and statistics results by observation of human eyes according to a certain standard or image samples. This procedure relates to human visual system, especially human brain cognitive mechanism. It also relates to learning, memory and emotion, which needs optimized subjective assessment methods to reduce the effects of these factors in the course of subjective assessment.
The ability to distinguish scenery details is called resolving power. It reflects human visual acuity. It is defined as the reciprocal of visual angle between the nearest 2 points which human eyes can resolve. The geometrical relationship is shown in Fig.2, wherelreflects the distance between human eyes and scenery,dreflects the distance between the nearest 2 points which human eyes can resolve, andθis visual angle in arc minutes.
The following formula is concluded from the geometrical relationship shown in Fig.2.
d/(2πl)=θ/(360×60)
(1)
θ=3438×d/l
(2)

Fig.2 Human eyes angular resolution
Research shows that human eyes have the nature of band pass filtering. Human eyes are sensitive at the spatial frequency 2 circle/degree ~ 10 circle/degree, and the sensitivity descends at other frequencies[9], as shown in Fig.3. Nill N. B. studied image compression and quality assessment, and the result showed that the most sensitive spatial frequency for human eyes was 5 circle/degree[10]. In medium luminance and medium contrast, the limit resolution of human normal visual acuity is 1 arc minute when human observe static objects.
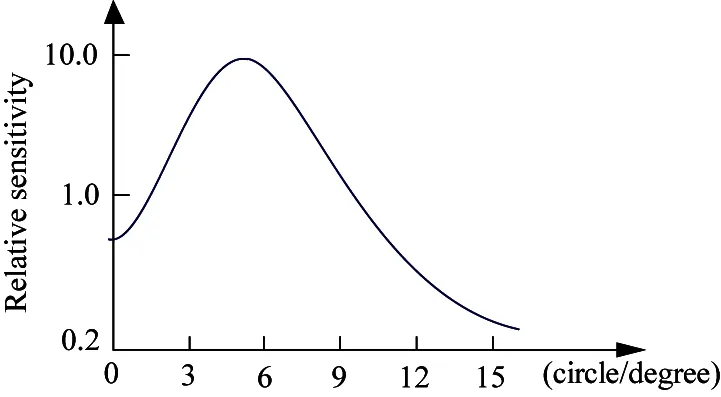
Fig.3 Human eyes band-pass response curve
In order to observe images preferably, the observer could adjust the position of his head relative to monitor to the best distance and visual angle. For example, in order to observe objects at the sensitive spatial frequency for human eyes, we are close to monitor when observing small objects and are far from monitor when observing big objects. If the distance between human eyes and the monitor is 400mm, regard 7 circle/degree as the sensitive spatial frequency considering scenery contains all sorts of spatial frequency component. 1 degree corresponds to object sized:d=θ×l/3438=60×400/3438=7mm,so the size of the black and white line pair is 0.5mm ( 7/(2×7)=0.5mm ). Whereas display points distance of current monitor is about 0.25mm, the images which will be graded should be zoomed by 200% — 0.5mm/pixel — in order to distinguish information best. Sometimes in order to observe details of images, the images need to be zoomed by 300% or 400%. Besides, when histogram dynamic range of images is narrow, observers could observe wispy change of information by enhancing images.
3 Objective assessment methods
Objective assessment for compression quality is that grading images with some parameters which reflect images texture and correlation between original image and decompressed image. Definef(i,j)asthegrayvalueintheoriginalimageatpoint(i,j),anddefineg(i,j)asthegrayvalueindecompressedimageatpoint(i,j).Misthenumberofpixelsperrow,andNis the number of pixels per column.
3.1 Images texture
(1) Blocking standard variance (BSV)
The standard variance of the image is defined as follows:
(3)
μisthegrayaverageoftheimage,whichisdefinedas
(4)
Thestandardvarianceofimagescannotreflectimagestexture,becauseitdoesn’tdepictthecorrelationbetweengrayvalueandspatialposition.CuttheimageintosomeimageblockswhosesizeisB×Bpixels.Calculatetheaverageofthestandardvarianceofeveryimageblockastheblockingstandardvariance(BSV)oftheimage.BSVcouldreflecttheexquisiteextentofimagestexture.
CalculateBSVusingtheimageblockwhosesizeis5×5pixelsasaunitinthispaper.
3.2Mutualrelationshipofimages
Thedifferenceoforiginalimageandcompressedimageisusedtopresentimagequalitylossanddeteriorationextent.
(1)Averageofdifferenceimage(ADI)
DifferenceimageΔf(i,j)presentsthedifferenceoforiginalimageandcompressedimage.ItistheabsolutevalueofdifferenceofDNatthesamepositionintheoriginalimageandinthecompressedimage.
Δf(i,j)=|g(i,j)-f(i,j)|
(5)
Averageofdifferenceimageisdefinedas
(6)
(2)Peaksignal-to-noiseratio(PSNR)
PSNRisdefinedasametricwhichisrelatedtothemeansquareerror(MSE),andtheunitofPSNRisdB.
PSNR=-10log10MSE/(2n-1)2
(7)
(8)
wherenis quantification bits.
(3) Correlation coefficient of the original image and the compressed image
Correlation coefficient (CC) is the standard covariance function. Which is defined as follows for two dimension digital images.
(9)
(10)
(11)
CC could estimate level of similarity of two images. According to the definition above, |CC|≤1.EliminatedirectcomponentwhencalculatingCC,soCCiscorrelationcoefficientofimagetextureandisinvariantforgraylineartransform.CCpresentstheretainingoftextureoutlineofcompressedimages:thehigherCCis,thebettertextureoutlineofcompressedimagesretains.
(4)Synthesizedestimationfactor(SEF)
Becauseimagescontainredundantinformation,theycouldbecompressedeffectively.Theredundantinformationquantitiesofdifferentimagesaredifferent.Theredundantinformationquantitiesoftheimageswithmoretexturesarelessthanthatoftheimageswithlesstextures.Thedownloadingsubsystemofsatellitecompressestheinputimagesignalusingthesamecompressionmethodandthesamecompressionratio,becausethetextureofimagescan’tbeknowninadvancewhenaspace-borneremotesensingcameraimages.Ifthecompressionmethodandcompressionratioarecertain,theimageswithmoretexturesmaysufferinformationlossesgreaterthanthatoftheimageswithlesstexturesaftercompression,whichleadsthePSNRvaluesoftheimageswithmoretexturestobelowerthanthatoftheimageswithlesstextures.Buttheimageswithmoretexturesretaintextureoutlinebetterthantheimageswithlesstexture,whichleadstheCCvaluesoftheimageswithmoretexturestobehigherthanthatoftheimageswithlesstextures.SoSEFisproposed,anditisdefinedas
SEF=PSNR×CC
(12)
Ifthecompressionmethodandcompressionratioarecertain,SEFchangeslessforimageswhoseredundantinformationquantitiesaredifferent.SoSEFmayestimatecompressioneffectbetter.
4 Experimentresults
4.1 Subjective assessment results
Assess how does compression impact on the above-mentioned 8 scenes of simulative images using subjective assessments. Display resolution is set at 0.5mm/pixel. For lack of space, 3 pieces of sub-images of 100 pixels×100 pixels are selected respectively from Image 1 Beijing, Image 3 Guangzhou and Image 2 Dunhuang as examples, shown respectively in Fig.4, Fig.5 and Fig.6. The piece of sub-images of Image 1 Beijing contains buildings, vegetation, broad roadways etc. The piece of sub-images of Image 3 Guangzhou contains narrow roads, sporadic plants etc. The piece of sub-images of Image 2 Dunhuang contains desert, sporadic plants etc. Compare the compression quality of 4:1 to that of 8:1.
For images containing abundant textures (vegetation in Image 1 Bejing) and many wire-like features (narrow roads in Image 3 Guangzhou, broad roadways in Image 1 Beijng), there is little compression imprint in 4:1 compressed image, as shown in Fig.4(b) and Fig.5(b); but there are many compression imprints in 8:1compressed image: the exquisite texture of vegetation is fuzzed seriously; roads are diffused or disappear; buildings artifact appear, as shown in Fig.4(c) and Fig.5(c). For images containing less textures (desert in Image 2 Dunhuang), there is little compression imprint both in 4:1 compressed image and 8:1 compressed image, as shown in Fig.6(b) and Fig.6(c).
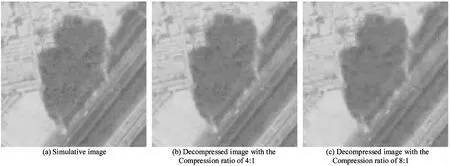
Fig.4 Simulative image and decompressed images (Beijing) with the compression ratio of 4:1 and 8:1 (display setup—0.5mm/pixel)
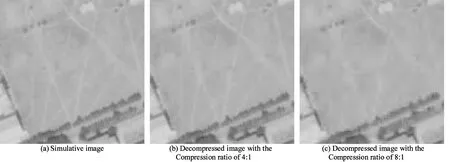
Fig.5 Simulative image and decompressed images (Guangzhou) with the compression ratio of 4:1 and 8:1 (display setup—0.5mm/pixel)
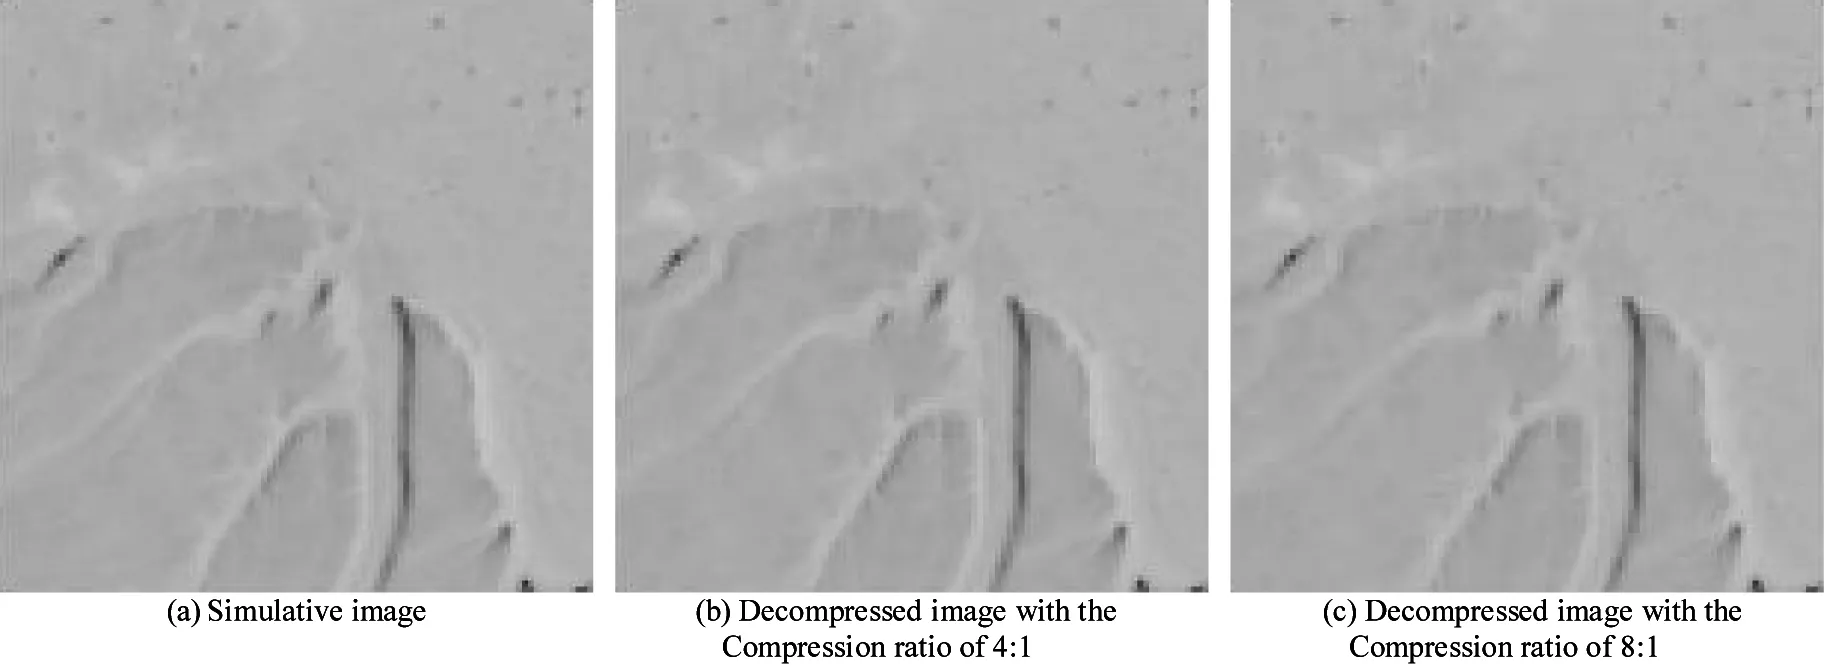
Fig.6 Simulative image and decompressed images (Dunhuang) with the compression ratio of 4:1 and 8:1 (display setup—0.5mm/pixel)
In a word, 4:1 compression impacts imperceptibly both on images containing abundant high frequency information and that containing less high frequency information. 8:1 compression impacts imperceptibly on images containing less high frequency information, but it impacts notably on images containing abundant high frequency information.
According to subjective assessment results, it also could be concluded that the display resolution—0.5mm/pixel is scientifically reasonable, at which small changes of image texture could be observed intuitively.
4.2 Objective assessment results
Assess how does compression impact 8 scenes of simulative images mentioned above on images texture and mutual relationship of images. Because different images have different statistics features, assessment results are different from each other. For lack of space, the average of every metric is calculated in order to analyze and conclude them. Moreover, compare BSV with information entropy and angular second moment which are common metrics to assess loss extent of images texture quality. The information entropy is a metric to assess the information quantities of images. The angular second moment is a metric to assess exquisite extent of images texture. Compare SEF with PSNR which is also common metric to assess loss extent of images whole quality. The results are shown in Table 2, Table 3 and Table 4.
As shown in Table 2, the average of BSV of the original images is 8.12 DN. The average of BSV of 4:1 compressed images is 7.94 DN which is 2.22% less than that of the original images. The average of BSV of 8:1 compressed images is 7.58 DN which is 6.65% less than that of the original images. It shows that both 4:1 compression and 8:1 compression impact on images textures to a certain extent, but the image quality loss caused by 8:1 compression is more serious. The average of information entropy of original images is 4.38. The averages of information entropy of 4:1 compressed images and 8:1 compressed images are both 4.38. Moreover, the information entropy of 4:1 compressed image and 8:1 compressed image of Image 3 and Image 8 is higher than that of the original image, which means the amount of information of 4:1 compressed image and 8:1 compressed image of Image 3 and Image 8 is more than that of the original image. It is contrafactual obviously, because compression could result in that images lose information (especially high frequency information). It shows that information entropy doesn’t reflect loss of information of images sensitively and correctly in some cases. The average of angular second moment of original images is 0.00096. The average of angular second moment of 4:1 compressed images is 0.00109, which is 13.5% more than that of original images. The average of angular second moment of 8:1 compressed images is 0.00150, which is 56.3% more than that of original images. But the angular second moment of 4:1 compressed image of Image 8 is lower than that of original image, which means the texture of 4:1 compressed image of Image 8 is more exquisite than that of original images. It is also contrafactual obviously, because compression could result in that the texture of images diffuse and roughen. It shows that angular second moment doesn’t reflect diffusion of texture of images correctly in some case. Comparing to information entropy and angular second moment, BSV could reflect loss of images texture quality correctly, sensitively and stably.
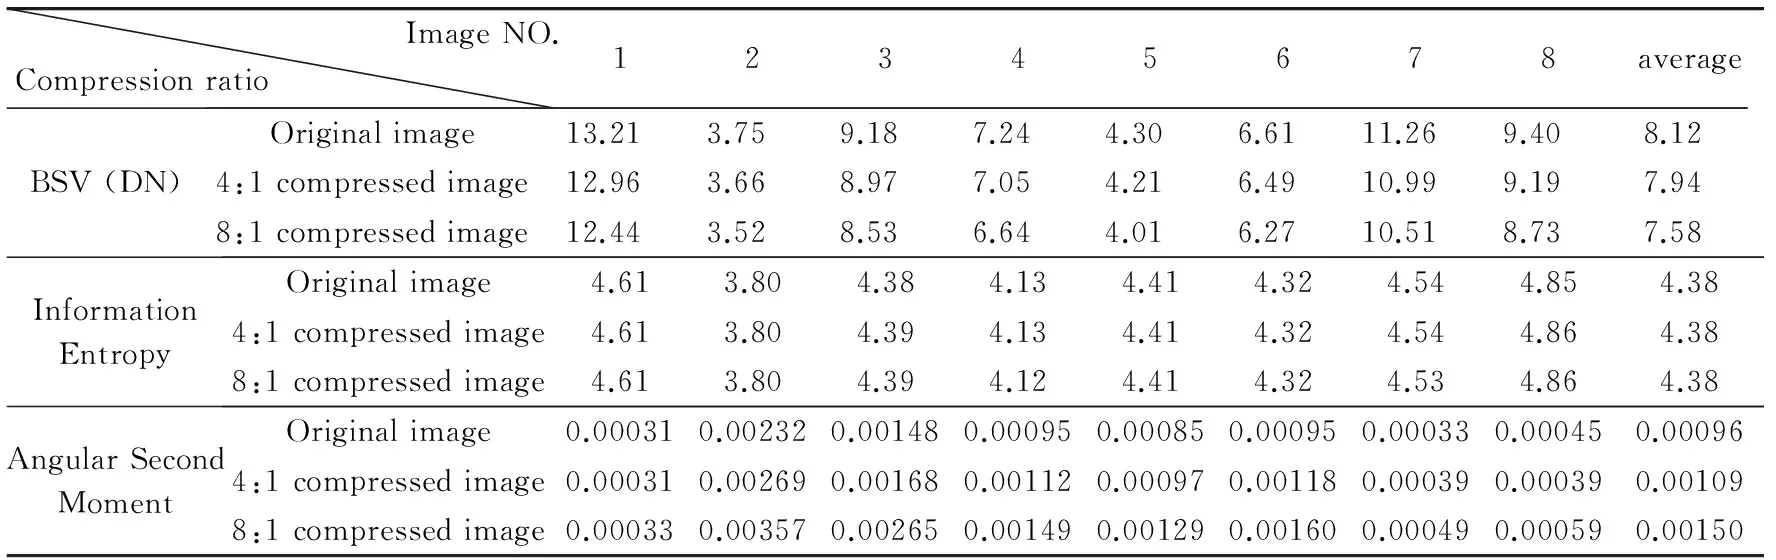
Table 2 The effect of compression on images texture
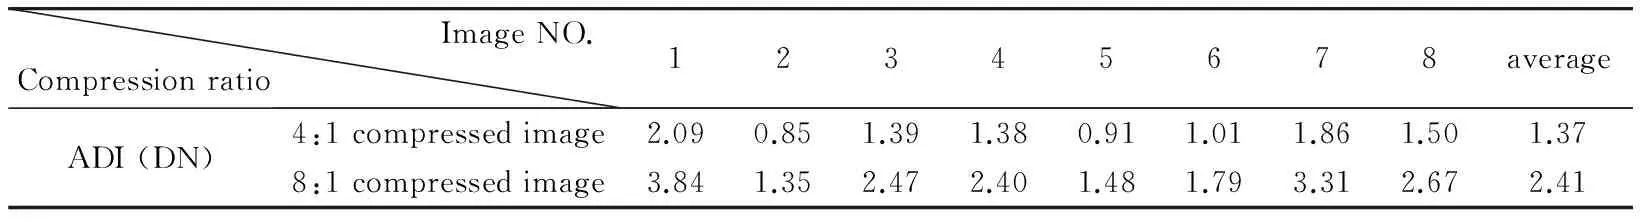
Table 3 The effect of compression on ADI
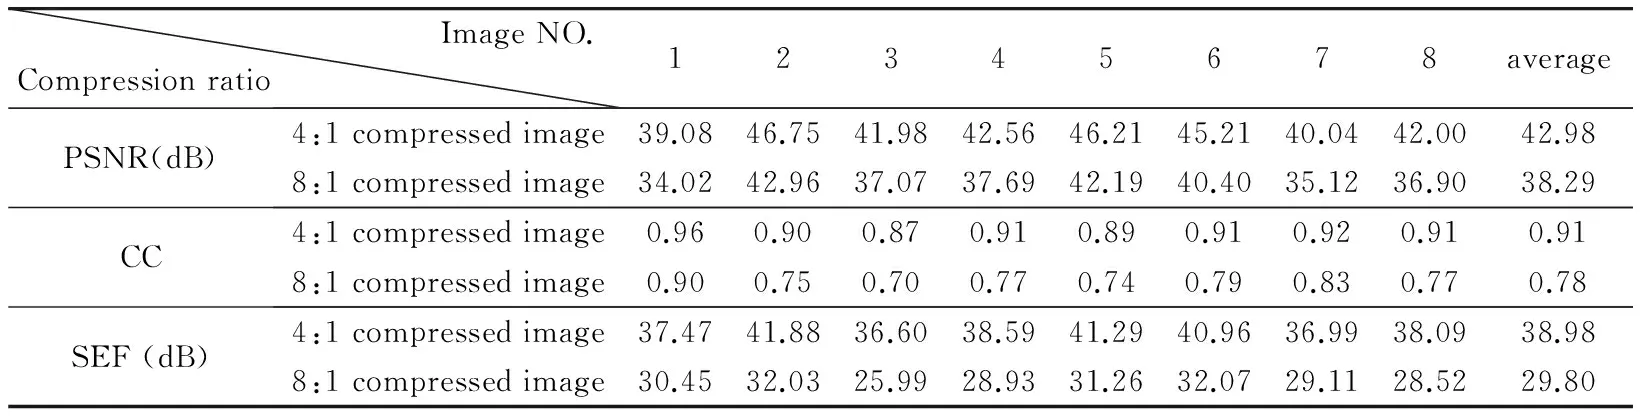
Table 4 The effect of compression on PSNR, CC and SEF
As shown in Table 3, the average of ADI of 4:1 compressed images is 1.37 DN, and that of 8:1 compressed images is 2.41 DN. Generally speaking, the quantitative applications of remote sensing images need ADI less than 2 DN. It is difficult to meet the need of the quantitative application of remote sensing images for 8:1 compressed images.
As shown in Table 4, the average of PSNR of 4:1 compressed images is 42.98dB, and the PSNR value of 4:1 compressed image 1 is lower than 40dB among these. The average of PSNR of 8:1 compressed images is 38.29dB, which is 4.69dB less than that of 4:1 compressed images, and the PSNR value of 8:1 compressed image 1 is lower than 35dB. Generally speaking, if PSNR of a compressed image is more than 40dB, the image quality is acceptable. If PSNR of a compressed image is less than 35dB, the image quality will descend sharply. So, 4:1 compression quality, which is better than 8:1 compression quality, is acceptable.
Moreover, according to Table 4, the PSNR values of 8:1 compressed image 2, image 5 and image 6 are still more than that of 4:1 compressed image 1. Therefore, scenery features of images impact on PSNR values of images seriously. Instead, SEF is independent of scenery features of images. According to Table 4, the SEF values of 4:1 compressed images are all more than 36.60dB; that of 8:1 compressed images are all less than 32.07dB. Fig.5 shows the advantage of SEF intuitively. The blue line presents 4:1 compression quality assessment results; and the pink line presents 8:1 compression quality assessment results. The blue shadow area presents the range of 4:1 compression quality assessment results and the pink shadow area presents the range of 8:1 compression quality assessment results; the purple shadow area is the overlap region of the blue shadow area and the pink shadow area. According to Fig.7, especially the values of PSNR in the purple shadow area, the PSNR values of 8:1 compressed image 2, image 5 and image 6 are still more than that of 4:1 compressed image 1. In the right part of Fig.5, which presents the values of SEF, there is no purple shadow area, furthermore the distance between the blue shadow area and the pink area is 4.53dB. The values of SEF of different compression ratios spread over different and settled ranges. So, it indicates that SEF is more stable than PSNR. SEF is almost independent of image texture feature. So if assessing image compression quality and studying the design index of compression effect, SEF is a better choice and should be applied.
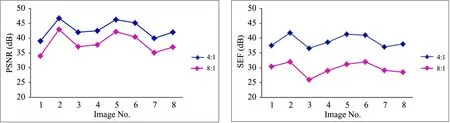
Fig.7 the comparison between assessment result of PSNR and the result of SEF (left, PSNR; right, SEF)
4.3 Synthetic assessment results
Analyzing synthetically subjective assessment results and objective assessment results, it draws the following conclusion: objective assessment results accord with subjective assessment results by and large; 4:1 compression impacts images imperceptibly both containing abundant high frequency information and containing less high frequency information on both subjective quality (visual effect) and objective quality (image texture and mutual relationship of images); 8:1 compression impacts images imperceptibly containing less high frequency information on both subjective quality (visual effect) and objective quality (image texture and mutual relationship of images), but it impacts notably images containing abundant high frequency information on these aspects.
5 Conclusions
In this paper, simulative images are generated by scanning aerial films taking into account the space-borne remote sensing camera characteristics; subjective and objective assessment methods are optimized. Assessment results are perfect.
(1) Simulative images generation takes into account pixel resolution, dynamic range and quantization bits depth etc. in order to generate simulative images which are similar to the images achieved onboard.
(2) Subjective assessment methods take into account human eyes visual characteristic. It is proposed that display setup—0.5mm/pixel—for subjective assessment is according to main current monitor. It can reflect the image quality descending with compression ratio increasing intuitively.
(3) Objective assessment methods include image texture and mutual relationship between images etc. BSV can reflect the impact of compression on images texture correctly, sensitively and stably. SEF is a metric better than PSNR, and SEF is a better choice for assessing compression quality.
(4) The set of methods mentioned in this paper can assess images compression quality roundly and factually. It is applied in compression quality assessment experiment of P/MS camera loaded on ZY-1-02C and offer technical support for compression program design of this camera. Simulation results show that images compression quality with the compression ratio of 4:1 can meet the remote sensing application requirements.
Reference
[1] Chen S P.Some issues about the remote sensing image quality.SpacecraftRecovery&RemoteSensing,2009,30(2): 15
[2] Sakuldee R, Yamsang N, Udomhunsakul S. Image quality assessment for JPEG and JPEG2000. In: Proceedings of the 3rd 2008 International Conference on Convergence and Hybrid Information Technology, Busan, South Korea, 2008. 1: 320-325
[3] Charrier C, Knoblauch K, Moorthy A K, et al. Comparison of image quality assessment algorithms on compressed images, Image Quality and System Performance VII (eds Farnand S.P., Gaykema F.). In: Proceedings of SPIE-IS&T Electronic Imaging, San Jose, USA, 2010. 7529: 75290B1-75290B-11
[4] Bailey D, Carli M, Farias M, et al. Quality assessment for block-based compressed images and videos with regard to blockiness artifacts. In: Proceedings of Tyrrhenian International Workshop on Digital Communications, Capri, Italy, 2002. 237-242
[5] Seghir A Z, Hachouf F. Edge-region information with distorted and displaced pixels measure for image quality evaluation. In: Proceedings of the 10th International Conference on Information Science, Signal Processing and their Application, Kuala Lumpur, Malaysia, 2010. 77-80
[6] Zhu H J, Wu H Y. New paradigm for compressed image quality metric: exploring band similarity with CSF and mutual information. In: Proceedings of IEEE International Geoscience and Remote Sensing Symposium,Seoul, South Korea, 2005. 696-699
[7] Zhang H, Zhang Y L.Study on the quality evaluation of satellite remote sensing image data compression system.ChineseSpaceScienceandTechnology,2007,27(1):55-60
[8] Leachtenauer L C, Driggers R G. Surveillance and Reconnaissance Image Systems (Modeling and Performance Prediction). Boston/London: Artech House Publishers, 2001. 231
[9] Yao J C, Shen J, He J F, et al. Experiment research of contrast sensitivity characteristics of different human vision system.ChineseScienceBulletin, 2008, 53(22): 2730-2734
[10] Nill N. B. A visual model weighted cosine transform for image compression and quality assessment.IEEETransactionsonCommunications, 1985,33 (6) :551-557
He Huaying, born in 1981, received her M.S. degree in aircraft design of China Academy of Space Technology in 2008. Her research interests include remote sensing image processing and data compression.
10.3772/j.issn.1006-6748.2015.01.016
*Supported by the Civil Aerospace “The 12thFive-year Plan” Advanced Research Project (No. D040103).
*To whom correspondence should be addressed. E-mail: hehuaying@spacechina.comReceived on Oct. 11, 2013
杂志排行

High Technology Letters的其它文章
- Filtered-beam-search-based approach for operating theatre scheduling*
- Exploiting PLSA model and conditional random field for refining image annotation*
- Maneuvering target tracking algorithm based on cubature Kalman filter with observation iterated update*
- Retrieval and analysis of sea surface air temperature and relative humidity*
- Data organization and management of mine typical object spectral libraries*
- Realization of a tunable analog predistorter using parallel combination technique for laser driver applications*