Data organization and management of mine typical object spectral libraries*
2015-02-15JiMinJinFengxiangLiTingSunYongGuoLifeng
Ji Min (季 民), Jin Fengxiang, Li Ting, Sun Yong, Guo Lifeng
(*Geomatics College, Shandong University of Science and Technology, Qingdao 266590, P.R.China)(**President Office, Shandong Jianzhu University, Jinan 250101, P.R.China)
Data organization and management of mine typical object spectral libraries*
Ji Min (季 民)**, Jin Fengxiang**, Li Ting*, Sun Yong*, Guo Lifeng*
(*Geomatics College, Shandong University of Science and Technology, Qingdao 266590, P.R.China)(**President Office, Shandong Jianzhu University, Jinan 250101, P.R.China)
With the development of mining industry, people have obtained profits from it, but they are facing environmental damages. In order to monitor these environmental changes, a spectral library is set up for the spectrum data organization and management of mine typical objects. Most of the spectrum data come from the long-term field measuring in mining area and other spectral libraries. For the data quality control and error detection in the measuring data, an inner precision calculation method is presented and a series of interactive graphical controls are developed for the spectrum visualization and analysis. Through extracting and saving spectrum characters for the mine typical objects, realizs spectrum matching and classification for new measured spectrum samples are realized by using Euclidean distance, Aitchison distance, Pearson correlation coefficient and vector angular cosine methods. Based on the matching result, this work is able to gather dynamically physicochemical environment parameters from the library and gives an early warning for the mine environmental changes.
spectral library, mine typical object, data organization, data quality control, spectrum matching, spectrum analyzing
0 Introduction
Mining is the basic industry of national economy. For several decades disorder mining in some areas, geological disasters and environmental damage have become the obstacle to the sustainable development of the mining industry. Scholars and some government departments began using RS (Remote Sensing), GPS, and GIS technologies to monitor and measure those environmental damages or changes. By using spatial database, researchers can save objects’ measured spectrum data and their physicochemical parameters into these libraries and can extract them for spectrum analyzing of the next step. For this reason, mine spectral libraries have become an important part for monitoring mine environmental changes.
Many institutions and departments have established a variety of typical spectral libraries for different purposes, such as the JPL library, the USGS library, the ASTER library, and so on. The JPL library is the first geological spectral library which was built by the U.S. Jet Propulsion Laboratory (JPL) in 1981. This library has saved amount of rocks and minerals’ spectra and their related auxiliary information, and its latest version is 2.0[1]. Combined with the JPL library, the United States Geological Survey (USGS) also established a mineral resources spectral library. Its newest version splib06a contains over 1300 spectra including mid-infrared data as well as spectra from splib05a and additional visible and near-infrared spectra[2]. Coming from the JPL and USGS libraries, the ASTER (Advanced Spaceborne Thermal Emission Reflection Radiometer) library also provides a comprehensive collection of over 2300 spectra of natural and man-made materials[3]. In China, from the late of 1980s, the Institute of Remote Sensing Applications of China Academy of Science and other institutes also established more than 10 spectral libraries[4-6]. These libraries are the foundation of remote sensing research, and can give a strong support for the application of remote sensing in different research fields.
In order to dynamically monitor and analyze environmental changes in mining areas, supported by several national foundations, we began to measure typical objects’ spectra at several coal mine areas from 2009. And based on the study of those upper libraries, we also established a mine typical object spectral library[7,8]. For the organization of the measured spectra, a mine typical object spectral library management system is developed which can be used for the spectral data quality control, spectrum visualization, spectra classification, spectrum features extracting, and spectral analysis.
1 Data resources
In the proposed library, there are three data resources: historical data from official publications, download data from the ASTER library, and measuring data from the mining research areas.
From 1980 to 1982, the Institute of Remote Sensing Applications of China Academy of Science and several other organizations measured the spectra of vegetation, soils, rocks, and water at Beijing, Tianjin, Hebei, and Anhui provinces. Tong and Tian published those data at Ref.[9]. There were 277 pieces of spectra which were collected at various phenological phases, under different polluted conditions, and with different geochemical effects. The spectral ranges were from 400nm to 1100nm. These data were officially published, had a higher authority and imported into our library as the basis for the next data analysis.
The ASTER library provides a comprehensive collection of over 2300 spectra of wide variety of materials covering the wavelength range of 0.4~15.4μm[3]. For further spectral feature analyzing and contrasting, the spectra of minerals, vegetation, rocks, soils, and manmade materials were downloaded, and imported into our mine spectral library.
From June 2009 to June 2013, spectra of nature water, sinking water, tailings, soils, crops, vegetations, rocks, and manmade materials were measured at the coal mining areas in Beijing, Shandong, Shanxi, and Xinjiang provinces. Almost 500 spectra samples were collected which were under a variety of environmental conditions. The auxiliary information for each sample includes basic measuring information, meteorological condition, physicochemical parameters, and some special parameters for different types of objects, such as management, construction, and soil parameters for crops. According to the sample types, all of these data were organized in their sub-databases in the library. Because the proposed library has collected more information than other libraries, these new measured data would be the basis for the further mine typical object spectrum analysis.
2 Designs of database architecture and system functions
2.1 Design ofdatabase architecture
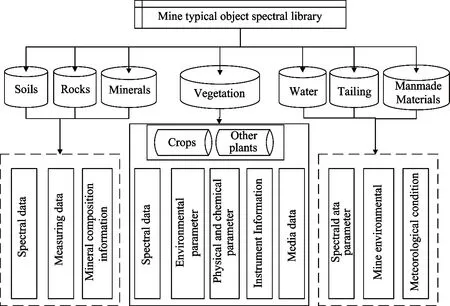
According to the types of mine typical objects, our spectral library is divided into seven sub-databases: vegetation, manmade material, soil, mineral, rock, water, and tailing sub-libraries. The designed database architecture is shown as Fig.1.

Fig.1 Database architecture of the mine spectral library
In mining areas, the growth status of vegetation can reflect the degree of environmental pollution directly. By measuring the spectrum of crops, grasses, and other plants, more than 300 pieces of data were got, and all the data were saved in the vegetation sub-library. In order to organize the spectral data more clearly, the data were sorted in tree shaped structures such as crops including wheat and rice, where the wheat includes fall wheat and spring wheat, the rice includes single-cropping rice and double-cropping rice, and so on. At the same time, the auxiliary attributes and parameters were also saved into the databases. Auxiliary attributes include temperature, wind direction, wind speed, weather conditions, surveyors, and surveying instrument. And parameters include crops management data, physicochemical data, and phenological data.
In rock, mineral, and soil sub-libraries, almost 2000 pieces of object spectrum data and their auxiliary data were saved. According to the tree shaped structure, minerals were divided into oxide, silicate, carbonate, hydroxide, sulfide, borate, phosphate, halide, arsenate, chloride, and tungstate. Rocks were divided into igneous, metamorphic and sedimentary rocks. And soils were divided into cambisols, soft soil, dry soil, alfisols, ultisols, entisols, and etc.
In the coal mine area, water includes nature water and sink water. In order to study the pollution degree of water, about 150 water samples were collected and their quality parameters were also measured, such as the pH, conductivity, water temperature, total phosphorus, total nitrogen, chemical oxygen demand, and so on. All of these parameters were saved into the water sub-library.
2.2 Design of system functions
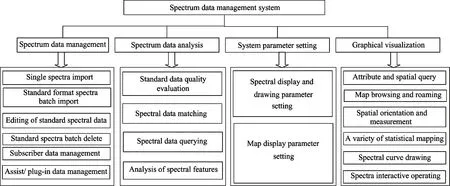
In order to manage and analyze typical objects’ spectral data and their attribute data more efficiently, the spectrum data management system is designed as four modules: spectrum data management module, spectrum data analysis module, system parameter setting module, and spectrum mapping and visualization module. The system function architecture is shown as Fig.2.

Fig.2 Data management system function design
The spectrum management module is used to import typical objects’ spectral data and their auxiliary data into different sub-libraries, and manage these data in different related dialogs. The spectrum data analysis module includes system’s core functions, such as data quality control and evaluation, spectral data matching, and spectral features extracting. The spectrum mapping and visualization module can draw spectral curves and analyze spectral features interactively.
3 Key techniques researched in the system development
3.1 Development of graphical interactive controls based on GDI+
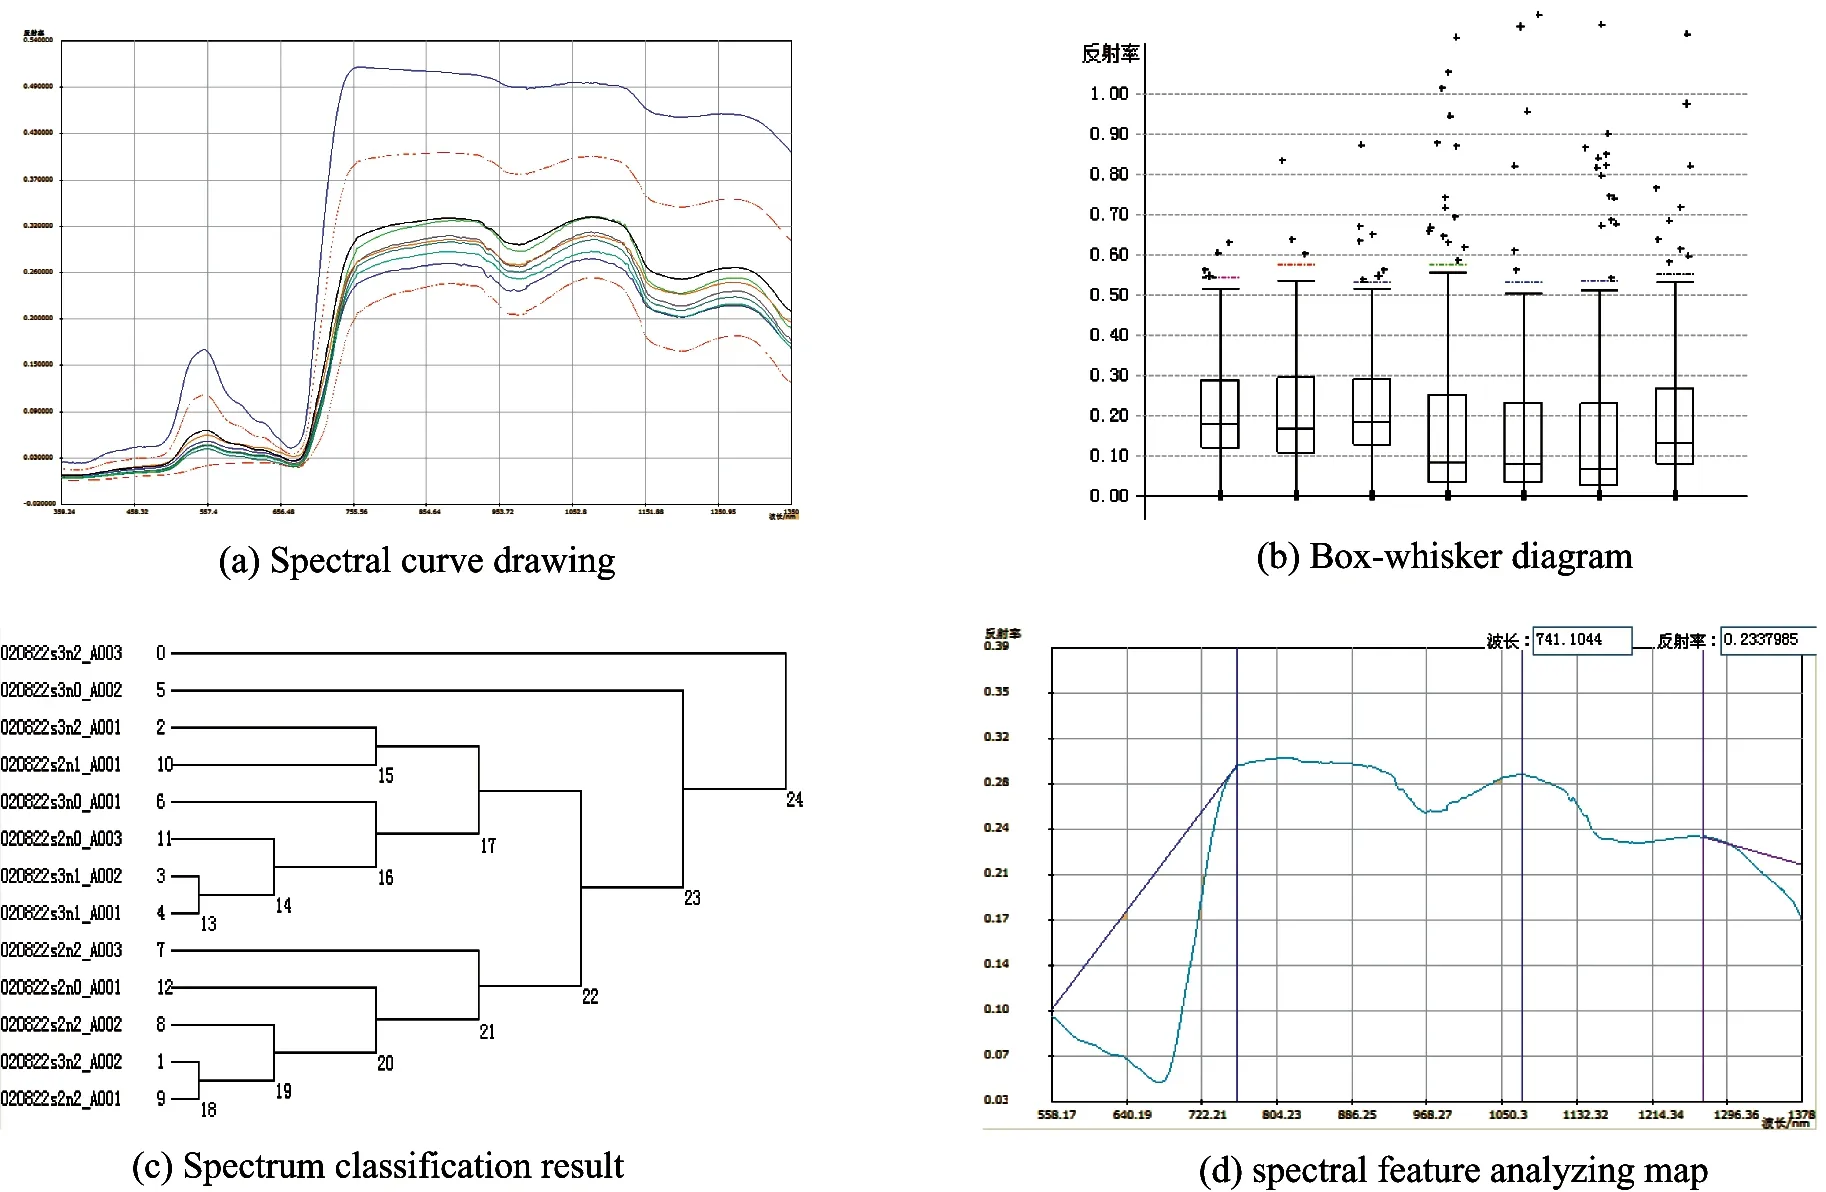
In recent years, Microsoft has presented a series of new characters in the GDI+ (Graphics Device Interface Plus) techniques[10]. The managed interface of GDI+ includes almost 60 classes, 50 enumeration types, and 8 data structures. It brings forward many new functions, such as the gradient brushes, cardinal spline functions, persistent path objects, transform matrix objects, and various image data formats supporting. Based on these new characters of GDI+, several graphical controls are developed which can be used for drawing spectral curves, derivative spectra, spectrum matching results, and box-whisker diagrams interactively. Fig.3 shows the mapping result of these controls.

Fig.3 Spectral data visualization diagrams achieved by GDI+
3.2 Data quality control for measured data
The accuracy of field spectrum measurement is affected by a variety of factors, such as measuring time, spectrometer FOV (Field of View) size, observation angles, solar azimuth and elevation angles, atmospheric environmental factors, operation procedures of surveyor, etc. For this reason, measured data must be detected before they are imported into the library. An inner precision formula is put forward which can be used for the quality evolution of the measured data. It is shown as
(1)
As it is known, the curve features of one group measured spectra should have almost the same characters under the same measuring conditions. If a set of data has great volatility, it shows that the measuring condition is unstable. The inner precision can be used to evaluate volatility. First, the average reflectance curve of those data should be calculated, and then each curve’s inner precision by using Eq.(1). In the equation,δijis the difference between thej-th measured curve and the average curve at thei-th common wavelength,mis the measured curve number,nis the common wavelength point. This equation reflects the standard deviation of a single spectral curve which must contain accident errors or systematic errors. In order to eliminate the affection of accident errors, another formula is presented as
(2)
εis named as the total inner precision for one group measured spectra. If the value ofεmeets the required tolerance, the measured data can be imported into the library, otherwise the original data should be checked again. Fig.4 shows an example for data quality control in the proposed system by using these two equations.

Fig.4 The result of the inner precision calculating
3.3 Spectrum matching
The degree of environment changing in mine area can be reflected by the vegetation’s degradation level, the contaminants of pollution in nature or sinking water, and atmospheric aerosol content. Through the long-term field spectrum measurements and laboratory analysis in the demonstration mine areas, a lot of mine typical objects spectral data and their corresponding environmental parameters, biochemical parameters and physiochemical parameters have been collected. By the spectrum matching algorithm, the consistency for the sample spectra with the standard spectra in the library can be checked, and those parameters can be retrieved from the database. The parameters can show the pollution degree of the mine environment and will give an early warning. In order to achieve this purpose, this work provides four methods in the system for the spectra similarity measuring in the data matching procedure, which are the Euclidean distance[11], Aitchison distance, Pearson correlation coefficient and vector angular cosine methods.
Aitchison distance is used to calculate the distance between two objects defined in the simplex space[12]. In the spectrum matching procedure, if there arepband sampling positions in the selected wavelength range, the similarity of two spectral datauandvin the simplex space can be measured by the distance of two vector points in thep-dimensional space. The calculation is
(3)

(4)

Fig.5 Spectrum matching result based on Pearson correlation coefficient
3.4 Spectral features visualized analyzing and extracting
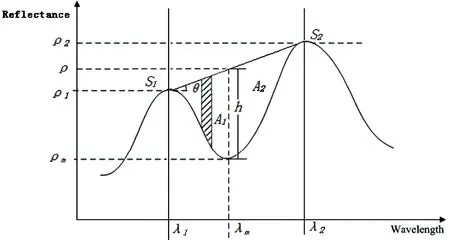
The reflection and absorption features in the spectral reflectance curve, not only describe the different characters between different objects, but also reflect the spectra volatility of the same objects which were under different background conditions. In order to analyze the spectral features at the microscopic level for the mine typical object, visualized analysis tools were developed for characteristic parameters extraction. The principle is shown as Fig.6. The parameters include the value of absorption valley (ρm), the absorption depth (h), the absorption width (W), the absorption area (A), the absorption band (λm), the variable drive angle (θ), the symmetry of absorption area (T), the symmetry of absorption bands (Л). In that, absorption areaAis generated by subsection integration just as the shaded area in Fig.6. The symmetry of absorption area is asT=A1/A. The symmetry of absorption bands is as Л = (λm-λ1) / (λ2-λ1). By using these parameters, the researchers can make a step for the library’s application in different areas.

Fig.6 Extracting of spectral characteristic parameters
4 Conclusions
The measurement of spectral data in the field has an important role in remote sensing[13], and the spectral library has become one of the important supports for remote sensing applications. Through filed measurement and experimental analysis at mine areas, the preliminary frame architecture of the mine typical object spectral library and its management system has been set up. Based on the GDI+ technique, a series of graphical controls for drawing spectral curves and box-and-whisker diagrams, and extracting spectral characteristic parameters interactively are realized. Spectrum matching and classification are achieved by four spectral similarity measurement methods. By using the spectral information extracting and analyzing functions, the system can realize dynamic warning for the mine environment changes, and will provide a strong technical support for the mine environment protecting and the mine sustainable development.
[1] JPL. Speclib[EB/OL]. http://speclib.jpl.nasa.gov/, 2010
[2] Clark R N, Swayze G A, Wise R, et al. USGS Digital Spectral Library. http://speclab.cr.usgs.gov/spectral-lib.html, 2007
[3] Baldridge A M, Hook S J, Grove C I, et al. The ASTER spectral library version 2.0.RemoteSensingofEnvironment, 2009, 113(4):711-715
[4] Tian Z K, Liu S H, Fu Y Y. Design and realization of spectral data management in the standard spectral knowledge base.ComputerEngineeringandApplications, 2005,(1):210-213
[5] Tian Q J, Gong P. The spectral database research status and development trend.RemoteSensingInformation, 2002, (3):1-6
[6] Wang J D. Chinese Typical Spectral Knowledge Database. Bejing: Science Press, 2009
[7] Ji M, Fan J F, Li T, et al. Research on visualized data quality control methods of ground object spectrum in Yanzhou mining Area. In: Proceedings of the 2nd International Conference on Computer Engineering and Technology, Chendu, China, 2010. 457-462
[8] Fan J F. Study on construction and implementation of typical ground object spectrum database in Yanzhou mining area: [Master dissertation]. Qingdao: Shandong University of Science and Technology. 2011. 20-45 (In Chinese)
[9] Tong Q X, Tian G L. Typical Objects Spectral and Characteristics Analysis of China. Bejing: Science Press, 1990. 36-589 (In Chinese)
[10] Chand M. GDI+Graphics Programming. Beijing: Publishing House of Electronics Industry, 2005.15-110
[11] Freek v d M. The effectiveness of spectral similarity measure for the analysis of hyperspectral imagery.Internationaljournalofappliedearthobservationandgeoinformation, 2006, 8 : 3-17
[12] Clark R N, King T V V, Klejwa M, et al. High spectral resolution reflectance spectroscopy of minerals.JournalofGeophysicalResearch, 1990, 95(B8): 12653-12680
[13] Edward J M, Michael E S, Karen A, et al. Progress in field spectroscopy.RemoteSensingofEnvironment, 2009, 113(S1): S92-S109
Ji Min, born in 1970. He received his Ph.D degrees in Geomatics Collage of Shandong University of Science & Technology in 2004. He also received his B.S. and M.S. degrees from Shandong Institute of Mining Technology in 1992 and 1997 respectively. His research interests include the spatial data organization, GIS application developing and spatial data minin.
10.3772/j.issn.1006-6748.2015.01.014
*Supported by the National Key Technology R&D Program of China (No. 2012BAH27B04, 2011BAC03B03), the National Natural Science Foundation of China (No. 41471330), Research Fund for the Doctoral Program of Higher Education of China ( 20113718110001), and SDUST Research Fund ( 2011KYTD103).
*To whom correspondence should be addressed. E-mail: jamesjimin@126.comReceived on July 9, 2013
杂志排行
High Technology Letters的其它文章
- Research on assessing compression quality taking into account the space-borne remote sensing images*
- Filtered-beam-search-based approach for operating theatre scheduling*
- Exploiting PLSA model and conditional random field for refining image annotation*
- Maneuvering target tracking algorithm based on cubature Kalman filter with observation iterated update*
- Retrieval and analysis of sea surface air temperature and relative humidity*
- Realization of a tunable analog predistorter using parallel combination technique for laser driver applications*
