Monitoring of Growth Parameters of Sweet Corn Using CGMD302 Spectrometer
2015-01-18QingchunCHENZiliZHANGPengfeiLIUXiaomingWANGFengJIANG
Qingchun CHEN,Zili ZHANG,Pengfei LIU,Xiaoming WANG,Feng JIANG
Crops Research Institute,Zhongkai University of Agriculture and Engineering,Guangzhou 510225,China
Responsible editor:Xiaohui FAN Responsible proofreader:Xiaoyan WU
As one of the essential elements for crop growth,potassium can promote stem growth,improve fruit quality,enhance cold tolerance,and increase sugar and vitamin C contents in fruit[1].Stem diameter,leaf area index (LAI) are important growth parameters of sweet corn,exhibiting close relationships with the yield and quality formation.A large number of studies show that plant canopy spectra respond well to LAI[2-18].Thenkabail et al.[9]described spectral indices of crop biophysical characteristics in a qualitative study and found that reflectance at 500-550,650-700 and 900-940 nm could explain well LAI variations.Wang et al.[10]reported that rice LAI exhibited a good relationship with group spectral reflectance at visible light wave bands and near infrared bands above 740 nm; LAI exhibited the best relationship with the first derivative spectra of reflectance at 743.37 nm.Furthermore,Wang et al.[11]indicated that rice LAI could be accurately estimated based on the ratio of first order differential sum in blue border to first order differential sum in red border and normalized difference vegetation index (NDVI).Xue et al.[12]reported that rice LAI could be accurately predicted based on the ratio of near infrared reflectance to green band reflectance (R810/R560).Tang et al.[13-15]compared spectral characteristics of different crops and found that red edge position,red edge amplitude and red edge peak area (680-760 nm) of cotton had a significant correlation with LAI;rice LAI exhibited a good correlation with vertical vegetation index(PVI)and NDVI.Huang and Wang[16]indicated that wheat LAI could be monitored based on NDVI (800,670) and red valley position.Overall,at present,a large number of studies have been conducted on spectral monitoring of nitrogen in crops; fewer studies have been carried out on spectral monitoring of phosphorus and potassium in crops; however,little information is available on spectral monitoring of potassium in sweet corn.
In this study,spectral monitoring of potassium in fresh sweet corn was conducted;based on field experiments of Zhengtian 68 under different potassium application levels,the quantitative relationships between common growth parameters of sweet corn at different growth stages and canopy spectral indices was clarified,to construct single-stage monitoring models for rapid monitoring of stem diameter,LAI and other growth parameters of sweet corn,aiming at providing reference and basis for potassium application in sweet corn production.
Materials and Methods
Experimental design
Experiment 1:The field experiment was conducted in Zhongcun Farm of Zhongkai University of Agriculture and Engineering during April-August in 2012.The experimental plots were recreation fields previously.Before sowing,30 cm deep topsoil was collected to determine the basic fertility (total nitrogen,organic matter,nitrate nitrogen,available phosphorus,rapidly available potassium).The soil type was clay loam,containing 1.16 g/kg total nitrogen,19.1 g/kg organic matter,14.36 mg/kg available phosphorus,and 80.8 mg/kg rapidly available potassium.Sweet corn cultivar Zhengtian 68 was used as the experimental material.A total of six potassium application levels were set (K0:0 kg/hm2;K1:120 kg/hm2;K2:240 kg/hm2;K3:360 kg/hm2; K4:480 kg/hm2; K5:600 kg/hm2).Randomized block design was employed with three replications in 18 plots.Nitrogen fertilizer,600 kg/hm2urea:22% basal fertilizer,10%seedling fertilizer,30% jointing fertilizer,30%budding fertilizer,8%grain fertilizer; the application ratio at early,middle and late stages was 32:60:8.Potassium fertilizer was applied with the same proportions as nitrogen fertilizer.In addition,superphosphate (200 kg/hm2P2O5) was applied primarily as basal fertilizer; potassium chloride(52% K2O) was applied as potassium fertilizer.The two-row ridge was 60 cm wide,with plant spacing of 30 cm.The experimental area covered 30 m2.Sweet corn seeds were sown on April 15.Other management was consistent with conventional high-yielding fields.Experiment 2:The field experiment was conducted in Zhongcun Farm of Zhongkai University of Agriculture and Engineering from September in 2012 to January in 2013.The soil type was clay loam,containing 1.21 g/kg total nitrogen,19.8 g/kg organic matter,14.06 mg/kg available phosphorus,and 82.8 mg/kg rapidly available potassium.Zhengtian 68 was used as the experimental material.A total of four potassium application levels were set (0,150,300,450 kg/hm2).Experimental design and fertilization programs were consistent with experiment 1.
Determination items and methods Measurement of growth parameters
After emergence,stem diameter(the diameter of the thickest internode aboveground) of sweet corn individuals at each stage (jointing stage:May 14-May 20;big bell mouth stage:May 23-June 2;tasseling stage:after June 2) was measured with a vernier caliper,and leaf area index of sweet corn plants were determined using LAI2000.Five representative plants in each plot were selected,and the measurement results were averaged.
Determination of spectral dataAt 10:00-14:00 in a sunny day,canopy spectral reflectance at a distance of 0.5 m away from the canopy of sweet corn was measured using a portable spectrometer CGMD302 with the probe vertically downward.As a twoband passive spectrometer (810 nm and 720 nm),CGMD302 was developed by the National Information Technology Center of Agricultural Engineering.
Data analysis
Microsoft Excel software was employed for data analysis and mapping.The models were evaluated comprehensively based on the coefficient of determination (S-R2),root mean square error (RMSE),average relative error (RE) and prediction accuracy(P-R2,the coefficient of determination between the measured value and the estimated value).
Results and Analysis
Changes in growth parameters of sweet corn under different potassium levels
As shown in Fig.1,with the increase of potassium application level and the progress of growth period,stem diameter and LAI increased gradually,with similar trends at different growth stages.To be specific,stem diameter reached the maximum after tasseling stage (June 11); LAI varied at late stage among different potassium application treatments; LAI in K0 -K3 treatments reached the maximum on June 2; LAI in K4-K5 treatments reached the maximum on May 29.
Changes in canopy spectral indices of sweet corn under different potassium levels
The size of crop population poses significant effects on vegetation indices.As shown in Fig.2,with the increase of potassium application level,canopy NDVI of sweet corn increased gradually,with similar trends at different growth stages.To be specific,on June 5,due to the yellowing of some leaves and influences of male tassels,NDVI in K5 treatment declined slightly;however,ratio vegetation index (RVI)exhibited an opposite trend.
Correlations between growth parameters and canopy spectral reflectance of sweet corn

Table1 The quantitative relationships between stem diameter and canopy spectral indices of sweet corn
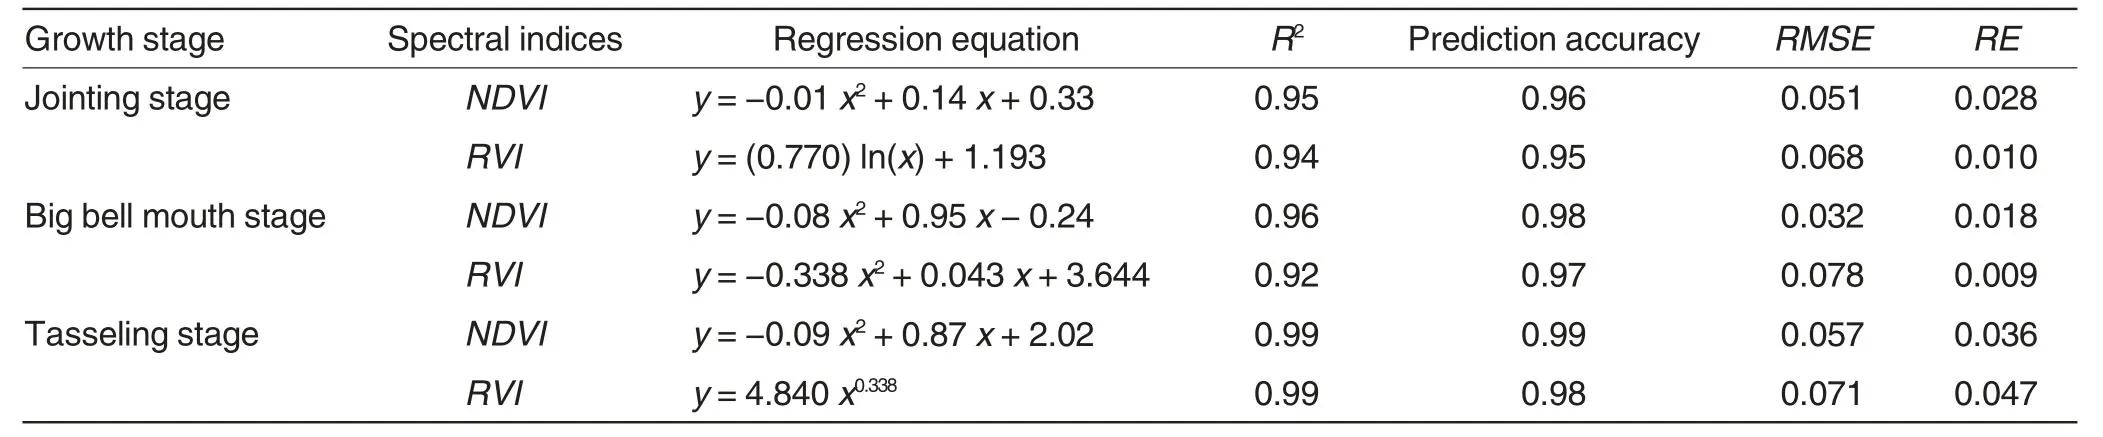
Table2 The quantitative relationships between LAI and canopy spectral indices of sweet corn
As shown in Fig.3,Fig.4 and Fig.5,NDVI and RVI exhibited a good correlation with stem diameter and LAI of sweet corn.At jointing stage,the relationships between stem diameter and NDVI,RVI could be fitted with quadratic functions; the relationship between LAI and NDVI could be fitted with a quadratic function;the relationship between LAI and RVI could be fitted with a logarithmic function.At big bell mouth stage,the relationships between stem diameter,LAI and NDVI,RVI could be fitted with quadratic functions.At tasseling stage,the relationships between stem diameter and NDVI,RVI could be fitted with quadratic functions; the relationships between LAI and NDVI,RVI could be fitted with a quadratic function and a power function,respectively.According to the results,correlation coefficients of all the fitting models were above 0.9; stem diameter and LAI were significantly positively correlated with NDVI and negatively correlated with RVI.
Model verification
Based on data of independent experiment (experiment 2),the established models were verified.According to the results(Table1,Table2),all the single-stage monitoring models established based on NDVI and RVI could effectively retrieve stem diameter and LAI of sweet corn with the prediction accuracy of higher than 0.9,RMSE of less than 10%,RE of less than 5%.Specifically,comparisons between the measured value and the predicted value of stem diameter at tasseling stage were shown in Fig.6.
Conclusion and Discussion
Crop growth is monitored for realtime control of the growth conditions of crops and timely release of seedling monitoring reports,thereby guiding agricultural production,regulating reasonably management measures,and providing a theoretical basis and technical approaches for the prediction of crop yield.Plant canopy spectra reflect the information of plant populations,which can be used to evaluate effectively the growth status and nutrition conditions of plant populations.A large number of studies have been conducted on spectral monitoring of plant growth parameters[2-19],proposing many sensitive bands of growth parameters.Based on years of researches,the National Information Technology Center of Agricultural Engineering screened two bands (720 and 810 nm)and developed a portable spectrometer,which to some extent reduced the reliance on foreign equipments and waste of resources,thus realizing real-time monitoring of the growth status of gramineous crops.
In this study,field experiments were conducted for two consecutive years under different potassium levels,to analyze the relationships between NDVI,RVI and various growth parameters of sweet corn at different growth stages.According to the results,with the progress of growth period,stem diameter increased gradually and reached the maximum at tasseling stage;LAI increased first and then declined gradually.Under different potassium levels,NDVI and RVI varied significantly.To be specific,NDVI was positively correlated with potassium application level,while RVI was negatively correlated with potassium application level.In further studies,the quantitative relationships between spectral indices and stem diameter,LAI of sweet corn were investigated.Results showed that stem diameter and LAI of sweet corn could be effectively monitored based on spectral indices (NDVI,RVI) using CGMD302 spectrometer; the single-stage monitoring models established based on NDVI and RVI could effectively retrieve stem diameter and LAI of sweet corn with the prediction accuracy of higher than 0.9,RMSE of less than 10%,RE of less than 5%.These results pose great significance for realtime monitoring and accurate diagnosis of the growth characteristics of sweet corn individuals and growth status of sweet corn populations,which lays a technical basis for the direct application of remote sensing technology in precision agriculture.Due to the restrictions of weather and other factors,only one ecological point and limited growth stages of one sweet corn variety were involved in the present study.Thus,the accuracy and universality of models established in this study require further verification in more ecological points.
[1]CAO ZH (曹志洪).Scientific fertilization and food security assurance in China(科学施肥与我国粮食安全保障) [J].Soils(土壤),1998,30(2):57-63,69.
[2]TIAN YC(田永超),YANG J(杨杰),YAO X(姚霞),et al.Quantitative relationships between hyper-spectral vegetation indices and leaf area index of rice(高光谱植被指数与水稻叶面积指数的定量关系)[J].Chinese Journal of Applied Ecology(应用生态学报),2009,20(7):1685-1690.
[3]BRONSON KF,CHUA TT,BOOKER JD,et al.In-season nitrogen status sensing in irrigated cotton:II.Leaf nitrogen and biomass [J].Soil Sci.Soc.Am.J.,2003,67(5):1439-1448.
[4]CASANOVA D,EPEMA G F,GOUDRIAAN J.Monitoring rice reflectance at field level for estimating biomass and LAI [J].Field Crops Research,1998,55(1-2):83-92.
[5]CHEN DH (陈德华),WU YK (吴云康),DUAN H (段海),et al.Study on the relationship of sink capacity of unit leaf area to yield and regulation effect to source in cotton population(棉花群体叶面积载荷量与产量关系及对源的调节效应研究)[J].Cotton Science(棉花学报),1996,8(2):109-112.
[6]LEE KS,COHEN WB,KENNEDY RE,et al.Hyperspectral versus multispectral data for estimating leaf area index in four different biomes[J].Remote Sensing of Environment,2004,91:508-520.
[7]VAN DER MEER F.Analysis of spectral absorption features in hyperspectral imagery[J].International Journal of Applied Earth Observation and Geoinformation,2004,5:55-68.
[8]DIKER K,BAUSCH WC.Potential use of nitrogen reflectance index to estimate plant parameters and yield of maize[J].Biosystems Engineering,2003,85:437-447.
[9]THENKABAIL PS,SMITH RB,PAUW ED.Hyperspectral vegetation indices and their relationships with agricultural crop characteristics[J].Remote Sensing of Environment,2000,71:158-182.
[10]WANG XZ(王秀珍),HUANG JF(黄敬峰),LI YM (李云梅),et al.Relationships between rice agricultural parameter and hyperspectra data (高光谱数据与水稻农学参数之间的相关分析)[J].Journal of Zhejiang University:Agriculture and Life Sciences(浙江大学学报:农业与生命科学版),2002,28(3):283-288.
[11]WANG XZ(王秀珍),HUANG JF(黄敬峰),LI YM(李云梅),et al.The Study on hyperspectral remote sensing estimation models about LAI of rice (水稻叶面积指数的高光谱遥感估算模型) [J].Journal of Remote Sensing (遥感学报),2004,28(1):47-52.
[12]XUE LH (薛利红),CAO WX (曹卫星),LUO WH (罗卫红),et al.Relationship between spectral vegetation indices and LAI in rice(光谱植被指数与水稻叶面积指数相关性的研究)[J].Acta phytoecologica Sinica (植物生态学报),2004,28(1):47-52.
[13]TANG YL (唐延林),HUANG JF (黄敬峰),WANG XZ (王秀珍),et al.Comparison of the characteristics of hyperspectra and the red edge in rice,corn and cotton(水稻、玉米、棉花的高光谱及其红边特征比较)[J].Scientia Agricultura Sinica (中国农业科学),2004,37(1):29-35.
[14]TANG YL(唐延林),WANG XZ(王秀珍),WANG K(王珂).Study on the correlation between biophysical parameter and spectral variable(利用光谱法测定水稻生物物理参数及其与光谱变量的相关性研究) [J].Journal of Mountain Agriculture and Biology (贵州大学学报),2002,21:327-331.
[15]TANG YL (唐延林),WANG RC (王人潮),WANG XZ (王秀珍),et al.Study on the leaf area index and biochemical contents of rice blade by the spectral method (水稻叶面积指数和叶片生化成分的光谱法研究) [J].Journal of South China Agricultural University(华南农业大学学报),2003,24(1):4-7.
[16]HUANG WJ(黄文江),WANG JH(王纪华),LIU LY (刘良云),et al.The red edge parameters diversification disciplinarian and its application for nutrition diagnosis(冬小麦红边参数变化规律及其营养诊断)[J].Remote Sensing Technology and Application(遥感技术与应用),2003,18:206-211.
[17]ZHU Y,YAO X,TIAN Y,et al.Analysis of common canopy vegetation indices for indicating leaf nitrogen accumulations in wheat and rice[J].International Journal of Applied Earth Observation and Geoinformation,2008,10(1):1-10.
[18]LU XJ (吕雄杰),PAN JJ (潘剑君),ZHANG JB ( 张 佳 宝),et al.Rice canopy spectral reflectance and leaf area index (水稻冠层光谱反射特征及其与叶面积指数关系研究) [J].Soils(土壤),2004,19(1):24-29.
[19]LI YX(李映雪),XIE XJ(谢晓金),XU DF(徐德福).Application of hyperspectral remote sensing technology in monitoring crop growth (高光谱遥感技术在作物生长监测中的应用研究进展) [J].Journal of Triticeae Crops(麦类作物学报),2009,29(1):174-178.
猜你喜欢
杂志排行
Agricultural Science & Technology的其它文章
- Application of New-type Soil Stabilizer Q2 in Subgrade Construction
- The Analysis of the Agriculture Input and Output Efficiency Based on DEA Model
- Analysis on the TBB Bright Temperature and Vertical Helicity in a Heavy Rain at Anqiu in 2010
- Screening of Resistance to Main Diseases in Tomato Cultivars
- Analysis on the Genesis and the Omission of a Torrential Rain over Linqu on 9 July 2012
- Breeding of Duroc Breeds Homozygous for MUC13 Diarrhea-resistant Allele