Numerical prediction of the long-term soil temperature variationsaround shallow sections of cross-river road tunnels
2014-09-06WangZhimingZhangWeiLeiChangzhengDingPenglaiSunKe
Wang Zhiming Zhang Wei Lei Changzheng Ding Penglai Sun Ke
(1Architecture designing Institute Co. Ltd, Southeast University, Nanjing 210096, China)(2School of Earth Sciences and Engineering, Nanjing University, Nanjing 210046, China)
Numerical prediction of the long-term soil temperature variationsaround shallow sections of cross-river road tunnels
Wang Zhiming1Zhang Wei2Lei Changzheng2Ding Penglai2Sun Ke2
(1Architecture designing Institute Co. Ltd, Southeast University, Nanjing 210096, China)(2School of Earth Sciences and Engineering, Nanjing University, Nanjing 210046, China)
Considering the coupled heat transfer effect induced by parallel cross-river road tunnels, the long-term soil temperature variations of shallow sections of cross-river tunnels under the river beach are predicted using the finite difference method for numerical simulation. The boundary conditions and the initial values are determined by in situ observations and numerical iterations. The simulation results indicate that the ultimate calculated steady heat transfer time is 68 years, and most of the heat transfer is completed in 20 years. The initial constant temperature soil surrounding the tunnels is transformed to an annually variable one. An obvious temperature-varying region of the surrounding soil is discovered within 5 m from the tunnel exterior, as well as within the entire range of soil between the two tunnels. The maximum temperature increase value reaches 7.14 ℃ and the maximum peak-to-valley value of annual temperature increase reaches 10 ℃. The temperature variation of soils surrounding tunnels below 10 m is completely controlled by the heat transfer from the tunnels. The coupled heat transfer effect is confirmed because the ultimate steady temperature of soil between the two tunnels is higher than the ones along other positions. Moreover, the regression model comprising a series of univariate functions is proposed for the annual soil temperature fluctuation estimation for the locations varied distances around the tunnel. This investigation is beneficial to gain an insight into the long-term variation tendencies of local engineering geological conditions of the river beach above shallow sections of the cross-river road tunnels.
shield tunnel; finite difference method; heat influence range; steady heat transfer time; coupled heat transfer effect
The road tunnel using the shield tunneling method is one of the best choices for highway transportation across rivers because of its lack of influence on river navigation and its immunity to extreme weather conditions, such as fog and typhoons. There have been more than 20 shield cross-river road tunnels completed or under construction in China. These tunnels not only go beneath the bottom of the river but also travel under the river beach, where urban residences, transportation and construction projects are located.
Although the issue of soil temperature variations due to the heat transfer from pipe-shaped underground structures[1-2], especially subway tunnels, has been investigated by a number of scholars[3-7], limited attention has been paid to soil temperature variations around cross-river road tunnels to date. Ren et al.[3]obtained the long-term ground temperature distribution trends and identified the constant temperature strata position of Xi’an subway on the basis of the measurements from nine observation stations on four different types of geomorphic units. Hu et al.[4]simulated the heat transfer behavior between the shield subway tunnel and its surrounding soils and obtained results such as heat influence thickness, steady heat transfer time and heat flow quantity. They also identified the primary factors affecting the heat transfer range. These factors include the thermal properties of the surrounding soils, the initial ground temperature and the temperature in the tunnel[5]. Li et al.[6]revealed the heat flow patterns through the surrounding soil to the tunnel, showing a cyclical change within one day. Yu et al.[7]developed a finite difference numerical model to predict the soil temperature around the subway tunnels, and he found that an obvious temperature fluctuation occurs on the interior tunnel surface and in tunnel air because of high-frequency thermal disturbance; however, the impact on soil temperature is limited. What deserves additional attention is that none of these investigations considers the coupled heat transfer effect induced by parallel tunnels.
Even if the shield tunneling methods are used for both subway tunnels and cross-river road tunnels, there are still several differences between them. First, they have different longitudinal thermal boundary conditions. The subway tunnel is connected to the stations, whereas the cross-river road tunnel is totally open at both entrances. Secondly, they have different probabilities for extreme heat transfer scenarios. For example, the road tunnel is more likely to catch fire because the automobile is more apt to burn than the subway train. Finally, the soil types and their saturations around both tunnels are different, implying that they have different soil thermal properties. Therefore, the soil temperature variation tendencies and characteristics obtained from subway tunnels may not be directly applied to cross-river road tunnels.
In this paper, the heat transfer between the Nanjing Yangtze River Tunnel and its surrounding soils was numerically simulated using the finite difference method. The shallow sections under the river beach were chosen as the benchmark sections. The long-term soil temperature variations around the tunnels were predicted, considering the coupled heat transfer effect of parallel tunnels. The characteristics describing the entire heat transfer process, including temperature field distribution, heat influence range, steady heat transfer time, and temperature fluctuation amplitude, were all analyzed in detail. In addition, an annual fluctuation model for soil temperature was also developed. The model can be used to estimate the initial temperature value around the shallow sections of cross-river road tunnels in the event of fire.
1 Governing Equations
The parallel tunnels and soil around can be regarded as a closed system in which heat transfer occurs by conduction. Considering the cyclical unsteady heat transfer behavior of the system caused by environmental temperature variations, the differential equation of heat conduction and boundary conditions comprises the entire mathematical description for this case.
The differential equation of heat conduction yields[8]
(1)
whereρis the density;cis the specific heat;λis the thermal conductivity; andqvis the intensity of inner heat source. This equation denotes the relationship among the system-temperature variation, time, and space.
The boundary conditions include the time-dependent temperature field of the entire system and temperature values of the system boundaries on the initial moment. They are considered to be the first-type boundary condition of the heat transfer[9].
Since synchronous grouting and secondary grouting are implemented during shield tunneling[10], the compactness between the segment and soil can be ensured[11]. The shallow sections of the shield cross-river tunnel are generally within the saturated soils. Therefore, the continuity condition of the interface between the segment exterior and soil is satisfied by ignoring the thermal contact resistance.
2 Problem Definitions
2.1 Engineering background
The Nanjing Yangtze Tunnel includes a pair of slurry shield road tunnels crossing the Yangtze River. Its designed life is 100 years. The length of the shield tunnel part is approximately 3 020 m, and the external diameter of the shield tunnel is 14.57 m. The tunnels are located on the Yangtze River beach with a flat landform. The soils on the ground surface belong to the alluvium of the Quaternary Holocene. The lithology of the soils include silty clay, mucky silty clay, and fine sand.
The mileage of the shield tunnels ranges from K3+600 to K6+620. The section LK3+759 of the left hole is the 80th ring from initial segment on the northern bank, with a distance of 357 m to the entrance, as shown in Fig.1. The levee along Yangtze River is just above this location. Several residential communities under construction and urban roads are distributed within the levee. The elevation of the top of this ring is approximately 15.78 m[12], which can be identified as the shallow section according to the Chinese Code for the Design of Road Tunnels (JTG D70—2004). In former investigations, a quarter of a circular tunnel and its surrounding soils were taken as the heat-transfer system. Unlike them, the system in this benchmark problem takes two tunnels and the soils around them in order to consider the coupled heat-transfer effect. All the geometrical details are illustrated in Fig.2. The saturated physical indices of the soils are listed in Tab.1.
2.2 Basic assumptions
1) The conduction is homogeneous within a single soil layer.
2) The temperature distributions on the ground surface and the segment linings are both regarded as uniform in space.

Fig.1 Geographic location of benchmark section LK3+759

Fig.2 Heat transfer system (unit: m)
3) The temperatures of the two tunnels are identical in the same moment.
4) The soil is saturated, and the influence of underground runoff is not considered.
5) Changes of the thermal properties of the soils are small enough to be ignored.
6) The thermal contact resistance is ignored.
2.3 Analysis parameters
The finite difference software FLAC3Dis employed for numerical simulations. It uses an explicit scheme to solve the difference equations. As shown in Fig.2, the three dimensions of the numerical model are 100, 57.05, and 10 m in length, height and width, respectively. There are 247 511 nodes and 220 590 elements in the model. Three types of elements, tetrahedrons, pentahedrons, and hexahedrons, are used for meshing.

Tab.1 The physical indices of soils
3 Boundary Conditions
3.1 Classifications
The boundary conditions include the ground surface temperature, internal temperature of segment lining, bottom soil temperature, and two vertical boundaries and their initial temperature values. They are all determined by in situ observations and numerical iterations.
3.2 Ground surface temperature
An observation station is established above the tunnel to measure the superficial ground temperature in real time. A Pt100 temperature sensor, with a measurement range from -20 to 150 ℃ and a precision of 0.1 ℃, is laid on the ground surface. In addition, three other Pt100 sensors are laid inside a borehole, buried to depths of 1, 2, 3 m, to measure the superficial soil temperature along the depth. The data is collected every half hour for a year. The measurements of the ground temperature over a total year are illustrated in Fig.3, in which the maximum ground temperature reached 40 ℃ and the minimum temperature reached -5 ℃. In addition, the mean temperature of the soil at the ground surface is 16.9 ℃, whereas the mean air temperature near the surface is estimated to be 16.7 ℃. The close agreement of both temperatures verifies the reliability of the measurements. The temperature at 12:00 on January 1, 2010 is set to be the initial value.

Fig.3 Ground surface temperature above the tunnel
3.3 Segment temperature
A structural health monitoring (SHM) system with six monitoring rings is installed in Nanjing Yangtze River Tunnel[13]. The ring on section LK3+759 is one of the monitoring rings. There are ten segments on each ring. Several sensors are pre-embedded in each segment, including temperature sensors, strain sensors, earth pressure cells, and piezometers. Real-time measurements have been collected since the commencement of the tunnels in May 2010.
The temperature measurements, on the interior of ring LK3+759 from May 2010 to April 2014, reveal that the annual temperature fluctuates in a cosine form with no obvious heat accumulation evidence[14]. The reason is most probably that the ring is close to the entrance and has good ventilation. Therefore, only annual measurements from the ten segments are averaged and used as one of the boundary conditions, as illustrated in Fig.4. The average temperature on January 1st is set to be the initial value.
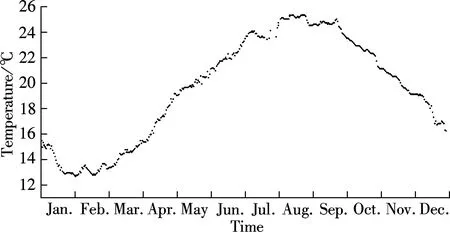
Fig.4 Average internal temperature of segment
3.4 Other boundary conditions
The bottom of the model is 57.05 m underground, reaching the depth of the soil layers with a constant temperature[15-16]. Therefore, the soil temperature at the bottom is treated as a given temperature boundary. Concerning the two vertical temperature boundaries, the length of the model is adjusted by trial and error. It is long enough to eliminate the heat-transfer influences from the tunnels, and thus both vertical boundaries are considered as insulated ones.
The initial temperature distribution along the depth is obtained by numerical iteration. Six rounds of iterations are performed, and the final result is illustrated in Fig.5. It reveals that the soil depth of constant temperature is approximately 10 m underground. The constant temperature of the soil is 16.8 ℃, which agrees well with the mean air temperature of 16.7 ℃ in Fig.3. The soil temperature between the constant temperature layer and the ground surface varies annually. The average temperature on Jan 1st is set to be the initial value.

Fig.5 Temperature distribution along the depth
4 Verification
The simulation results are compared with the measurements from the borehole for verification, as shown in Fig.6. They agree well in the figure, especially for those of 2 and 3 m. The numerical model is thus reliable enough for prediction.

Fig.6 Verification results
5 Results
5.1 Long-term evolution patterns
The model finally converges on a temperature difference of 1×10⁻⁴℃,with a steady heat-transfer time of 68 years. The long-term evolution patterns of the soil temperature are depicted in Fig.7. Due to the recurrent heat exchanges between the soil and the tunnels, the initial constant soil temperature is changed, forming a region of increased temperature surrounding the tunnels.
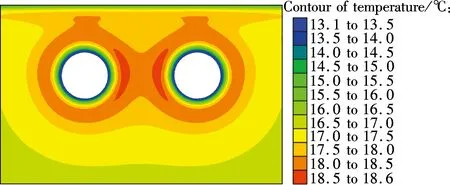
As shown in Fig.7(d), an olive-shaped high-temperature region forms during the high air temperature period, namely during summer, over 6 years. This region gradually expands to form a trapezoid, filling the area between the two tunnels, as shown in Figs.7(f) and (h). The soil temperature within the high-temperature region reaches about 19 ℃, with a temperature increase of about 2 ℃ compared with the initial temperature. During the low air temperature period, namely during winter, two crescent-shaped high-temperature regions form over 6 years. They gradually connect with each other to form an “X,” as shown in Figs.7(e) and (g). A high-temperature region exists because of the heat-transfer coupling of the parallel tunnels.
During the high air temperature period, the soil temperature is between 20 and 24 ℃ within a range of 1 m of the tunnel’s external surface, between 19 and 20 ℃ within a range of 1 to 2 m, and between 18 and 19 ℃ within a range of 2 to 5 m. At that time, the temperature of the surrounding soil is lower than that of the tunnel lining, and thus heat is transferred from the tunnels to the surrounding soil.

(a)

(b)
(c)

(d)

(e)

(f)

(g)

(h)
Fig.7 Long term temperature field evolution patterns. (a) Low air temperature period of 1 year; (b) High air temperature period of 1 year; (c) Low air temperature period of 6 years; (d) High air temperature period of 6 years; (e) Low air temperature period of 20 years; (f) High air temperature period of 20 years; (g) Low air temperature period of 68 years; (h) High air temperature period of 68 years
During the low air temperature period, the soil temperature is between 13 and 17 ℃ within a range of 1.5 m of the tunnel’s external surface, between 17 and 18 ℃ within a range of 1.5 to 2.5 m, and between 18 and 19 ℃ within a range of 2.5 to 8 m. At that time, the temperature of the surrounding soil is higher than that of the tunnel lining, and thus heat is transferred from the surrounding soil to the tunnels. By comparing the temperature distribution patterns in both high and low air temperature periods, a temperature-lag effect is discovered.
Taking the soil constant temperature, between 17 and 18 ℃, as the temperature border, the heat influence range is confined to 9 m over the top, 23 m below the bottom, 18 m away from the vertical exterior of the two tunnels, and the entire area between them.
5.2 Temperature variations along depth
Fig.8 illustrates the long-term soil temperature variations as a function of the depth along the middle line of the two tunnels, where the coupled heat-transfer effect is obvious. The interannual soil temperature curves gradually move to the right, indicating an overall trend of increasing temperature. The amplitude of temperature increase becomes negligible after 20 years. Beneath a buried depth of 10 m, the temperature curve profiles appear much similar in both high and low air temperature periods. Since the soil temperature under 10 m level used to be constant before the tunnels’ construction according to Fig.5, the increasing temperature trend reveals that the soil temperature under this depth is only affected by the tunnels. Between 5 and 10 m, the soil temperature curves transfer smoothly from a high to low air temperature period, indicating that the soil temperature increase is mostly affected by the tunnels and partially by air temperature variations. Between 3.5 and 5 m, the soil temperature curves transfer sharply from a high to low air temperature period, indicating that soil temperature is primarily controlled by air temperature variations but not by the tunnels. Finally, between the ground surface and 3.5 m, the soil temperature curves remain almost the same for 68 years, indicating that the soil temperature is exclusively controlled by solar radiation and air temperature variation.
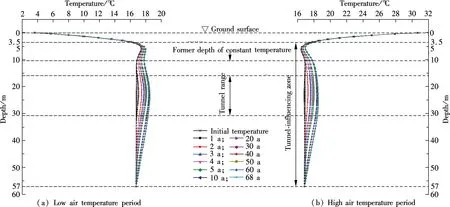
Fig.8 Long term soil temperature variations along the depth. (a) Low air temperature period; (b) High air temperature period
5.3 Extreme temperature variations
The extreme soil temperature variations along four directions are shown in Fig.9. The temperature fluctuation amplitudes within 3 m are much greater than those outside this range. The maximal annual temperature increase (TI) is 7.14 ℃ and the minimal annual temperature decrease is about 3 ℃. The greatest annual peak-to-valley value reaches 10 ℃, where the soil is adjacent to the exterior of segment lining. The smallest peak-to-valley value is approximately 2 ℃. An obvious temperature varying region is identified within 5 m from the tunnel exterior, as well as within the entire range of soil between the two tunnels.

Fig.9 Plot of the temperature increases along four directions
5.4 Interannual variations
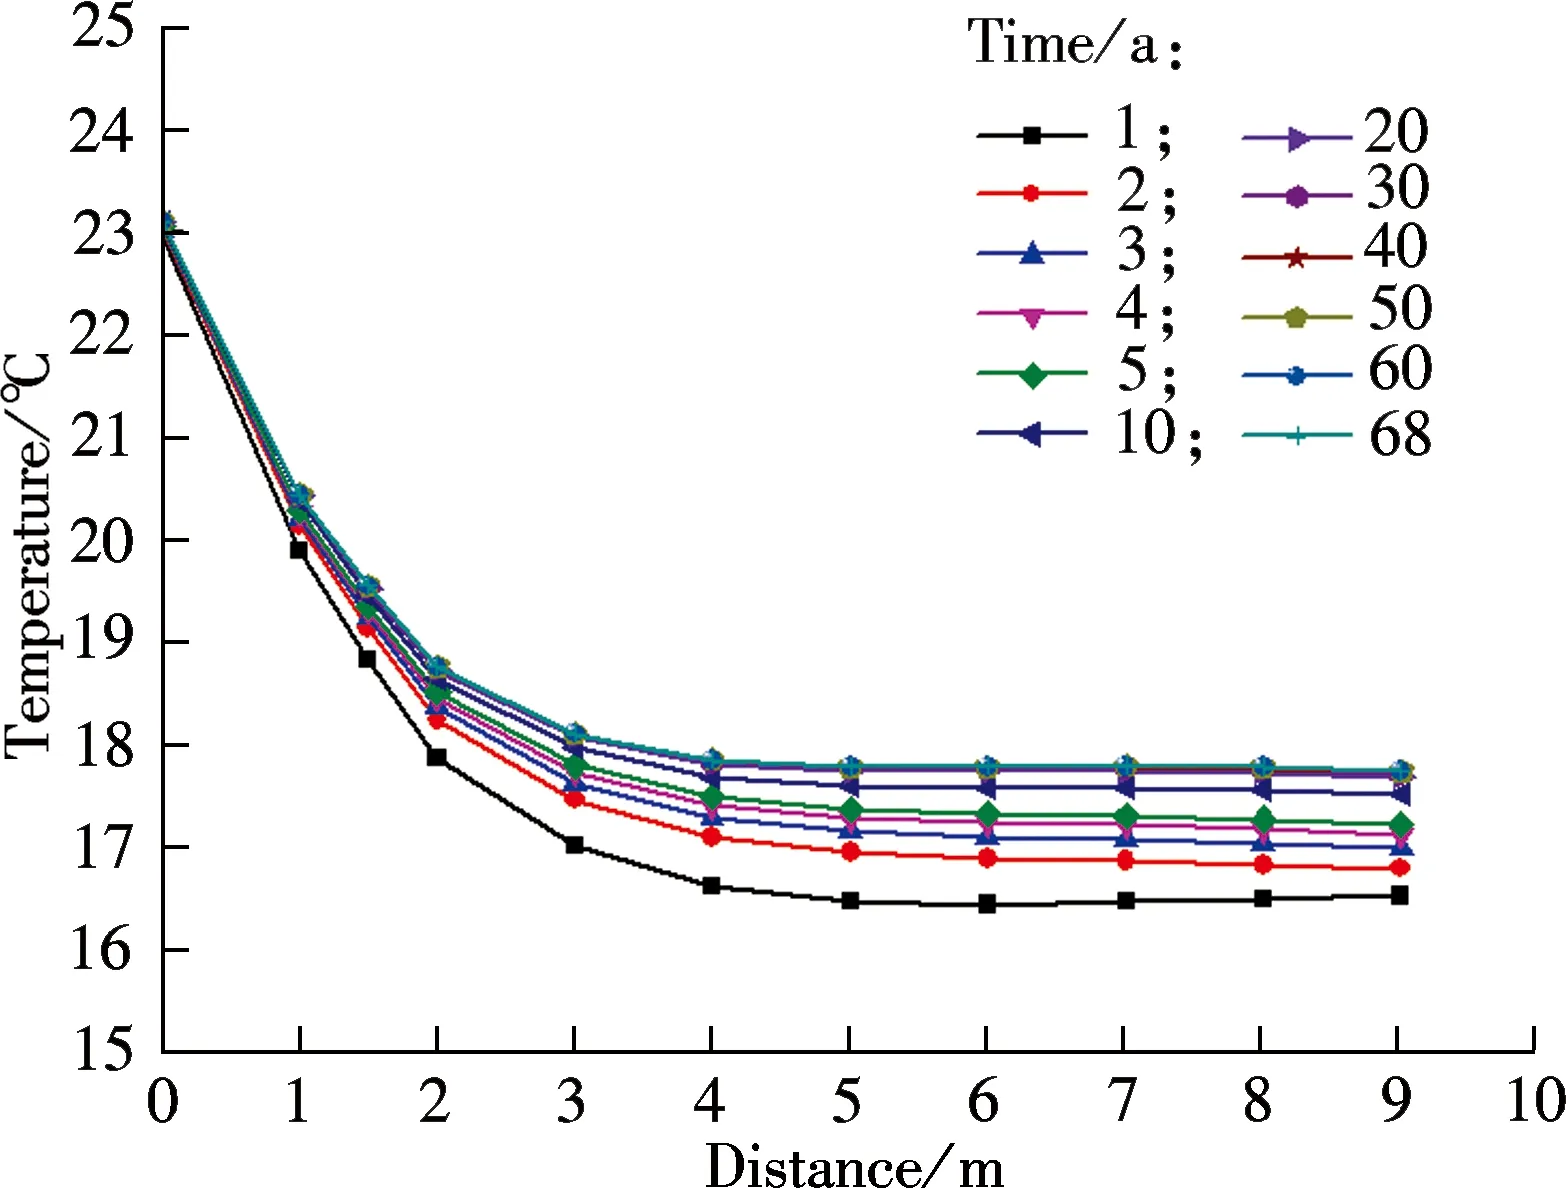
The soil temperature measured at the same position and time was not equal but varied as the years progressed. For example, Fig.10 illustrates the interannual temperature curves along four directions. The segment lining has the highest temperature of the year at 12:00 am on August 15th.
These figures reveal that temperature curves ascend quickly before the first 20 years. However, the curves tend to coincide thereafter. The temperature gradients are greater within 3 m above the tunnels. The gradients are smaller between 3 and 5 m, and close to zero exceeding 5 m. The general tendencies are similar for all four figures, though the final heat steady temperature in Fig.10(b) is higher, proving that the coupled heat-transfer effect is induced by parallel tunnels.
5.5 Annual temperature fluctuations
The air temperature fluctuates daily and annually, which results in soil temperature fluctuation. Investigation indicates that diurnal temperature variations clearly disappear within a ground depth of 1.5 m[8], which is beyond the heat-influence range of this investigation. Therefore, only the annual temperature fluctuation is considered for soils around the tunnels.
The soil temperature within the heat-influence range is calculated every hour, and then the annual fluctuation curves are plotted. Curve fittings are also performed to obtain theoretical equations for the annual fluctuation of soil temperature.
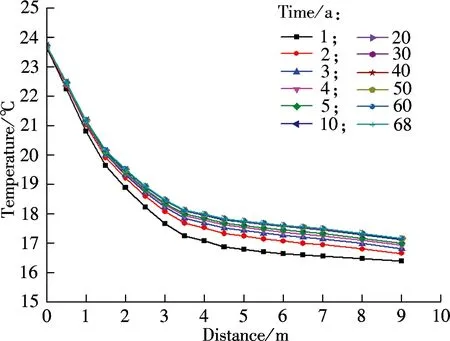
For the curve fitting process, the temperature variation of the soil on top of the tunnels, for the period from 20 to 22 years, is taken as an example. The curved surface depicted in Fig.11 is the regression result of the field values of the calculated soil temperature. The contour colors on the time-distance coordinate plane correspond to the temperature values points projected on the curved surface. The surface is expressed as a series of very complicated Fourier bivariate functions with numerous parameters. For estimation convenience, a series of simple univariate time functions are used to characterize this curved surface. The general formula of the functions is given by wherea0,a1,b1, andωare the parameters of the function. To generate the fitting curve series, distance is varied from 0 to 9 m in 1 m increments. The results are listed in Tab.2. All the correlation coefficients are 0.95, indicating a good agreement. The nine curves are depicted in Fig.12.
(a)

(b)

(c)
(d)
T(t)=a0+a1cosωt+b1sinωt
(2)

Fig.11 The curved surface of annual fluctuation

Fig.12 Fitting curve series
The annual fluctuation tendency at a certain distance exhibits a sine or cosine function, and the temperature fluctuation amplitude is attenuated with the distance elongation. In addition, the degree of phase lag also increases with distance elongation.
According to Eq.(2) and Tab.2, the fluctuation range is identified for temperature estimation. The estimation accuracy can be further improved by narrowing down the distance nets.
6 Discussion
The simulation results reveal that heat transfer is a type of non-negligible disturbance from cross-river road tunnels to the surrounding soils, especially for the shallow sections under the river beach, where the soft clay and clayey soil mostly surround the tunnel. An obvious temperature-varying region is discovered forming around the tunnels, and the maximum temperature increase is 7.14 ℃. The temperature increase of clayey soil influences its moisture migration and skeletal structure, which further influences its hydrological properties, such as moisture, saturation, permeability and swell-shrink; furthermore, it influences the state of the clay, i.e., liquid or solid[17]. Its physical and mechanical properties are also influenced[18-20]. For example, normally consolidated clayey soil contracts under heating, whereas over-consolidated soil dilates[21], meaning that a ground settlement or heave might arise[22]. On the other hand, once a fire occurs in the tunnel, the temperature of the interior concrete segment lining will exceed 1 000 ℃ and the surrounding soil temperature may accordingly reach a high temperature near 100 ℃, if the fire lasts for hours[23-24]. Investigations reveal that the hydraulic conductivity of soil increases as its temperature rises. For example, the hydraulic conductivity of clay at 80 ℃ is approximately three times that at 20 ℃[25], implying that the pore water pressure on the tunnel lining will be significantly increased. This possible overload may lead to further tunnel structural damage such as segment cracking. By using the heat-transfer range and the annual fluctuation model deduced herein, a good estimation for the soil temperature field around shallow sections of the cross-river tunnel is provided.

Tab.2 Fitting parameters of the soil temperature above the tunnels
7 Conclusions
The temperature variations of soils around a pair of cross-river road tunnels, primarily focusing on the shallow sections under the river beach, are explored using the finite difference method. Several conclusions can be drawn from this investigation.
1) Cross-river tunnels connect air with the surrounding soil, formerly of constant temperature, which then varies annually. Heat transfers from the surrounding soil to the tunnels during the low air temperature period and flows in the opposite direction during the high air temperature period. 2) A heat-influence range is discovered and confined within 9 m over the top, 23 m below the bottom, and 18 m away from the vertical exterior of the two tunnels, as well as within the entire area between them. However, the obvious heat transfer region is within 5 m from the tunnel exterior, as well as the entire area between the two tunnels.
3) Under the mentioned engineering and geological conditions, the ultimate steady heat transfer time is computed to be 68 years; however, most of the heat transfer has been completed by within 20 years.
4) The maximum temperature increase is 7.14 ℃, and the maximum peak-to-valley value of annual temperature increase is 10 ℃.
5) The temperature variation of soil between 5 and 10 m is primarily influenced by the heat transfer from the tunnels and partially by air temperature variations. The temperature variation of soil below 10 m is totally controlled by the heat transfer from the tunnels.
6) The coupled heat-transfer effect induced by parallel tunnels is confirmed because the ultimate steady temperature of soil between the two tunnels is higher than that elsewhere.
7) The regression model comprising a series of univariant functions is proposed for the annual soil temperature fluctuation estimation.
[1]Bansal V, Misra R, Agarwal G D, et al. Transient effect of soil thermal conductivity and duration of operation on performance of earth air tunnel heat exchanger [J].AppliedEnergy, 2013, 103: 1-11.
[2]Li X G, Zhao J, Zhou Q. Inner heat source model with heat and moisture transfer in soil around the underground heat exchanger [J].AppliedThermalEngineering, 2005, 25(10): 1565-1577.
[3]Ren Jianxi, Liu Jiahui, Gao Huyan, et al. Study on distribution law and observation of ground temperature in spring along Xi’an subway [J].JournalofRailwayEngineeringSociety, 2012(3): 101-106. (in Chinese)
[4]Hu Zenghui, Li Xiaozhao, Zhao Xiaobao, et al. Analysis and prediction of the temperature distribution around tunnels [J].ChineseJournalofUndergroundSpaceandEngineering, 2009, 5(5): 867-872.
[5]Hu Zenghui, Li Xiaozhao, Zhao Xiaobao, et al. Numerical analysis of factors affecting the range of heat transfer in earth surrounding three subways [J].JournalofChinaUniversityofMining&Technology, 2008, 18(1): 67-71.
[6]Li Xiaozhao, Xiong Zhiyong, Qiao Hengjun, et al. Monitoring and analysis of heat transfer through surrounding rocks of subway tunnel [J].ChineseJournalofUndergroundSpaceandEngineering, 2012, 8(1): 105-110. (in Chinese)
[7]Yu Lianguang, Wu Xiping, Yu Henan. Effect of high-frequency thermal disturbance on soil temperature around the metro tunnels [J].JournalofCivil,Architectural&EnvironmentalEngineering, 2011, 33(5): 95-101. (in Chinese)
[8]Zhang Ximin, Ren Zepei, Mei Feiming.Heattransfer[M]. Beijing: Chinese Architecture & Building Press, 2001: 15-16; 73. (in Chinese)
[9]Incropera F P, Dewiit D P.Fundamentalsofheatandmasstransfer[M]. 6th ed. New York: Wiley Press, 2006: 13-17.
[10]Maidl B, Herrenkneht M, Maidl U, et al.Mechanisedshieldtunnelling[M]. Berlin, Germany: Wilhelm Ernst & Sohn, Verlag für Architektur und Technische Wissenschaften GmbH & Co. KG, 2012: 162-163.
[11]Thewes M, Budach C. Grouting of the annular gap in shield tunneling—an important factor for minimization of settlements and for production performance [C]//ProceedingsoftheITA-AITESWorldTunnelCongress. Budapest, Hungary, 2009: 529-530.
[12]Huang Fu, Qing Changbing, Li Shucai. Determination of minimum cover depth for shallow tunnel subjected to water pressure [J].JournalofCentralSouthUniversity, 2013, 20(8): 2307-2313.
[13]Zhang Wei, Sun Ke, Lei Changzheng, et al. Fuzzy analytic hierarchy process synthetic evaluation models for the health monitoring of shield tunnels [J].Computer-AidedCivilandInfrastructureEngineering, 2014, 29(9): 676-688.
[14]Zhang Wei, Sun Ke, Zhang Yuncong. Health monitoring report on Nanjing Yangtze River Tunnel in operation period [R]. Nanjing: School of Earth Sciences and Engineering, Nanjing University, 2014. (in Chinese)
[15]Ozgener O, Ozgener L, Tester J W. A practical approach to predict soil temperature variations for geothermal (ground) heat exchangers applications [J].InternationalJournalofHeatandMassTransfer, 2013, 62: 473-480.
[16]Mihalakakou G, Santamouris M, Lewis J O, et al. On the application of the energy balance equation to predict ground temperature profiles [J].SolarEnergy, 1997, 60(3/4): 181-190.
[17]Liu B, Liu W, Peng S. Study of heat and moisture transfer in soil with a dry surface layer[J].InternationalJournalofHeatandMassTransfer, 2005, 48(21/22): 4579-4589.
[18]Abuel-Naga H, Bergado D, Bouazza A. Thermally induced volume change and excess pore water pressure of soft Bangkok clay [J].EngineeringGeology, 2007, 89(1/2): 144-154.
[19]Bruyn D, Thimus J. The influence of temperature on mechanical characteristics of Boom clay: the results of an initial laboratory programme [J].EngineeringGeology, 1996, 41(104): 117-126.
[20]Cekervac C, Laloui L. Experimental study of thermal effects on the mechanical behaviour of a clay [J].InternationalJournalofNumericalAnalyticalMethodinGeomechanics, 2004, 28(3): 209-228.
[21]Tanaka N, Graham J, Crilly T. Stress-strain behavior of reconstituted illitic clay at different temperatures [J].EngineeringGeology, 1997, 47(4): 339-350.
[22]Yang Yuyou, Li Hongan. Failure mechanism of large-diameter shield tunnels and its effects on ground surface settlement [J].JournalofCentralSouthUniversity, 2012, 19(10): 2958-2965.
[23]Savov K, Lackner R. Stability assessment of shallow tunnels subjected to fire load [J].FireSafetyJournal, 2005, 40(8): 745-763.
[24]Li Y, Lei B, Ingason H. The maximum temperature of buoyancy-driven smoke flow beneath the ceiling in tunnel fires [J].FireSafetyJournal, 2011, 46(4): 204-210.
[25]Cho W J, Lee J O, Chun K S. The temperature effects on hydraulic conductivity of compacted bentonite [J].ApplyClayScience, 1999, 14(1/2/3): 47-58.
越江公路隧道浅埋段地温长期演化的数值预测
王志明1张 巍2雷长征2丁蓬莱2孙 可2
(1东南大学建筑设计研究院有限公司, 南京 210096)(2南京大学地球科学与工程学院, 南京 210046)
在考虑并行隧道耦合传热的前提下,预测越江公路隧道江岸浅埋段地温的长期演化,使用有限差分法进行数值模拟,通过现场观测与数值迭代方式确定边界条件与初值.模拟结果表明:最终的计算稳定传热时间为68年,但传热在20年内即基本完成;隧道周围的初始恒温土层最终被转变为年变温土层;隧道外侧5 m及两孔之间出现了一个显著变温区,其最大温升值为7.14 ℃,最大年度温升的峰谷值为10 ℃;隧道周围10 m以下土层的温度变化仅由隧道传热所控制;两孔之间土层的最终稳定温度要高于其他位置的最终稳定温度,证实了耦合传热效应的存在.此外,还提出了一组单变量函数的回归模型,用以估计隧道周围不同位置土层的年度温度波动量.该研究将有助于深入探究隧道浅埋段所穿越江滩区域工程地质条件的长期演化趋势.
盾构隧道; 有限差分法; 热影响范围; 传热稳定时间; 耦合传热效应
P642.1
Received 2014-06-18.
Biographies:Wang Zhiming (1970—), male, doctor, senior engineer; Zhang Wei (corresponding author), male, doctor, associate professor, wzhang@nju.edu.cn.
s:The National Natural Science Foundation of China (No.40902076), the Natural Science Foundation of Jiangsu Province (No.BK20141224).
:Wang Zhiming, Zhang Wei, Lei Changzheng, et al. Numerical prediction of the long-term soil temperature variations around shallow sections of cross-river road tunnels[J].Journal of Southeast University (English Edition),2014,30(4):480-488.
10.3969/j.issn.1003-7985.2014.04.014
10.3969/j.issn.1003-7985.2014.04.014
猜你喜欢
杂志排行

Journal of Southeast University(English Edition)的其它文章
- Simulation of urban affordable housing land-use evolution based on CA-MAS model
- Dynamical chiral symmetry breaking in QED3
- A decision model of optimal production reliability and warranty length in an imperfect production system
- Metal cation crosslinking of TiO2-alginate hybrid gels
- One-pot facile synthesis of highly photoluminescent graphene quantum dots with oxygen-rich groups
- Modeling household car ownership using ordered logistic regression model