LC-MS/MS assay for pitavastatin in human plasma and subsequent application to a clinical study in healthy Chinese volunteers
2014-04-20QinLiuHuiZhoLirongZhoMioLiMeilnCuiWengngRen
,Qin Liu,*,Hui Zho,Lirong Zho,Mio Li, Meiln Cui,Wengng Ren
aShenyang Pharmaceutical University,No.103,Wenhua Road,Shenyang 110016,China
bQidu Pharmaceutical Co.,LTD.,28 Renmin East Road,Linzi Zone,Zibo 255000,China
Short Communication
LC-MS/MS assay for pitavastatin in human plasma and subsequent application to a clinical study in healthy Chinese volunteers
Tengrui Yina,Qian Liua,*,Hui Zhaoa,Lirong Zhaoa,Hui Liua,Miao Lia, Meilan Cuib,Wengang Renb
aShenyang Pharmaceutical University,No.103,Wenhua Road,Shenyang 110016,China
bQidu Pharmaceutical Co.,LTD.,28 Renmin East Road,Linzi Zone,Zibo 255000,China
A R T I C L E I N F O
Article history:
Received 21 April 2014
Received in revised form
3 July 2014
Accepted 12 July 2014
Available online 30 August 2014
Pitavastatin
Arapid,selectiveandsensitiveliquidchromatography-tandemmassspectrometry(LC-MS/ MS)method has been developed and validated for the determination of pitavastatin in humanplasma.Followingaliquid-liquidextraction,boththeanalytesandinternalstandard telmisartan were separated on a Luna C18column with a mobile phase consisted of acetonitrile-methanol-1%formic acid in water(50:25:25,v/v/v).Mass spectrometric detection involved electrospray ionization in the positive ion mode followed by multiple reaction monitoring(MRM)of the transitions at m/z 421.9 → 290.1 for pitavastatin and m/z
515.2 → 276.2 for the IS.The assay for pitavastatin showed good linearity(r ≥ 0.99)over the ranges0.2-400ng/ml,withalowerlimitofquantitation of0.2ng/ml.Accuracy andprecision for the assay were determined by calculating the intra-and inter-batch variation of quality control(QC)samplesatthreeconcentrationlevels,withrelativestandarddeviations(RSD)of less than 15%for both analytes.The mean extraction recovery of pitavastatin and IS were both above 70%.Matrix effect hasn't been found in this method.The method has been successfully applied to a clinic pharmacokinetic study of pitavastatin administered.
© 2014 Shenyang Pharmaceutical University.Production and hosting by Elsevier B.V.This is an open access article under the CC BY-NC-ND license(http://creativecommons.org/ licenses/by-nc-nd/3.0/).
1. Introduction
3-Hydroxy-3-methylglutaryl coenzyme A(HMG-CoA)reductase inhibitors(statins)inhibit the synthesis of mevalonate,a ratelimiting step in cholesterol level.Competitive inhibition of HMG-CoA reductase by the statins decreases hepatocyte cholesterol synthesis,which results in increased extraction of LDL-C from the blood and decrease circulating LDL-C concentrations[1].High plasma LDL-cholesterol is a risk factor of cardiovascular diseases and,therefore,cholesterol-lowering drugs are used to prevent them.Some randomized controlled trialshaveshownthatstatinshavepotentcholesterol-loweringeffects and reduce the risk of cardiovascular diseases in everyday medical practice[2-5].
Pitavastatin(NK-104,previously called itavastatin or nisvastatin)is a novel,fully synthetic statin with the chemical name of(+)-monocalcium bis(3R,5S,6E)-7-[2-cyclopropyl-4-(4-f l uorophenyl)-3-quinolyl]-3,5-dihydroxy-6-heptenoate (C50H46CaF2N2O8)[6,7].It can reduce plasma level of LDL-cholesterol by 40%in hypercholesterolaemic patients[8].Pitavastatin has been launched in Japan,and is becoming available in Europe,the US,and Asia.Normal-phase HPLC with UV detection was described by Kojima et al.,with a LLOQ of 0.5 ng/ml achieved[9].However,the chromatographic run time for one sample was relatively long(25 min).Hui et al.[10] used above method and achieved a LLOQ of 1.0 ng/ml.Lv et al. [11]established an HPLC-MS/MS method with liquid-liquid extraction(LLE)to determine pitavastatin in human plasma, with a LLOQ of 0.2 ng/ml.The need to better characterize the clinical pharmacokinetic properties of pitavastatin compelled us to set up and validate a simple,specif i c and sensitive analyticalmethod.Inthis study,a technique basedonLC-MS/ MS intended for the determination of pitavastatin was developed and validated,with a LLOQ of 0.2 ng/ml and shorter chromatographic cycle time(2.1 min).This method was successfully applied to clinical pharmacokinetic study among Chinese people.
2. Materials and methods
2.1. Chemicals and reagents
PitavastatincalciumweresuppliedbyQiduCompanyLtd.,and telmisartan(internal standard,IS)were from the National Institute for the Control of Pharmaceutical and Biological Products(Beijing,China).Thepurityofthetwochemicalswere 99.7%,99.3%,respectively.HPLC grade methanol,acetonitrile, amino acid and ammonium acetate(purity: ≥99.5%)were all obtained from Dikma(Beijing,China).All other chemicals and reagents were of analytical grade and were used without any further purif i cation.
2.2. Instrumentation
An Agilent 1100 system(Agilent,USA)consisting of a vacuum degasser(G1379A),a quaternary pump(G1311A),a column oven(G1316A)and an autosampler(G1313A)was used for solvent and sample delivery.An Applied Biosystems API 2000 triple-quadrupole mass spectrometer equipped with a Turbo IonSpray ionization(ESI)source was used for mass spectral analysis and the system was operated in positive mode.Data acquisition wasperformedwith Analyst1.4.1software (Applied Biosystems,USA).Peak integration and calibration were carried out using SPSS 11.5 software(SPSS Inc.,USA).
2.3. Operating conditions
Separations of analytes were achieved using a Luna C18column(50 mm × 2.0 mm,5 μm)protected by a Security guard (Waters,Inc.),eluting isocratically at 0.25 ml/min with a mobile phase ofacetonitrile-methanol-0.1% formic acid (50:25:25,v/v/v).The run time of one sample was about 2.1 min.In order to assure the repeatability of retention time, the column temperature was controlled at 20°C.The optimized TurboIonSpray voltage and temperature were set at 5000 V and 400°C,respectively.The source parameters,viz. the nebulizer gas,curtain gas,auxiliary gas and collision gas were set at 60,20,70 and 5 psi,respectively.The compound parameters viz.the declustering potential(DP),collision energy(CE),entrance potential(EP)and collision cell exit potential(CXP)were 60,42,8,6 eV and 80,70,10,5 eV for the IS. Based on the full-scan MS and MS/MS spectra of the drug,the most abundant fragment ion was selected and the mass spectrometer was set to monitorthe transition m/z 421.9 → m/ z 290.1 for pitavastatin and m/z 515.2 → m/z 276.2 for IS, respectively.The production scan of pitavastatin and telmisartanwas shownin Fig.1.The scan time for each analyte was set to 0.2 s.
2.4. Drug administration and sample collection
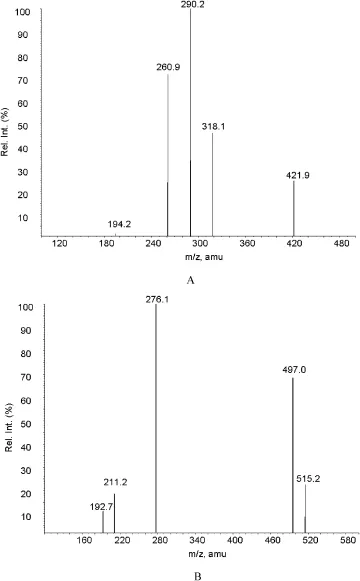
Fig.1-Production scan of(A)pitavastatin and(B) telmisartan.
An open-label,randomized study was conducted in Phase I Clinical Research Institute of the Beijing Military GeneralHospital(Beijing,P.R.China).The Independed Ethics Committee(IEC)of Beijing Military General Hospital approved the protocol and the volunteers were provided with informed written consent.Thirty healthy Chinese volunteers(15 females and 15 males)were chosen to attend the study.The volunteers aged between 23 to 33 y and their IBM f i gures were between 19 and 24.Subjects were randomized into one of three groups(10 subjects/group)to be given a single dose of 1, 2 and 4 mg pitavastatin per day.Blood samples were collected at pre-dose and 0.17,0.33,0.5 0.75,1,1.5,2,3,4,8,12,24 and 48 h,in heparin vacutainer collection tubes.The tubes were centrifuged at 3000 r/min for 10 min and the plasma was collected.The collected plasma samples were stored at-70°C till their use.The 2 mg group then completed a 7-day washout period.Beginning on the morning of day 8,subjects received 2 mg of pitavastatin once daily for a total of 7 doses.
2.5. Preparation of stock solutions of analytes and IS
The stock solutions of pitavastatin(100 μg/ml)and the IS (100 μg/ml)were separately prepared in methanol.Serial dilutions were prepared with methanol at concentrations of 2000,1000,500,100,50,10,5,2.5 and 1 ng/ml for pitavastatin, respectively.Working solutions of IS were prepared by further diluting the IS stock solutions with methanol at concentrations of 1 μg/ml and 50 ng/ml.All the working standard solutions were stored at 4°C;they were found to be stable for 8 d.
2.6. Preparation of calibration curves and quality control samples
Calibration samples were prepared by spiking 250 μl of control human plasma with 50 μl working standard solution of the analyte,to produce the matrix-matched calibration standards at concentrations of 0.2,1.0,2.0,10.0,20.0,100.0,200.0, 400.0 ng/ml of pitavastatin.Each sample also contained 50 μl IS solutions(50 ng/ml).In each calibration run a plasma blank sample(no IS)was also analyzed.
The QC samples of three different concentration levels(0.5, 20,320 ng/ml)were selected to cover the entire range of calibrations.They were prepared daily by spiking 250 μl plasma samples with appropriate volumes of a standard solution to produce the stated f i nal concentration of pitavastatin and 50 ng/ml of the IS.
2.7. Sample preparation
QC samples,calibration standards,and clinical plasma samples were extracted employing a LLE technique.To each tube containing 250 μl plasma,50 μl of the 50 ng/ml of the IS,and 100 μl of 0.05 mol/l phosphoric acid,vortexed for 1 min,then 2 ml of a mixture of ether:dichloromethane(4:1,v/v)were added,and the mixture was then vortexed for 10 min.The samples were then centrifuged for 5 min at 10,000 r/min. 1.5 ml of the organic layer was transferred to another clean tube and was evaporated to dryness at 38°C under a gentle stream of nitrogen.The residue was dissolved in 100 μl of the mobile phase,and a 15 μl aliquot was injected onto the LC-MS/MS system for analysis.
2.8. Mehtod validation
The analytical procedure was validated in terms of specif i city,sensitivity,linearity,precision and accuracy,extracition recovery,matrix effect and stability.Specif i cy of the method was assessed by analyzing six blank human plasma matrix samples.The responses of the interfering substances or background noises at the retention time of the pitavastatin are acceptable if they are less than 20%of the response of the lowest standard curve point or LLOQ.The responses of the interfering substances or background noise at the retention time of the internal standard are acceptable if they are less than 5%of the response of the workinig internal standard.
Calibration curves for each analyte were individually constructed by least-squares linear regression analysis of an eightpoint calibration curve by plotting analyte-to-IS peak area ratio versus its nominal concentration,using 1/x2as a weighting factor.Sensitivity was established from the background noise or response from six spiked LLOQ samples.The six replicates should have a precision of ≤20%and an accuracy of ±20%.
The intra-day accuracy and precision were evaluated by analyzing six replicates at three QC concentration levels for human plasma samples on the same day.The inter-day assay accuracy and precision were determined by analyzing the three-level QC samples on three runs in three consecutive d.The criteria for acceptability of the data included accuracy within ±15%deviation from the nominal values and a precision of within 15%relative standard deviation(RSD),except at the LLOQ,where it should not exceed ±20%.
Extraction recovery and matrix effect were evaluated at three concentration levels(LQC,MQC and HQC)for each analyte and at the working concentration for internal standards.Post-spiked QCs used in recovery and matrix effect test,were prepared by spiking the extracted bland matrix with analyte and IS to ensure that concentrations are equivalent to those in the LQC,MQC and HQC extracted samples.Extraction recovery was calculated by comparing the signal of analyte or IS of regular QCs with those of postspiked QCs.Matrix effect was evaluated by comparing the signal of post-spiked QCs with those of the neat solutions at LQC,MQC and HQC levels.
Stability tests were conducted to evaluate the analyte stability in stock solutions and in plasma samples under different conditions.The stock solution stability at refrigerated conditions(4°C)was performed by comparing the area responseofthe analytes(stability samples)with the response of the sample prepared from fresh stock solution. Bench top stability(2 h),processed samples stability(room temperature for 8 h),freeze-thaw stability(two cycles),and long-term stability(20 d)were performed at LQC,MQC and HQC levels using three replicates at each level.Samples were considered to be stable ifassay valueswere withinthe acceptable limits of accuracy(±15%SD)and precision (≤15%RSD).
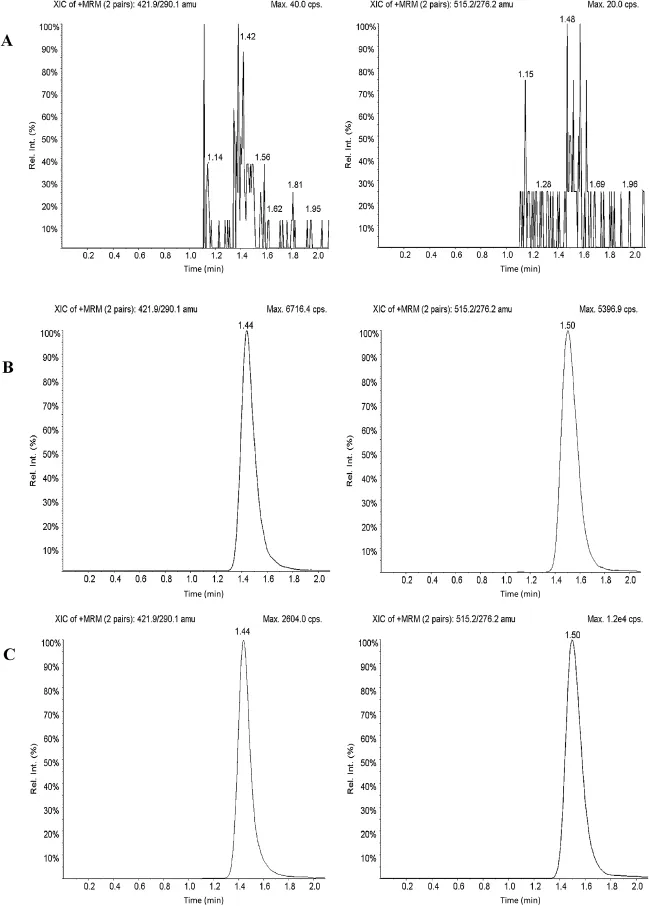
Fig.2-Typical MRM chromatograms of pitavastatin(left panel)and IS(right panel)in(A)human blank plasma,and(B) human plasma spiked with IS,and(C)a plasma sample from a volunteer 3.0 h after oral administration of 1 mg pitavastatin.

Table 1-Intra-day and inter-day precision and accuracy for pitavastatin.
3. Results and discussion
3.1. Mass spectrometry and chromatography conditions
The objective of the present work was to develop and fully validate a LC-MS/MS method for the determination of pitavastatin in human plasma.To realize this aim,the extraction procedure,mass spectrometry and chromatographic conditions were optimized.Due to the alkaline nitrogen atom on the pyridine cycle in the molecular structure,the positive ionization mode should be more appropriate for pitavastatin than the negative mode.The mass spectrograms of pitavastatin and the internal standard telmisartan exhibited a protonated molecular ion at m/z 421.9 and 515.2,respectively. The high collision energy gave the most abundant product ion at m/z 290.1 and 276.2 for pitavastatin and telmisartan, respectively.Therefore,the precursor to product transition was assigned in the selected reaction monitor mode as follows:m/z 421.9 → m/z 290.1 for pitavastatin and m/z 515.2 → m/z 276.2 for telmisartan.In order to obtain the highest sensitivity,the mass spectrometry parameters were optimized by the auto-tuning.To attain an ideal Taylor cone and a better impact on spectral response,the nebulizer gas (gas 1)pressure was optimized at 60 psi.The ion transfer capillary temperature was set at 400°C.The ion spray voltage was 5000 V.Collision energies were set at 42 and 70 V for pitavastatin and telmisartan(IS),respectively.The unit resolution was set for both Q1 and Q3 mass detection.
Tooptimizechromatographicconditionsandobtain shorter run time,different methanol and acetonitrile ratios had been tried,25%methanol and 50%acetonitrile was suitable for determination of the analytes.The high organic solvent content shortened the chromatographic cycle time and the acid modif i er,formic acid,improved the signal intensity greatly.Therefore,the mixture of acetonitrile,methanol and 1%formic acid(50:25:25,v/v/v)was f i nally used as mobile phase.A f l ow rate of 0.25 ml/min permitted a run time of 2.1 min.
3.2. Method validation
3.2.1. Selectivity
The degree of interference by endogenous plasma constituents with the analytes and IS was assessed by inspection of chromatograms derived from processed blank plasma sample.As shown in Fig.2,no signif i cant direct interference in the blank plasma traces was observed from endogenous substances in drug-free plasma at the rentention time of the analytes.
3.2.2. Linearity,sensitivity,accuracy and precision
The method exhibited good linear response for the concentration range 0.2-400 ng/ml with correlation coeff i cients of 0.9974.The linear equation for the concentration vs.the peak area was y=0.0641x+0.00826 where y is analyte/IS peak area ratio and x is analyte concentration.The LLOQ for pitavastatin was found to be 0.2 ng/ml.Three concentrations of QC samples were analyzed to determine the accuracy and precision of the assay.Precision and accuracy data for intra-and inter-day plasma samples were presented in Table 1.The accuracy expressed as bias and precision expressed as RSD were all found to be within the criteria limit.
3.2.3. Recovery and matrix effects
The recoveries,matrix effects for pitavastatin and IS are presented in Table 2.The mean extraction recoveries for pitavastatin were 79.9 ± 8.23%,71.5 ± 13.9%and 74.4 ± 6.35%at concentrations of 0.5,20 and 320 ng/ml,respectively.The mean extraction recoveries of the IS were 76.5 ± 12.8%at concentrations of 50 ng/ml.Matrix interferences caused by plasma were evaluated by comparing the peak areas of the post-spiked standards with those of the neat standard at the QC concentrations.In this study,the matrix effects of the analytes were 104.3 ± 11.4%,102.8 ± 7.73%and 100.7 ± 8.41%atconcentrations of 0.5,20 and 320 ng/ml,respectively.The matrix effect of the IS were 98.9 ± 4.57%at concentrations of 50 ng/ml.The results indicates that the plasma extract did not cause signif i cant ionization suppression or enhancement for both analytes and IS in different lots of plasma.
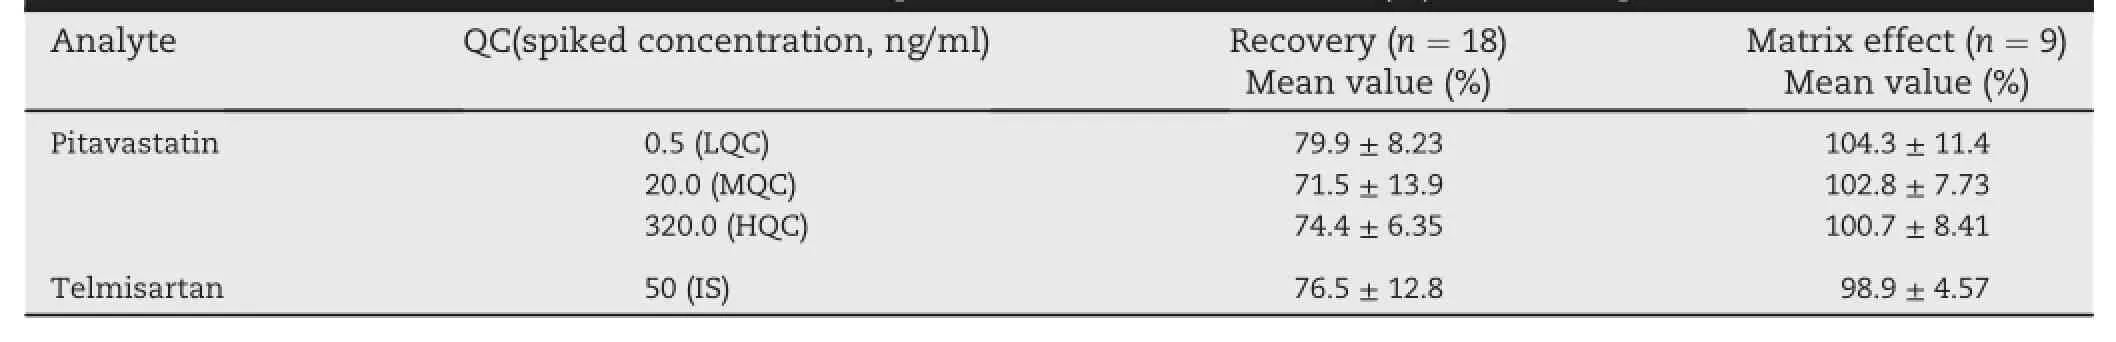
Table 2-Absolute recoveries and matrix effect of pitavastatin and telmisartan(IS)in human plasma.

Table 3-Stability samples result for pitavastatin in human plasma.
3.2.4. Stability
QC samples were subjected to short-term room temperature conditions,long-term storage conditions(-20°C),and two freeze-thaw recycles.All the stability studies were conducted at three concentration levels with three determinations for each.The stability experiment conf i rmed that samples were stable over 20 d when stored at-20°C and through 2 freezethaw cycles.The plasma samples were stable for at least 2 h pre-preparation and 8 h post-preparation at room temperature.Detail stability data are shown in Table 3.
3.3. PK study
The validated LC/MS/MS method was successfully applied in Phase I clinical pharmacokinetic study to quantify the pitavastatin concentration in plasma which were collected from Chinese volunteers after the administration of a single oral dose of 1,2 and 4 mg pitavastatin and a multiple dose of 2 mg pitavastatin followed.Prof i les of the mean plasma concentration-time curves after administration at three single dosage levels and multiple dosage level of 2 mg are presented in Figs.3 and 4.The main pharmacokinetic parameters are listed in Table 4.
The pharmacokinetics results showed that plasma Cmaxvalues of pitavastatin at three single dosage levels were 27.8 ± 9.11,51.5 ± 15.0 and 108 ± 45.5 ng/ml,respectively.The absorption of pitavastatin was rapid,with t1/2occurring 0.65 ± 0.17,0.81 ± 0.34 and 0.88 ± 0.18 h,respectively.The area under the curve(AUC)were found to be 82.5 ± 32.2,146 ± 39.2 and 272 ± 102 ng h/ml,respectively.After the administration of a single dose 2 mg pitavastatin,the Cmaxand AUC were 62.5 ng/ml and 207.4 ng h/ml in another study in Chinese[12], which is similar with the results of this study.However,the results of this study were different from another study in Japanese volunteers,in which Cmaxand AUC were found to be 26.1 ng/ml and 58.8 ng h/ml,respectively[9].We assume that this is caused by the individual difference among the subjects who participated in the trials.In this study, Comparing by single-factor analysis of variance,no signif icant differences were found among the following pharmacokinetic parameters:t1/2,MRT0-48h,MRT0-∞,CL/F and Vd/F after a single oral administration of pitavastatin at three dosage levels.The linearities between pharmacokinetic parameters(Cmax,AUC0-48hand AUC0-∞)and dosage levels were good(correlation coeff i cient r > 0.99),suggesting linear pharmacokinetics.
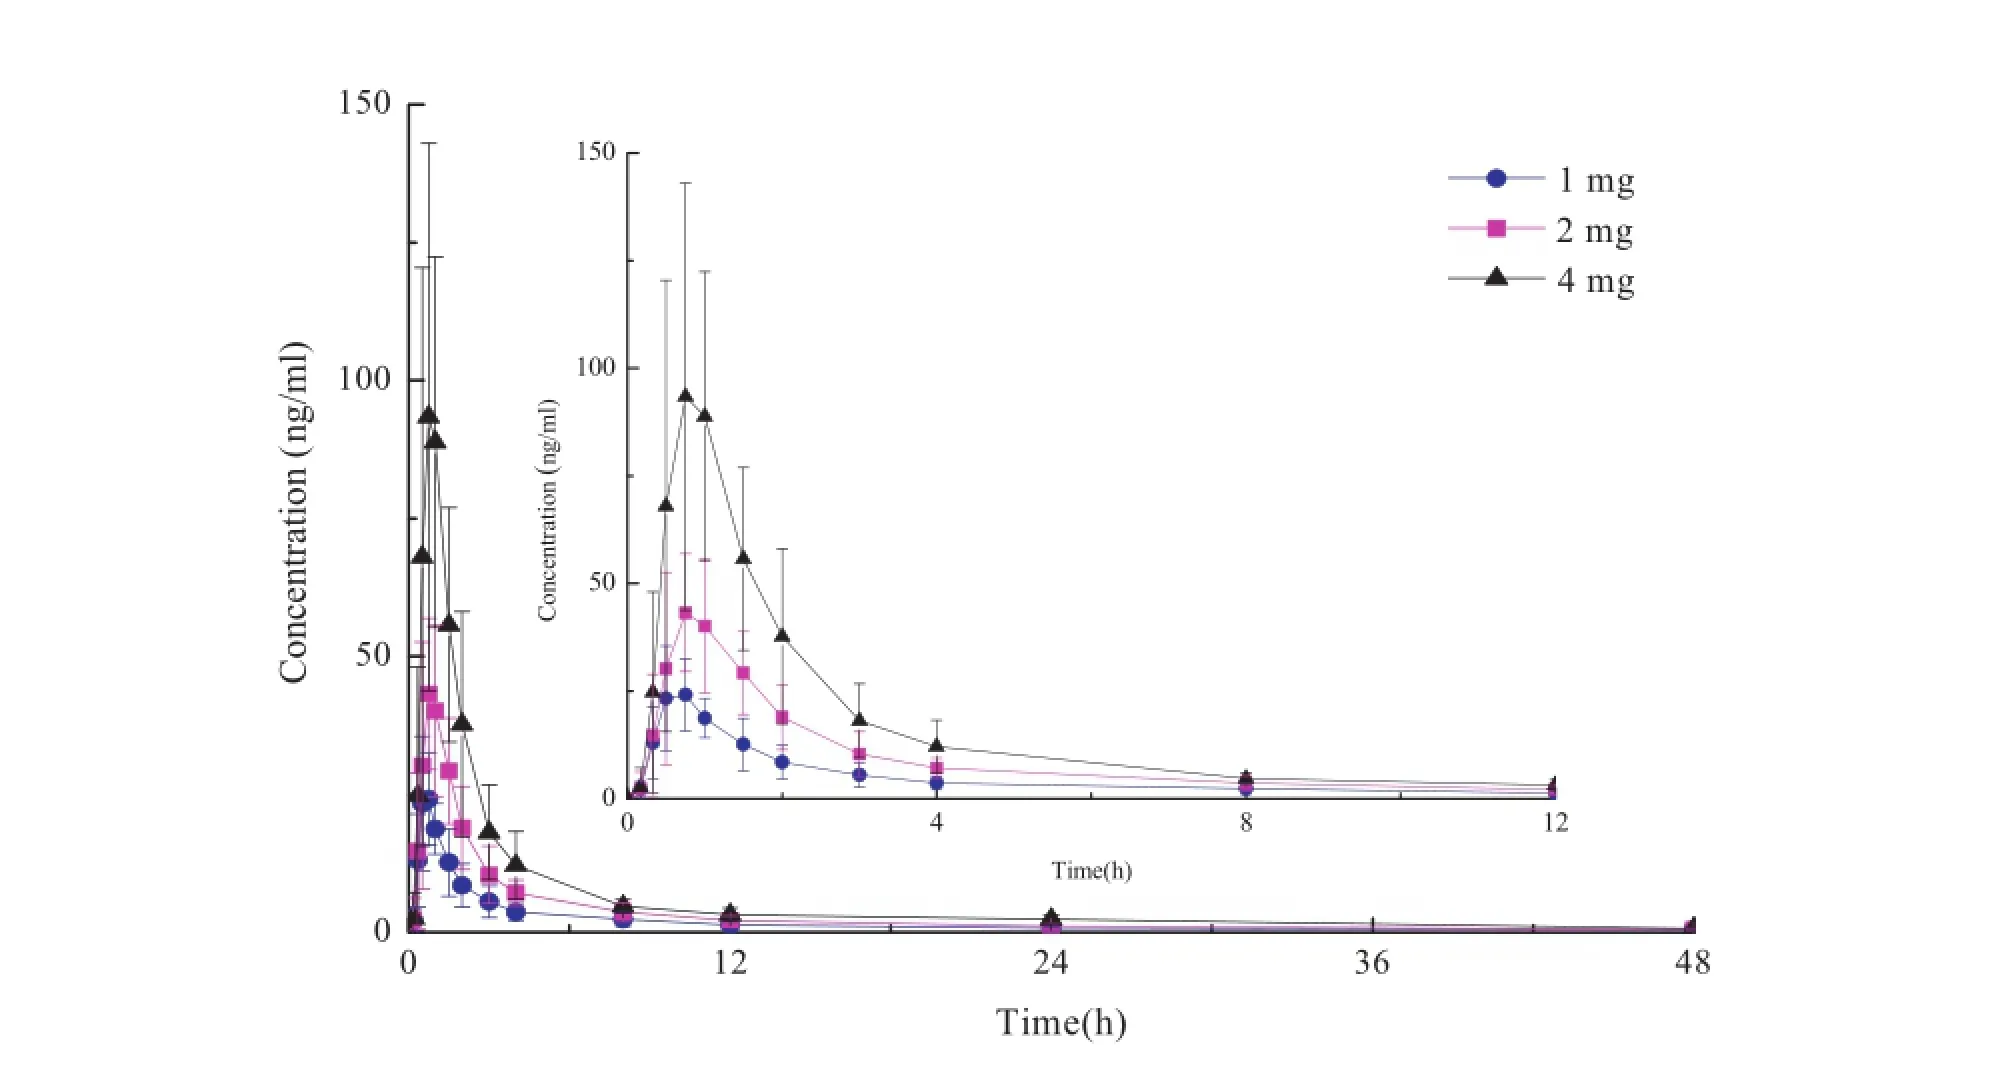
Fig.3-Mean plasma concentration-time curve of pitavastatin at different single dosage(1,2 and 4 mg)of administration (n=10).
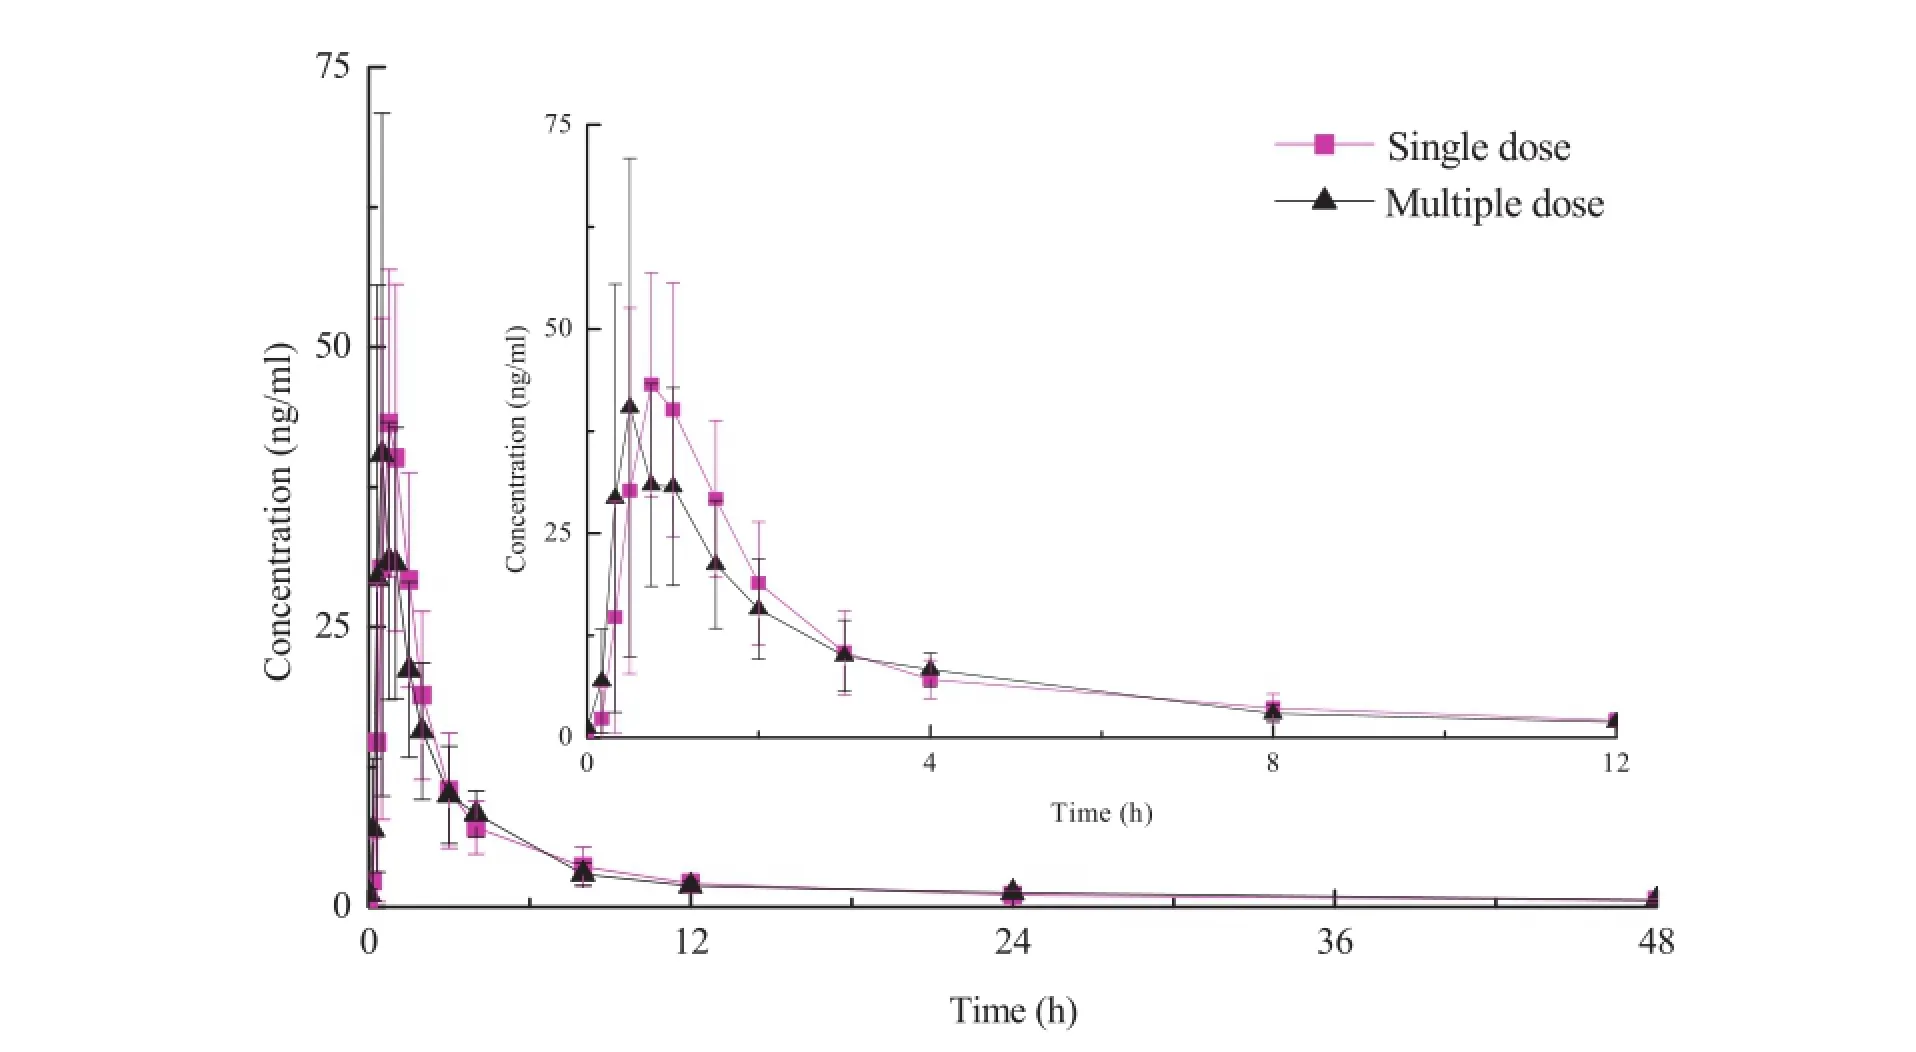
Fig.4-Mean plasma concentration-time curve of pitavastatin at single dose and multiple dose of 2 mg of administration (n=10).
The pharmacokinetics results of the 2 mg group which were administered a multiple dosage for seven d(Table 5) showed that the t1/2,AUC0-48h,AUC0-∞,Cmax,MRT0-48h, MRT0-∞,CL/F and Vd/F values of single dosage of 2 mg and multiple dosage of 2 mg have no difference(P > 0.05).The accumulation factor(Rac)of pitavastatin was 0.98 ± 0.30 showing that no drug accumulation was observed in the body.
4. Conclusion
A sensitive,specif i c,rapid and costless LC-MS/MS method for analysis of pitavastatin in human plasma has been developed and validated.Simple liquid-liquid extraction sample preparation procedure and chromatography analysis were used inthe method.The method has a lower limit of quantitation of 0.2 ng/ml and the chromatographic cycle time(2.1 min)is shorter than the reported method.Our method allowed highthroughput analysis with minimal matrix interference and has been shown to be successfully applied to phase I pharmacokinetic studies in healthy subjects.In this work we have studied the effect of multiple dosage(2 mg)of pitavastatin in human bodies which showed there was no signif i cant accumulation.The sensitive and specif i c method was suitable for analysis of the large batches of sample.

Table 4-Pharmacokinetic parameters of pitavastatin following single dose of 1,2 and 4 mg,respectively (Mean ± SD,n=10).
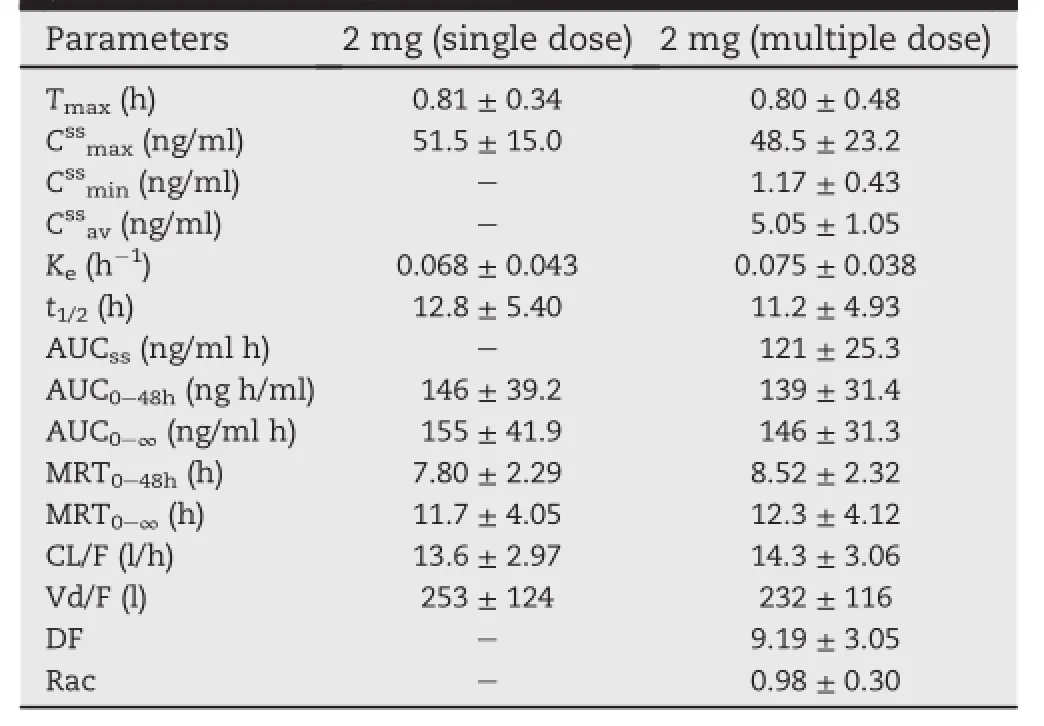
Table 5-Pharmacokinetic parameters of pitavastatin following single dose and multiple dose of 2 mg (Mean ± SD,n=10).
Acknowledgments
This work was supported by Qidu Pharmaceutical Co.,LTD (Zibo,China).
R E F E R E N C E S
[1]Maron DJ,Fazio S,Linton MF.Current perspectives on statins.Circulation 2000;101:207-213.
[2]Bertolini S,Bon GB,Campbell LM,et al.Eff i cacy and safety of atorvastatin compared to pravastatin in patients with hypercholesterolemia.Atherosclerosis 1997;130:191-197.
[3]Scandinavian Simvastatin Survival Study Group. Randomised trial of cholesterol lowering in 4444 patients with coronary heart disease:the Scandinavian Simvastatin Study(4S).Lancet 1994;344:1383.
[4]Sacks FM,Pfeffer MA,Moye LA,et al.The effect of pravastatin on coronary events after myocardial infarction in patients with average cholesterol levels.Cholesterol and Recurrent Events Trial Investigators.N Engl J Med 1996;335:1001-1009.
[5]Shepherd J,Cobbe SM,Ford I,et al.Prevention of coronary heart disease with pravastatin in men with hypercholesterolemia.West of Scotland Coronary Prevention Study Group.N Engl J Med 1995;333:1301-1307.
[6]Kajinami K,Takekoshi N,Saito Y.Pitavastatin:eff i cacy and safety prof i les of a novel synthetic HMG-CoA reductase inhibitor.Cardiovasc Drug Rev 2003;21:199-215.
[7]Suzuke M,Iwasaki H,Fujikawa Y,et al.Synthesis and biological evaluations of quinoline-based HMG-CoA reductase inhibitors.Bioorg Med Chem 2001;9:2727-2743.
[8]Saito Y,Yamada N,Teramoto T,et al.A randomized,doubleblind trial comparing the eff i cacy and safety of pitavastatin versus pravastatin in patients with primary hypercholesterolemia.Atherosclerosis 2002;162:373-379.
[9]Kojima J,Fujino H,Yosimura M,et al.Simultaneous determination of NK-104 and its lactone in biological samples by column-switching high-performance liquid chromatography with ultraviolet detection.J Chromatogr B Biomed Sci Appl 1999;724:173-180.
[10]Hui CK,Cheung BM,Lau GK.Pharmacokinetics of pitavastatin in subjects with Child-Pugh A and B cirrhosis.Br J Clin Pharmacol 2005;59:291-297.
[11]Lv H,Sun JG,Wang GJ,et al.Determination of pitavastatin in human plasma via HPLC-ESI-MS/MS and subsequent application to a clinical study in healthy Chinese volunteers. Clin Chim Acta 2007;386:25-30.
[12]Di B,Su MX,Yu F,et al.Solid-phase extraction and liquid chromatography/tandem mass spectrometry assay for the determination of pitavastatin in human plasma and urine for application to phase I clinical pharmacokinetic studies. J Chromatogr B Analyt Technol Biomed Life Sci 2008;868:95-101.
*Corresponding author.Shenyang Pharmaceutical University,No.103,Wenhua Road,Shenyang 110016,China.Tel.:+86 24 23986298, +86 13904000857;fax:+86 24 23986298.
E-mail addresses:lab429@126.com,liuqiandd2013@163.com(Q.Liu).
Peer review under responsibility of Shenyang Pharmaceutical University.
http://dx.doi.org/10.1016/j.ajps.2014.07.002
1818-0876/© 2014 Shenyang Pharmaceutical University.Production and hosting by Elsevier B.V.This is an open access article under the CC BY-NC-ND license(http://creativecommons.org/licenses/by-nc-nd/3.0/).
Pharmacokinetics
Liquid chromatography tandem mass spectrometry
杂志排行
Asian Journal of Pharmacentical Sciences的其它文章
- Pharmacokinetics of oxiracetam and its degraded substance(HOPAA)after oral and intravenous administration in rats
- Studies on the spray dried lactose as carrier for dry powder inhalation
- Pharmacokinetic performance of the nitrendipine intravenous submicron emulsion in rats
- Effect of the glyceryl monooleate-based lyotropic phases on skin permeation using in vitro diffusion and skin imaging
- Development of phosphonate-terminated magnetic mesoporous silica nanoparticles for pH-controlled release of doxorubicin and improved tumor accumulation
- Pharmaceutical particle technologies:An approach to improve drug solubility,dissolution and bioavailability