Optimization of Johnson-Cook Constitutive Model for Lead-free Solder Using Genetic Algorithm and Finite Element Simulations
2014-04-14LiuandHsu
D.S.Liu and C.L.Hsu
1 Introduction
As portable electronic products play an increasingly important role in daily life,their reliability when subjected to accidental drops/impacts is recognized as an important concern.Previous studies have shown that in the event of an accidental drop or impact,the solder joints in the board level packages[Tummala,Rymaszewski and Klopfenstein(1997)]of such products can experience strain rates as high as 102s−1[Yeh and Lai(2007)].Therefore,developing a thorough understanding of the mechanical behavior of lead-free solders at high strain rates is essential in ensuring the reliability of mobile electronic devices.
The mechanical response of lead and lead-free solders at low strain rates of 10−6∼10−1s−1have been extensively examined[Plumbridge and Gagg(2000);Kim,Huh and Suganuma(2002);Kanchanomai,Miyashita and Mutoh(2002);Amagai,Watanabe,Omiya,Kishimoto and Shibuya(2002);Pang and Xiong(2005)].Moreover,a small number of researchers have also investigated the dynamic properties of solder material at higher strain rates.For example,Lee and Dai(2001)and Wang and Yi(2002)investigated the dynamic behavior of 63Sn-37Pb solder using the split-Hopkinson pressure and torsion bar(SHPB and SHTB)system.Siviour,Walley,Proud and Field(2005)used a SHPB system to investigate the stress-strain behavior of lead and lead-free solders as a function of both the strain rate(102∼104s−1)and the deformation temperature.However,in all these studies,the solder specimens had the form of uniform cylinders,whereas in practical electronic applications,the electrical connections are generally realized using solder ball joints.Moreover,the specimens were not reflowed prior to the impact tests,and thus their microstructures were different from those of conventional reflowed solder joints.Finally,the finding of these studies that solder joints tend toward brittle failure at high strain rates was not verified by experimental observations.
Accordingly,in the present study,a micro-impact tester is used to obtain the forcetime curves of reflowed 96.5Sn-3Ag-0.5Cu solder ball joints in impact tests performed at speeds of 0.3∼1.0 m/s.A Finite Element(FE)model is constructed of a single solder ball joint mounted on a substrate.Numerical simulations are then performed to investigate the dynamic behavior of the ball joint under impact testing given the use of the Johnson-Cook(J-C)constitutive model.The optimal values of the constants in the J-C model are determined using a Genetic Algorithm based on the experimental results obtained from a shear loading test performed at an impact velocity of 0.5 m/s(see Fig.1).The validity of the proposed approach is demonstrated by comparing the simulation results for the load-time response of single solder ball joints at impact velocities of 0.3∼1.0 m/s with the equivalent experimental results.
2 Experimental Procedure
Figure 2 presents a photograph of the experimental setup.The test specimen comprised an array of 96.5Sn-3Ag-0.5Cu solder ball joints deposited on a bismaleimide triazine(BT)laminate substrate coated with a thin layer of electrolytic nickel/gold(Ni/Au).The solder joints were fabricated using a mask with a 380µm opening and were reflowed in accordance with the profile shown in Fig.3.The impact tests were performed using an Instron micro-impact system with impact speeds of 0.3,0.5,0.7 and 1.0 m/s,respectively.Prior to each test,a vision alignment system was used to check for a parallel alignment of the striking head with the specimen.In addition,a shear height of 50µm was obtained by carefully adjusting the position of the X-Y-Z stage supporting the specimen fixture in the vertical direction.The load applied to the solder joint in each test was sensed continuously over the course of the impact using a 45 N load cell with a linearity of 0.4%FS(Full Scale).The corresponding displacement of the solder jointwas measured using a linear variable differential transformer(LVDT)with a measurement resolution of 0.1µm.
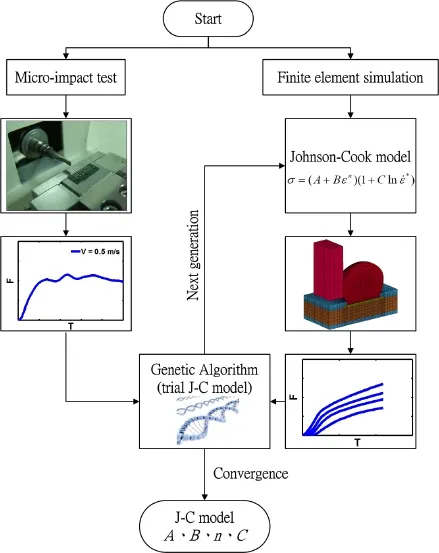
Figure 1:Flowchart showing hybrid experimental/numerical method used to obtain optimal constants of Johnson-Cook constitutive model for 96.5Sn-3Ag-0.5Cu solder alloy.
Time-series images of the fracture process were acquired using a commercial highspeed digital camera(Vision Research,Model Phantom V310)with a maximum frame rate capability of500,000 frames persecond(fps).To obtain high-magnification images of the specimen during the impact event,the camera was fitted with a combined QIOPTIC Optem Zoom 125C optical lens system.Moreover,the solder/substrate interface was illuminated by a remote super bright LED light source(U-Technology,Model UFLS-50-12W)coupled through a flexible light guide with an output diameter of 12 mm.Consecutive images of the impact event were acquired at a frame rate of 78,212 fps(equivalent to a 12-µs inter-image interval)and an image resolution of 256 x 128 pixels over a period of 0.2 msec.

Figure 2:Photograph showing high-speed camera system and micro-impact test setup.

Figure 3:Reflow profile applied in solder joint fabrication process.
3 Ball Shear Simulation Model
3.1Strain-Rate Dependent Elastic-Plastic Model
Previous studies have shown that lead-free solder alloy exhibits a strain-rate dependent response under impact loading[Pang,Xiong and Low(2004);Lall,Shantaram,Suhling and Locker(2012)].In the present study,the rate-dependent elasticplastic behavior of the 96.5Sn-3Ag-0.5Cu solder ball joints was described using the Johnson-Cook constitutive model,which has the form[Johnson and Cook(1983)]:

In addition,A,B,n,Candmare the constants of the empirical model.ConstantAis the yield stress(as determined from quasi-static compressive strain-stress data),whileBandnincorporate the effects of strain hardening.ConstantCis a multiplicative constant used to scale the instantaneous strain rate in accordance with the reference strain rate.Finally,mdescribes the effect of thermal softening.In the present study,the effects of the experimental temperature on the material properties of the 96.5Sn-3Ag-0.5Cu solder were assumed to be sufficiently small to be neglected.Thus,the final term in the constitutive relationship was simply ignored.
3.2Finite Element Model
In constructing the Finite Element(FE)model of the shear loading test,the size of the spherical solder ball was determined by means of experimental measurements.Specifically,the diameter of a solder ball in the periphery of the ball array was measured initially from above using an optical microscope and then from the side using the microscope attached to a Vickers micro-hardness testing machine.The diameter was found to be 463µm in both cases.For confirmation purposes,half of the solder ball was ground away and the diameter was measured once again in the central cross-section position using the optical microscope.The geometry information was then used to construct the ball joint/substrate model shown in Fig.4.

Figure 4:Configuration of test specimen.

Figure 5:(a)2-D ball shear model,and(b)3-D half-symmetry finite element model.
Figures 5(a)and 5(b)show the two-dimensional and three-dimensional models of the impact test configuration.The three-dimensional model comprised 52,563 linear hexahedral solid elements with a total of 171,489 degrees of freedom.(Note that the degrees of freedom of the nodes on the lower surface of the substrate were fixed.)A surface-to-surface contact mode was applied between the solder mask and the solder joint.Furthermore,the shear tool was assumed to have a perfectly rigid wall.The simulations were performed using the commercial LS-DYNA solver(v.971).In simulating the impact test,a displacement was exerted on the tool along the X-direction.Note that the time-varying displacement of the tool was controlled in accordance with the experimental LVDT displacement data.To ensure the stability of the numerical solutions,the time step should not exceed the critical time integration interval,which in general is proportional to the minimum element size in the FE model[Hallquist(2007)].Thus,in performing the present simulations,the time step was specified as 0.9.Finally,the elastic-plastic properties of the solder ball joint were modeled using the Johnson-Cook(J-C)constitutive equation.The remaining components in the model were assumed to be fabricated of simple linear elastic materials with the properties shown in Tab.1.(Note that in the table,Eis the Young’s modulus,ρis the mass density,andνis the Poisson’s ratio.)
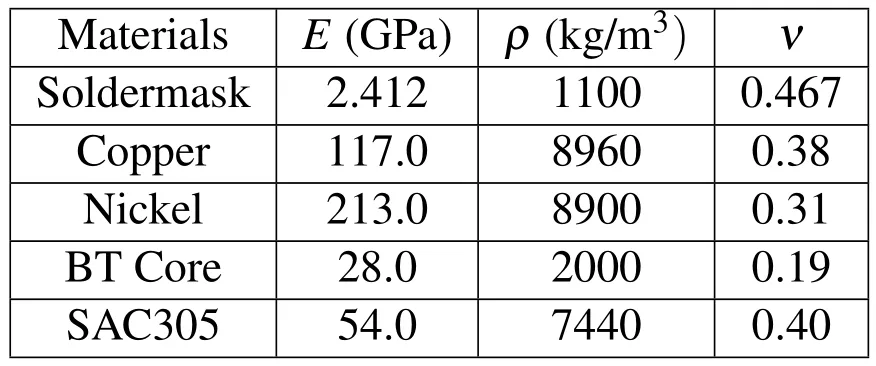
Table 1:Material properties of components in FE model
3.3Determination of constitutive parameters in J-C model
In the present study,the optimal values of the constants in the J-C constitutive model(i.e.,A,B,n,andC)were determined using a Genetic Algorithm(GA).In the iterative GA solution procedure,the fitness(i.e.,quality)of the solutions was determined by comparing the load-time curve produced by the FE solver given an impact speed of 0.5 m/s with the experimental load-time curve.Specifically,the objective function(OF)was defined as follows[Liu,Tsai and Lyu(2009)]:

whereiis the index of the discretized point,Nis the total number of discretized points,FTestis the force data obtained from the experimental micro-impact test,andFFEMis the force data obtained from the FE simulations.Note thatFTestandFFEMrepresent the reaction forces acting on the shear tool during the impact process and were obtained by discretizing the load-time curves obtained in the micro-impact test and FE simulations,respectively,using a uniform time interval.
The detailed steps in the GA optimization procedure can be summarized as follows:
Step 1.Create initial population comprising 20 candidate solutions for A,B,n and C with values randomly assigned in the ranges of 90–1539 MPa,177–1120 MPa,0.12–0.42 and 0.006–0.060,respectively.
Step 2.Encode the values assigned to each design parameter(i.e.,each constant)in the form of L-bit binary numbers in accordance with

whereDmaxandDminare the upper and lower bounds of the corresponding parameter range,respectively,andδis a coefficient used to increase the precision.Concatenate the four binary sequences relating to the J-C constants in order to create a single binary string(chromosome)for each of the 20 candidate solutions.
Step 3.For each chromosome,simulate the load-time curve over an interval of 0∼0.11 msec given an assumed impact speed of 0.5 m/s.
Step 4.Calculate the fitness of each candidate solution using Eq.(2).
Step 5.Select individual candidates randomly with a probability of 0.08 and perform two-point crossover(reproduction)with a probability of 0.80.
Step 6.Perform random mutation with a probability of 0.001[Chen and Chen(1997)].
Step 7.For the new population of candidate solutions,repeat Steps 1∼6 iteratively until the pre-assigned number of generations have been performed(i.e.,100 in the present study),or the optimal solution remains unchanged from one generation until the next.
Table 2 summarizes the schemes and parameter values used in the present GA.The optimal solution was found to converge after approximately 7 generations.Thus,for computational efficiency,the GA procedure was terminated after 10 generations(see Fig.6).
4 Results and Discussion
Table 3 compares the optimalvaluesofthe J-C parameters determined in the present study using the GA(upper row)with the experimentally-determined values presented in the literature.It is noted that the discrepancy between the present results and those presented in the literature is due mainly to differences in the solder microstructure in each case.
Figure 7 compares the simulation images of the impact event given an impact speed of 0.5 m/s with the experimental observations.It is seen that a good qualitative agreement exists between the two sets of results.Figure 8 compares the FE simulation results for the load-time response of the solder ball joint with the experimental results given an impact speed of 0.5 m/s.Again,a good agreement is observed between the two sets of results.Thus,the validity of the optimal parameter values obtained using the GA approach is confirmed.Figures 9∼11 compare the simulated load-time response of the solder ball with the experimental results given impacts speeds of 0.3 m/s,0.7 m/s and 1.0 m/s,respectively.In every case,a good agree-ment exists between the simulated and experimental load-time curves.Thus,the global optimality of the J-C constants(computed on the basis of a loading speed of 0.5 m/s)is confirmed.For comparison purposes,Figs.8∼11 also show the simulation results obtained using the FE model given the J-C parameters determined in[Qin,An and Chen(2010)]using an SHPB approach.A poor match is observed with the load-time curves obtained in the present study.

Table 2:Parameters and schemes used in GA optimization procedure

Figure 6:Convergence of solution fitness over iterative GA solution procedure.
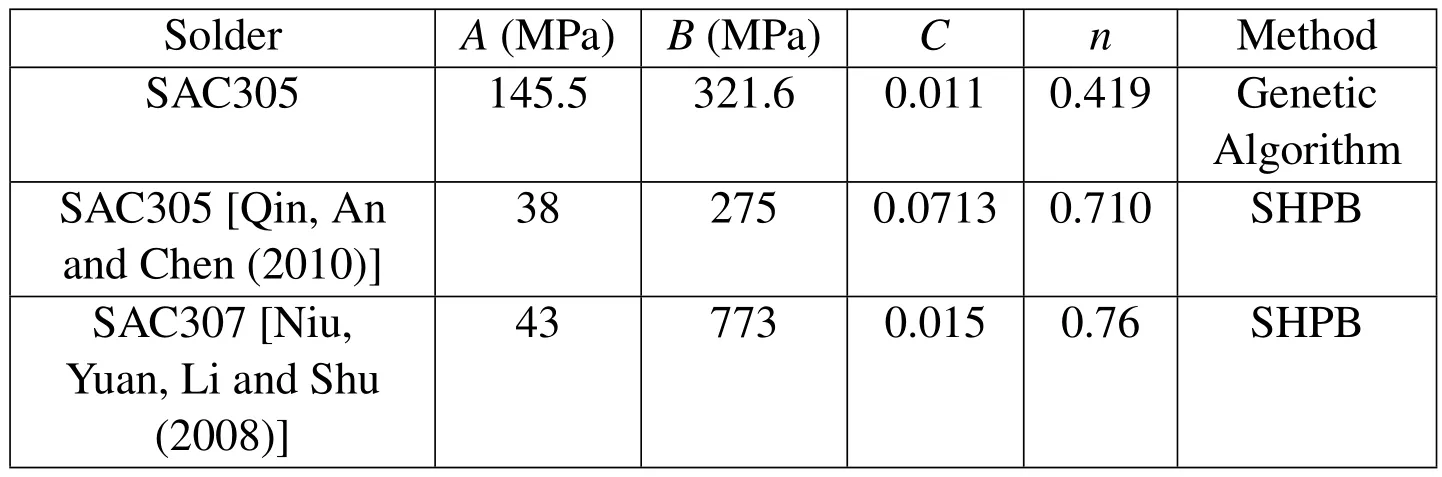
Table 3:Johnson-Cook model parameters for 96.5Sn-3Ag-0.5Cu solder alloy

Figure 7:Solder joint deformation and fracture process:(a)simulation results,and(b)experimental observations.

Figure 8:Comparison of experimental and simulation results for load-time response given impact speed of 0.5 m/s.

Figure 9:Comparison of experimental and simulation results for load-time response given impact speed of 0.3 m/s.

Figure 10:Comparison of experimental and simulation results for load-time response given impact speed of 0.7 m/s.
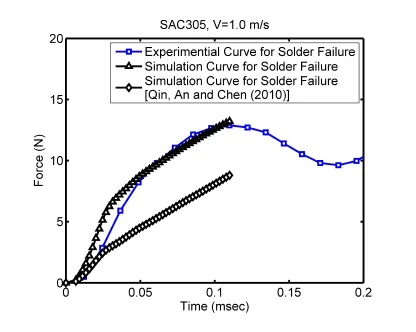
Figure 11:Comparison of experimental and simulation results for load-time response given impact speed of 1.0 m/s.
5 Conclusions
This study has proposed a hybrid experimental/numerical method for determining the optimal values of the Johnson-Cook constitutive model for lead-free 96.5Sn-3Ag-0.5Cu solder alloy.Specifically,the optimal parameter values have been determined using a Genetic Algorithm based on FEsimulations ofa shear-load impact test performed at a speed of 0.5 m/s and the experimental load-time curve obtained at the same speed.It has been shown that the simulated load-times curves obtained using the optimalJ-C parametersare in good agreementwith the experimentalloadtime curves not only at the considered impact speed of 0.5 m/s,but also at a lower speed of 0.3 m/s and higher speeds of 0.7 m/s and 1.0 m/s,respectively.Thus,the robustness of the proposed hybrid approach is confirmed.
Acknowledgement:The currentauthors gratefully acknowledge the financialsupportprovided to thisstudy by the NationalScience Council,Taiwan,R.O.C.,under Grant No.NSC 101-2221-E-194-014-MY3 and NSC 101-2923-E-194-002-MY3.
Amagai,M.;Watanabe,M.;Omiya,M.;Kishimoto,K.;Shibuya,T.(2002):Mechanical characterization of Sn–Ag-based lead-free solders.Microelectronics Reliability,vol.42,no.6,pp.951–966.
Chen,T.Y.;Chen,C.J.(1997):Improvements of simple genetic algorithm in structural design.International Journal for Numerical Methods in Engineering,Vol.40,pp.1323–1334.
Hallquist,J.O.(2007):LS-DYNA keyword user’s manual(version 971).Livermore Software Technology Corp,Livermore,USA.
Johnson,G.R.;Cook,W.H.(1983):A constitutive model and data for metals subjected to large strains,high strain rates and high temperatures.Proceedings of the 7th International Symposium on Ballistics,pp.541–547.
Kim,K.S.;Huh,S.H.;Suganuma,K.(2002):Effects of cooling speed on microstructure and tensile properties of Sn-Ag-Cu alloys.Materials Science&Engineering A,vol.333,pp.106–114.
Kanchanomai,C.;Miyashita Y.;Mutoh Y.(2002):Low-cycle fatigue behavior of Sn-Ag,Sn-Ag-Cu,and Sn-Ag-Cu-Bi lead-free solders.Journal of Electronic Materials,vol.31,no.5,pp.456–465.
Lee,S.W.R.;Dai,L.H.(2001):Characterization of strain rate-dependent behavior of 63Sn-37Pb solder using split hopkinson torsional bars(SHTB).Proceedings of the 13th Symposium on Mechanics of SMT&Photonic Structures,pp.1–6.
Lall,P.;Shantaram,S.;Suhling,J.;Locker,D.(2012):Effect of high strain-rate on mechanical properties of SAC105 and SAC305 leadfree alloys.Proceedings of the 62nd Electronic Components&Technology Conference,pp.1313–1326.
Liu,D.S.;Tsai,C.Y.;Lyu,S.R.(2009):Determination oftemperature-dependent elasto-plastic properties of thin-film by MD nanoindentation simulations and an inverse GA/FEM computational scheme.CMC:Computers Materials&Continua,vol.11,no.2,pp.147–164.
Niu,X.;Yuan,G.;Li,Z.;Shu,X.(2008):Study on dynamic failure model of lead-free solders using SHPB techniques.International Journal of Modern Physics B,vol.22,no.9-11,pp.1117–1122.
Plumbridge,W.J.;Gagg,C.R.(2000):The mechanical properties of leadcontaining and lead-free solders–meeting the environmental challenge.Proceedings of the Institution of Mechanical Engineers,Part L:Journal of Materials Design and Applications,vol.214,pp.153–161.
Pang,J.H.L.;Xiong,B.S.;Low,T.H.(2004):Comprehensive Mechanics Characterization of Lead-free 95.5Sn-3.8Ag-0.7Cu Solder.Micromaterials and Nanomaterials,vol.3,pp.86–93.
Pang,J.H.L.;Xiong,B.S.(2005):Mechanical properties for 95.5Sn-3.8Ag-0.7Cu lead-free solder alloy.IEEE Transactions on Components and Packaging Technologies,vol.28,no.4,pp.830–840.
Qin,F.;An,T.;Chen,N.(2010):Strain rate effects and rate-dependent constitutive models of lead-based and lead-free solders.Journal of Applied Mechanics,vol.77,pp.011008–1–11.
Siviour,C.R.;Walley,S.M.;Proud,W.G.;Field,J.E.(2005):Mechanical properties of SnPb and lead-free solders at high rates of strain.Journal of Physics D:Applied Physics,vol.38,no.22,pp.4131–4139.
Tummala,R.R.;Rymaszewski,E.J.;Klopfenstein,A.G.(1997):Microelectronics Packaging Handbook.Chapman&Hall.
Wang,B.;Yi,S.(2002):Dynamic plastic behavior of 63 wt%Sn 37 wt%Pb eutectic solder under high strain rates.Journal of Materials Science Letters,vol.21,no.9,pp.697–698.
Yeh,C.L.;Lai,Y.S.(2007):Insights into correlation between board-level drop reliability and package-level ball impact test characteristics.IEEE Transactions on Electronics Packaging Manufacturing,vol.30,no.1,pp.84–91.
杂志排行

Computers Materials&Continua的其它文章
- Effect of Gravitational Field and Temperature Dependent Properties on Two-Temperature Thermoelastic Medium with Voids under G-N Theory
- Numerical Study on Mechanical Properties of Steel Fiber Reinforced Concrete by Statistical Second-order Two-scale Method
- Anti-plane Circular Nano-inclusion Problem with Electric Field Gradient and Strain Gradient Effects