Climatic response of Pinus sylvestris var. mongolica tree-ring width and precipitation reconstruction for the northern Greater Higgnan Mountains, China, since 1720
2014-03-31TongWenZhangYuJiangYuanWenShouWeiRuiBoZhangShuLongYuFengChenHuaMingShangLiQinZiAngFan
TongWen Zhang, YuJiang Yuan*, WenShou Wei, RuiBo Zhang, ShuLong Yu, Feng Chen, HuaMing Shang, Li Qin, ZiAng Fan
1. Institute of Desert Meteorology, China Meteorological Administration, Urumqi, Xinjiang 830002, China
2. Key Laboratory of Tree-ring Physical and Chemical Research of China Meteorological Administration, Urumqi, Xinjiang 830002, China
3. Key Laboratory of Tree-ring Ecology of Uighur Autonomous Region, Urumqi, Xinjiang 830002, China
Climatic response of Pinus sylvestris var. mongolica tree-ring width and precipitation reconstruction for the northern Greater Higgnan Mountains, China, since 1720
TongWen Zhang1,2,3, YuJiang Yuan1,2,3*, WenShou Wei1,2,3, RuiBo Zhang1,2,3, ShuLong Yu1,2,3, Feng Chen1,2,3, HuaMing Shang1,2,3, Li Qin1,2,3, ZiAng Fan1,2,3
1. Institute of Desert Meteorology, China Meteorological Administration, Urumqi, Xinjiang 830002, China
2. Key Laboratory of Tree-ring Physical and Chemical Research of China Meteorological Administration, Urumqi, Xinjiang 830002, China
3. Key Laboratory of Tree-ring Ecology of Uighur Autonomous Region, Urumqi, Xinjiang 830002, China
August-June precipitation has been reconstructed back to AD 1720 for the northern Greater Higgnan Mountains, China, by use ofPinus sylvestrisvar.mongolicatree-ring width. The reconstruction explains the variance of 39% in observed precipitation from 1973 to 2008. Some extremely dry/wet signals in historical documents and other precipitation reconstructions in previous studies are precisely captured in our reconstruction. Wet periods occurred during the periods of 1730 to 1746, 1789 to 1812, 1844 to 1903, 1920 to 1930, 1942 to 1961, and 1985 to 1998; while periods of 1747 to 1788, 1813 to 1843, 1904 to 1919, 1931 to 1941, and 1962 to 1984 were relatively dry. Power spectral and wavelet analyses demonstrated the existence of significant 24-year, 12-year, and 2-year cycles of variability.
Greater Higgnan Mountains;Pinus sylvestrisvar.mongolica; tree-ring width; precipitation reconstruction
1 Introduction
Grain is the main commodity in Northeast China, and it plays an important role in development of the Chinese economy (Cheng and Zhang, 2005a). Grain production in this area is directly affected by disastrous weather, such as drought, floods, frost, hail and strong winds (Cheng and Zhang, 2005b). Therefore, to better understand the climatic regimes of Northeast China, it is important to obtain a record of past climatic variations in this region. Most of the weather stations in this region were installed in the late 1950s and limited historical documents do not adequately examine past climatic changes. Fortunately, widespread coniferous forests in the Greater Higgnan Mountains, located in Northeast China, provide an excellent opportunity for dendroclimatological studies.
Tree-ring data provide one of the best sources of proxy information that extend our knowledge of the hydroclimatic variability on annual timescales because of their precise dating, annual resolution, and comparability with recorded meteorological data (Chenet al., 2003; Zhanget al., 2003; Shaoet al., 2005; Lianget al., 2009; Gouet al., 2010; Liuet al., 2010; Wanget al., 2010). In recent years, some dendroclimatogical studies have been carried out in the northern GreaterHiggnan Mts.. Wanget al.(2005) demonstrated that tree-ring maximum and latewood density of Dahurian Larch (Lariχ gmelinii) and Mongolian scotch pine (Pinus sylvestrisvar.mongolica) in the northern Greater Higgnan Mts. is highly responsive to temperature in the late growing season. Similarly, Sunet al.(2010) suggested that ring-width chronology of larch trees from the Mohe region had significantly positive correlations (p<0.05) with temperature in August, while radial growth of the same kind of trees in the Kuduer region was significantly negatively correlated (p<0.01) with temperature in May and July (Zhanget al., 2010). Liuet al.(2009) contributed a 139-year annual precipitation reconstruction from Hailar pine ring-width data for the Hailar region, Inner Mongolia. Sunet al.(2012) reconstructed May-August mean maximum temperature series for the northern Greater Higgnan Mts. based on Dahurian Larch maximum latewood density data from two sampling sites. Furthermore, two tree-ring width data based temperature reconstructions were also represented for the Hulunbuir region (Baoet al., 2012; Zhanget al., 2013a).
The objectives of this study are: (1) to construct ring-width chronologies from pine trees in the northern Greater Higgnan Mts., (2) to analyze tree growth-climate responses, (3) to reconstruct climatic elements beyond the period covered by meteorological records, (4) and to determine climatic variability.
2 Materials and methods
2.1 Study area and sample collection
This study targets the northern Greater Higgnan Mts. (Figure 1) where has a temperate continental monsoon climate (Wuet al., 2004). The climate is cold in winter, windy and dry in spring, warm and wet in summer, and cool and frosty in autumn. Average annual temperature is −4.3 °C, and annual precipitation varies from 280 mm to 630 mm. Zonal vegetation of the study area is cold-temperate coniferous forest. Tree-ring samples used in our study were taken from Mongolian scotch pine, which is widely distributed in the Greater Higgnan Mts.. The soil at the sample site is of luvisol (FAOet al., 2012). Information on the sampling sites is listed in table 1. To minimize non-climatic effects on tree growth, only healthy trees with little evidence of fire or human disturbance were selected for sampling. To collect tree-core samples that contained consistent climate signals, the altitude difference between the highest and the lowest sample site was less than 30 m. For most of the sampled trees, two cores (using 5.15 mm diameter increment borers) were extracted in different directions for cross-dating. A total of 69 cores from 46 trees were collected at breast height from two sites (Beiku forest farm, BKZ; and Gelin forest farm, GLZ) in September, 2008.

Figure 1 Location of tree-ring sampling sites and meteorological stations in the northern Greater Higgnan Mts.
2.2 Tree-ring width measurement and chronology development
All the tree-ring cores were naturally dried, mounted, surfaced, and cross-dated following standard dendrochronological procedures (Speer, 2010). Because of similar natural surroundings and the short distance between the two sampling sites (about 20 km apart), cores from BKZ and GLZ can be regarded as samples from a comp-site (GBZ). Each ring-width was subsequently measured by the Velmex Measuring System with a resolution of 0.001 mm. Quality control of the cross-dating was carried out using the COFECHA program (Holmes, 1983). Because of some ambiguities of cross-dating and low correlations with the master dating series, four cores were excluded from further analysis. In the end, 65 tree cores were used for further analyses. The rate of absent rings in the cores was 0.14%. The ARSTAN program (Cook and Krusic, 2005) was used for detrending and developing of tree-ring chronologies. The age- and size-related variation of the tree-ring widths was removed by a single detrending process applied on each tree-ring measurement: a 60-year cubic smoothing spline functionwith 67% frequency-response cut-off (Cook and Peters, 1981). The detrended data from individual tree cores were combined into the site chronology using a bi-weight robust mean to minimize the influence of outliers, extreme values, or biases (e.g., from spurious trends) in the tree-ring indices (Cook and Kairiukstis, 1990). Following these procedures, three types of chronologies were obtained from three sample sites: standard (STD), residual (RES), and Arstan (ARS). We used the RES chronology of the GBZ sampling site, which better contains high-frequency variations between the individual tree core series (Cook, 1985), presumably in response to climate, for further analysis. Chronology reliability is evaluated by the mean series inter-correlation (RBAR) and the Expressed Population Signal (EPS) (Wigleyet al., 1984). RBAR is the average of all pairwise correlations for detrended tree-ring series within a chronology while EPS is used to assess the adequacy of replication in the early years of the chronology. Both RBAR and EPS were calculated for 20-year intervals with an overlap of 10-year along the chronology. To ensure the length of reliable chronology, we restricted our analyses to periods with an EPS of at least 0.80 (Esperet al., 2003).
2.3 Meteorological data
Data of monthly mean temperature and total precipitation were selected for the regional growth-climate response analysis. Tahe (358.9 m a.s.l., 124°43′E, 52°19′N, the period of 1972-2008) and Xinlin (496.1 m a.s.l., 124°20′E, 51°42′N, the period of 1972-2008) meteorological stations were selected near the sampling sites. Instrumental records were provided by the China Monthly Surface Climatological Database (NMIC, 2008) using the China Meteorological Data Sharing Service System maintained by the National Meteorological Information Center (http://cdc.cma.gov.cn/). As presented in figure 2, summer (June-August) is the high-temperature period in this area, with the highest mean temperature occurring in July. Rainfall from June to August comprises a major proportion of the annual precipitation (63% for Tahe and 67% for Xinlin) and peaks in July. The correlations between Tahe and Xinlin instrumental stations for annual precipitation and annual mean temperature are 0.61 (p<0.001,n= 37) and 0.92 (p< 0.001,n= 37), while the correlations between these two stations for total precipitation and mean temperature from previous August to current June are 0.75 (p<0.001,n= 36) and 0.93 (p<0.001,n= 36). Because of the approximately simultaneous change (Figure 2) and the high correlation coefficients between the climatic data from two meteorological stations, we used the averaged climatic data from two stations for further analyses.
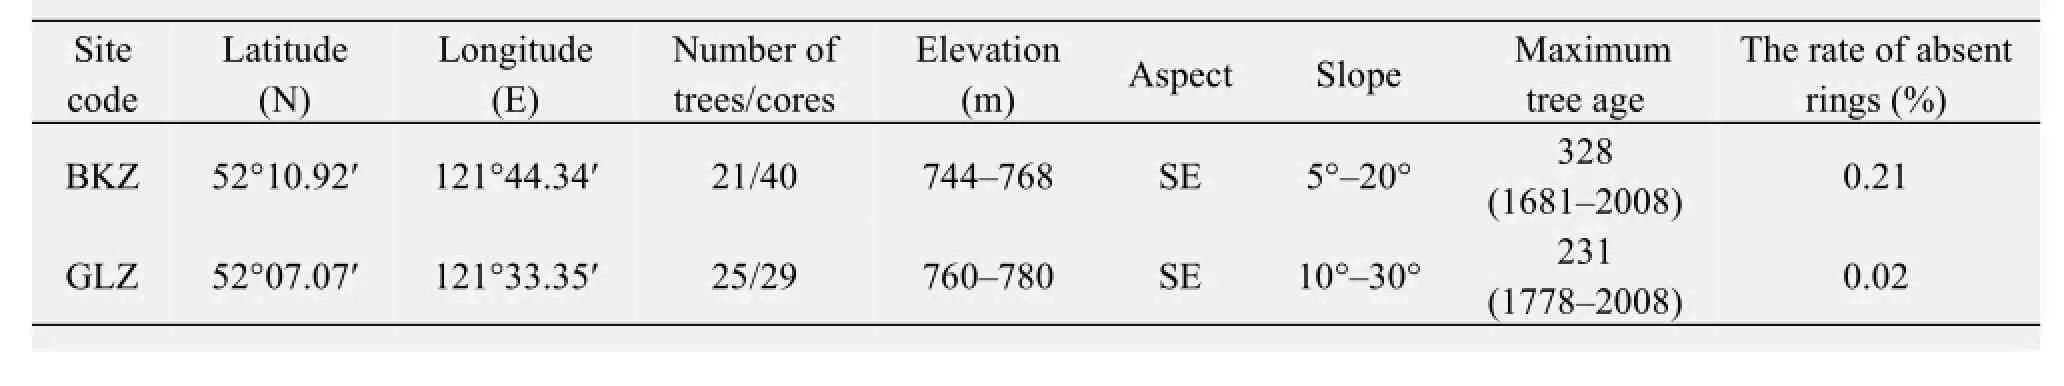
Table 1 Sampling site information

Figure 2 Climatic diagram for Tahe (a) and Xinlin (b) meteorological stations in the northern Greater Higgnan Mts. (the period of 1972-2008). The bars indicate monthly precipitation and the curves represent monthly mean temperature
2.4 Statistical analysis
Pearson correlation coefficients were considered to quantify the strength of climate signals inherent to the radial growth of trees. A linear regression equation between tree-ring chronology and meteorological data was computed for the calibration period. We used split-sample calibration-verification tests (Michaelsen, 1987; Meko and Graybill, 1995; Gouet al., 2007) to evaluate the statistical reliability of our reconstruction model. Meteorological data (36-year total) are split into two parts for calibration (20-year data) and verification (16-year data). Several statistics, including the sign test, product mean (Fritts, 1976), reduction of error, and coefficient of efficiency (Cooket al., 1999) are calculated to evaluate observed and estimated data. We applied power spectrum analysis to examine the reasonable periodicities in our reconstruction. This analysis is performed over the full range of the reconstruction. Wavelet analysis was used with a Morlet wavelet to investigate the periodicity of the reconstructed series and how the periodicity changes through time (Torrence and Compo, 1998; http://ion.researchsystems.com).
3 Results
3.1 Statistical characteristics of the ring-width chronology
The newly developed tree-ring width chronology (GBZ) with its sample depths is presented in figure 3 and its general descriptive statistics are listed in table 2. The high values of mean sensitivity (MS) and standard deviation (SD) indicate a strong climatic signal in the GBZ chronology. The reliable GBZ chronology spans 289 years (the period of 1720-2008) due to the period corresponding to the EPS value above 0.80 (5 cores/3 trees). As presented in table 2, the high values of the mean correlation between all the series and between the trees of the GBZ chronology indicate a strong common signal among the index series. In general, the high signal-to-noise ratio (SNR) and expressed population signal (EPS) are believed to have a great climatic influence on tree growth (Cook and Kairiukstis, 1990).
3.2 Tree growth / climate analysis
The July-October monthly mean temperature and precipitation from the averaged climatic data for the study area during the calibrated period of 1972-2008 were used to assess how the climatic elements influence the radial growth of pine trees. Results indicate that there is no significant correlation between monthly mean temperature and the GBZ chronology at the 95% confidence level (Figure 4a). As presented in figure 4b, positive correlations with monthly precipitation were found in September of the previous year (r= 0.34), December of the previous year (r= 0.36), May of the current year (r= 0.37), and June of the current year (r= 0.38) for the GBZ chronology based on the 95% confidence level. After testing different combinations of months, we found that ring-width indices and total precipitation from previous August to current June showed the best relationship (r= 0.62,p<0.0001,n= 36). Meanwhile, higher correlation coefficient between the tree-ring chronology and August-September mean temperature is only 0.40 (p<0.05,n= 37).

Figure 3 (a) The GBZ chronology (thin solid line) and its sample depth (short dashed line); (b) EPS (thin line) and RBAR (thick line)

Table 2 Statistical characteristics of the GBZ chronology over a common period of 1880-2005

Figure 4 Pearson correlations (bars) between GBZ chronology and meteorological data for the northern Greater Higgnan Mts. (the period of 1972-2008). Lowercase letters represent months of the previous year; uppercase letters are months of the current year. The dotted lines indicate 0.05 significance level
3.3 Precipitation reconstruction
The radial growth of pine trees in the GBZ site shows a strong correlation with precipitation. Therefore, we reconstructed the precipitation from previous August to current June using the GBZ chronology. A linear regression model was used to describe the relationship between tree-ring chronology and precipitation. The model was designed as follows:
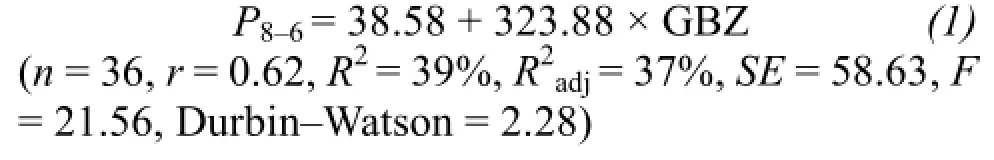
whereP8-6is total precipitation from previous August to current June for the northern Greater Higgnan Mts. and GBZ is the ring-width index of the GBZ chronology. For the calibrated period of 1973-2008, the explained variance of the reconstruction is 37% (adjusted for loss of degrees of freedom). During the calibrated period, the reconstructed August-June precipitation precisely tracks the observation (Figure 5).
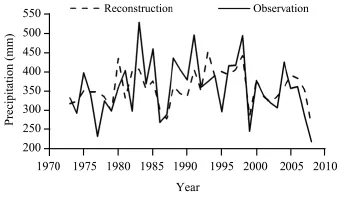
Figure 5 Comparison between the recorded (solid line) and reconstructed (dash line) August-June precipitation for their common period of 1973-2008
The resulting characteristics of the split-samplecalibration-verification tests are presented in table 3. The values of the product mean test (t) are positive, which indicates significant skill in the tree ring estimates. Results of the sign test (S), which describes how well the predicted value tracks the direction of the actual data, exceed the 99% and 90% confidence levels in the periods of 1993-2008 and 1973-1988, respectively. The positive values of the reduction of error (RE) and coefficient of efficiency (CE) also demonstrate that Model(1)is stable and reliable, and can be used for precipitation reconstruction. Consequently, total precipitation from previous August to current June during the period of 1720-2008 for the northern Greater Higgnan Mts. were reconstructed based on Model(1)(Figure 6), with a mean of 360.0 mm and a standard deviation ofσ= 48.1 mm.

Table 3 Statistics of split-sample calibration-verification tests (the period of 1973-2008) for the reconstructed precipitation

Figure 6 August-June precipitation reconstruction for the northern Greater Higgnan Mts. since 1720 (thin line). The thick line shows the smoothed data with a 21-year low-pass filter to emphasize long-term fluctuations. The solid horizontal line represents long-term mean for the period of 1720-2008; the dashed horizontal lines represent the mean value ± 1σ
3.4 Characteristics of the reconstructed precipitation series
We define a wet year as > mean +1σ(408.1 mm), and a dry year as < mean -1σ(311.8 mm). The reconstructed precipitation series shows that 46 years are categorized as "wet years" (accounting for 15.9% of the total), and 46 years are categorized as "dry years" (accounting for 15.9% of the total), while the remaining 197 years are categorized as "normal years" (accounting for 68.2% of the total). The extreme years and decades of our reconstruction are listed in table 4. The difference between the wettest year (1952) and the driest year (1967) is 338.4 mm, and the difference between the wettest 1990s and the driest 1770s is 51.3 mm.
The decadal variability was highlighted by applying a 21-year moving average to the reconstruction (Figure 6). Six wet periods and five dry periods can be distinguished. Wet periods (above the mean value of the reconstruction) were found for 1730-1746 (average value is 365.5 mm), 1789-1812 (369.6 mm), 1844-1903 (362.2 mm), 1920-1930 (363.1 mm), 1942-1961 (365.1 mm), and 1985-1998 (367.1 mm). Dry periods (below the mean) were found for 1747-1788 (353.5 mm), 1813-1843 (354.9 mm), 1904-1919 (354.6 mm), 1931-1941 (354.1 mm), and 1962-1984 (351.4 mm).
Results of the power spectral analysis show spectral peaks for 24.0-year (95% confidence level), 11.3-year (95%), 3.3-year (90%) and 2.8-year (90%) in the past 289 years (Figure 7a). The temporal characteristic of the different cycles was also evaluated using wavelet analysis, illustrated in figure 7b. The wavelet analysis indicates a robust 12-year cycle from 1780s to 1810s, 1850s to 1880s, and 1970s to 2000s. In contrast, the significant (though less robust) power at 24-year cycle is detected from 1730s to 1780s, and 1900s to 1950s. These findings are also confirmed by the results of the power spectrum analysis.

Table 4 Summary characteristics of the reconstructed precipitation

Figure 7 (a) Power spectrum of the reconstructed precipitation for the northern Greater Higgnan Mts.. Blue lines are the 90% confidence level; red lines are the 95% confidence level. (b) Wavelet power spectrum of the reconstructed precipitation. The power has been scaled by the global wavelet spectrum. Black contour is the 10% significance level, using a white-noise background spectrum. (c) The global wavelet power spectrum (black line). The dashed line denotes significance, assuming the same significance level and background spectrum as indicated above
4 Discussion
Studies on tree-ring widths and their relation to climate for conifers in arid and semi-arid sites frequently demonstrate that ring-width growth is not only influenced by the climate during the growing season, but is also affected by climatic conditions in autumn, winter, and spring prior to the growing season (Fritts, 1976). Therefore, the results of our correlation analysis, which suggest that the precipitation during August-June is a consistently dominant climatic factor accounting for the interannual variation of tree-ring width in the study area, are physiologically meaningful. The period from previous August to current June, which spans the period from the late growth season in the previous year to the middle growth season in the current year, can be divided into three parts. The first part (the period from August to September in the previous year) is the late growth season of Mongolian scotch pine, which is a hardwood coniferous species (Wanget al., 2005). The photosynthetic optimum temperature for evergreen conifer is from 10 °C to 25 °C. The photosynthesis of these conifer trees may stop below temperatures from −3 °C to−5 °C (Wang, 2000). The average temperature of this period is around 12 °C (Figure 2), and the photosynthesis of pine trees does not stop. More precipitation in this period may improve photosynthesis and lead to more nutriment accumulation of pine trees, which would benefit the tree-growth in the next year (Liuet al., 2011). The second part (the period from October in the previous year to April in the current year) belongs to the non-growth season of pine trees in the study area. Snowfall comprises a major proportion of the total precipitation during this period. More snowfall in the non-growth season means that trees may absorb more moisture in the early growth season (D'Arrigo and Jacoby, 1991; Díazet al., 2002). The third part (the period from May to July in the current year) is therefore the growth season of the sampled trees. During this period, the pine trees begin to grow and more rainfall results in high soil moisture, which may reduce water stress and benefit cambial cell division in the fast growing season (Liuet al., 2004). Similar response to annual precipitation is reported repeatedly for the Hailar region (Liuet al., 2009) and other arid and semi-arid sites in northern China (Shaoet al., 2005; Liuet al., 2006, 2010, 2011; Lianget al., 2009; Zhanget al., 2013b).
Unlike the detailed historical documents in South China, the records about meteorological disasters are minimal in this study area due to historically little human activity. The limited historical documents cannot examine past climatic changes adequately, but they can verify the reliability of our reconstruction. The 10 wettest and 10 driest years of our reconstruction listed in table 4 were compared with historical documents (Wen and Sun, 2007; Wen and Shen, 2008) and reconstructed precipitation series for the Hailar region (Liuet al., 2009) and northeastern Mongolia (Pedersonet al., 2001) near our study area (Table 5). Except for 1736, 1862, 1911, and 1968 (no records), there is good agreement with other years and records in the historical documents and precipitation reconstructions (eight wettest and eight driest years in the reconstruction correspond well with wet and dry events). The above results indicated that our reconstruction can precisely capture extremely dry/wet signals.

Table 5 Extreme years of reconstructed precipitation for the northern Greater Higgnan Mts. in comparison with historical documents and other precipitation reconstructions
The 24-year and 11.3-year cycles in our reconstructed precipitation series suggest a possible important connection of the 22-year Hale and 11-year Schwabe cycle of solar activity (Nagovitsyn, 1997). The 22-year and 11-year cycles were also found in the summer precipitation (meteorological data) for Northeast China (Sunet al., 2000; Gonget al., 2006). The 2-year cycle of our reconstruction may be associated with the Quasi-Biennial Oscillation (QBO) (Baldwinet al., 2001). The 2-year oscillation is also consistent with the periodicity of climatic variance in northeastern China over the past 100 years (Sunet al., 2006). In addition, these cycles are frequently found in other dendroclimatogical studies of northeastern China (Liuet al., 2003, 2004, 2011; Lianget al., 2009; Wanget al., 2010; Baoet al., 2012) and northeastern Mongolia (Pedersonet al., 2001).
5 Conclusions
We developed a tree ring-width chronology from pine trees sampled at two sites in the northern Greater Higgnan Mts.. The results of the response of tree growth to climate show that the chronology contains an annual precipitation signal. Hence, August-June precipitation for the study area since 1720 was reconstructed based on the chronology. Coherence among the extreme years of the newly reconstructed precipitation series, historical documents, and other precipitation reconstructions in previous studies indicates that our reconstruction precisely captures the extremely dry/wet signals. Furthermore, precipitation increase for northeastern China since the 1980s is also captured by our reconstruction. The existence of 24-year, 12-year, and 2-year cycles in our reconstruction coincides with the oscillation cycles of solar activity and the Quasi-Biennial Oscillation.
Acknowledgments:
We thank Prof. Lily Wang for her great help in the process of collecting samples. Particular thanks are extended to the anonymous reviewers and editors whose comments and suggestion greatly benefited this manuscript. This research was supported by the Climate Change Special Project of China Meteorological Administration (CCSF201438), the Meteorology Public Welfare Industry Research Special Project (GYHY201106013-3 and GYHY200806011) and the Basic Research Operating Expenses of the Central-level Public Welfare Research Institutes (IDM201204).
Baldwin MP, Gray LJ, Dunkerton TJ,et al., 2001. The quasi-biennial oscillation. Reviews of Geophysics, 39: 179−229.
Bao G, Liu Y, Linderholm HW, 2012. April-September mean maximum temperature inferred from Hailar pine (Pinus sylvestris var.mongolica) tree rings in the Hulunbuir region, Inner Mongolia, back to 1868 AD. Palaeogeography, Palaeoclimatology, Palaeoecology, 313−314: 162−172.
Chen T, Qin DH, Liu XH,et al., 2003. Dynamics of atmospheric δ13C in the past 440 years in Aleitai, Xinjiang. Chinese Journal of Applied Ecology, 14(9): 1469−1472.
Cheng YQ, Zhang PY, 2005a. Regional differentiation of grain production of commodity grain bases in the Northeast China. Journal of Natural Resources, 20(6): 925−931.
Cheng YQ, Zhang PY, 2005b. Regional patterns changes of Chinese grain production and response of commodity grain base in Northeast China. Scientia Geographica Sinica, 25(5): 513−520.
Cook ER, 1985. A time-series analysis approach to tree-ring standardization. Ph.D. dissertation, The University of Arizona, Tucson.
Cook ER, Kairiukstis LA, 1990. Methods of Dendrochronology. Kluwer Academic Publishers, Dordrecht, Netherland.
Cook ER, Krusic PJ, 2005. Program ARSTAN: A Tree-Ring Standardization Program Based on Detrending and Autoregressive Time Series Modeling, with Interactive Graphics. Lamont-Doherty Earth Observatory, Columbia University, Palisades, New York, America.
Cook ER, Meko DM, Stahle DW,et al., 1999. Drought reconstructions for the continental United States. Journal of Climate, 12: 1145−1162.
Cook ER, Peters K, 1981. The smoothing spline: a new approach to standardizing forest interior tree-ring width series for dendroclimatic studies. Tree-ring Bull, 41: 45−53.
D'Arrigo RD, Jacoby GC, 1991. A 1000-year record of winter precipitation from northwestern New Mexico, USA: a reconstruction from tree-rings and its relation to El Niño and the Southern Oscillation. The Holocene, 1: 95-101.
Díaz SC, Therrell MD, Stahle DW,et al., 2002. Chihuahua (Mexico) winter-spring precipitation reconstructed from tree-rings, 1647-1992. Climate Research, 22: 237-244.
Esper J, Shiyatov SG, Mazepa VS,et al., 2003. Temperature-sensitive Tien Shan tree ring chronologies show multi-centennial growth trends. Climate Dynamics, 21: 699−706.
FAO, IIASA, ISRIC,et al., 2012. Harmonized World Soil Database (version 1.2). FAO, Rome, Italy and IIASA, Laxenburg, Austria.
Fritts HC, 1976. Tree Rings and Climate. Academic Press, London, Britain.
Gong Q, Wang HY, Wang PX, 2006. Analysis of climate and anomaly features of summer precipitation in Northeast China. Meteorological Science and Technology, 34(4): 387−393.
Gou XH, Chen FH, Cook ER,et al., 2007. Streamflow variations of the Yellow River over the past 593 years in western China reconstructed from tree rings. Water Resources Research, 43: W06434. DOI: 10.1029/2006WR005705.
Gou XH, Deng Y, Chen FH,et al., 2010. Tree ring based stream flow reconstruction for the upper Yellow River over the past 1234 years. Chinese Science Bulletin, 55(36): 4179−4186.
Holmes RL, 1983. Computer-assisted quality control in tree-ring data and measurement. Tree-ring Bulletin, 43: 69−78.
Liang EY, Shao XM, Liu XH, 2009. Annual precipitation variation inferred from tree rings since A.D. 1770 for the western Qilian Mts., Northern Tibetan Plateau. Tree-Ring Research, 65: 95−103.
Liu Y, An ZS, Ma HZ,et al., 2006. Precipitation variation in the northeastern Tibetan Plateau recorded by the tree rings since 850 AD and its relevance to the Northern Hemisphere temperature. Science in China (Series D: Earth Sciences), 49(4): 408−420.
Liu Y, Bao G, Song HM,et al., 2009. Precipitation reconstruction from Hailar pine (Pinus sylvestris var.mongolica) tree rings in the Hailar region, Inner Mongolia, China back to 1865 AD. Palaeogeography, Palaeoclimatology, Palaeoecology, 282: 81−87.
Liu Y, Cai QF, Park WK,et al., 2003. Tree-ring precipitation records from Baiyinaobao, Inner Mongolia since A.D. 1838. Chinese Science Bulletin, 48(11): 1140−1145.
Liu Y, Shi JF, Shishov VV,et al., 2004. Reconstruction of May-July precipitation in the north Helan Mountain, Inner Mongolia since A.D. 1726 from tree-ring late-wood widths. Chinese Science Bulletin, 49(4): 405−409.
Liu Y, Sun JY, Song HM,et al., 2010. Tree-ring hydrologic reconstructions for the Heihe River watershed, western China since AD 1430. Water Research, 44: 2781−2792.
Liu Y, Wang CY, Hao WJ,et al., 2011. Tree-ring-based annual precipitation reconstruction in Kalaqin, Inner Mongolia for the last 238 years. Chinese Science Bulletin, 56(28−29): 2995−3002.
Meko DM, Graybill DA, 1995. Tree-ring reconstruction of upper Gila River discharge. Water Resource Bull, 31: 605−616.
Michaelsen J, 1987. Cross-validation in statistical climate forecast models. Journal of Climate and Applied Meteorology, 26: 1589-1600.
Nagovitsyn YA, 1997. A nonlinear mathematical model for the solar cyclicity and prospects for reconstructing the solar activity in the past. Astronomy Letters, 23: 742−748.
NMIC, 2008. China Monthly Surface Climatological Database. NMIC, Beijing, China.
Pederson N, Jacoby GC, D'arrigo RD,et al., 2001. Hydrometeorological reconstructions for northeastern Mongolia derived from tree rings: 1651−1995. Journal of Climate, 14: 872−881.
Shao XM, Huang L, Liu HB,et al., 2005. Reconstruction of precipitation variation from tree rings in recent 1000 years in Delingha, Qinghai. Science in China (Series D: Earth Sciences), 48(7): 939−949.
Speer JH, 2010. Fundamentals of Tree-ring Research. The University of Arizona Press, Tucson, America.
Sun FH, Yuan J, Lu S, 2006. The change and test of climate in northeast China over the last 100 years. Climatic and Environmental Research, 11(1): 101−108.
Sun L, An G, Ding L,et al., 2000. A climatic analysis of summer precipitation features and anomaly in Northeast China. Acta Meteorologica Sinica, 58(1): 70−82.
Sun Y, Wang LL, Chen J,et al., 2010. Growth characteristics and response to climate change ofLariχ Millertree-ring in China. Science in China (Series D: Earth Sciences), 53(6): 871−879.
Sun Y, Wang LL, Chen J,et al., 2012. Reconstructing mean maximum temperatures of May-August from tree-ring maximum density in North Da Hinggan Mountains, China. Chinese Science Bulletin, 57(16): 2007-2014.
Torrence C, Compo GP, 1998. A practical guide to wavelet analysis. Bulletin of the American Meteorological Society, 79: 61−78.
Wang LL, Shao XM, Huang L,et al., 2005. Tree-ring characteristics ofLariχ gmeliniiandPinus sylvestris var.mongolica and their response to climate in Mohe, China. Acta Phytoecologica Sinica, 29(3): 380−385.
Wang L, Duan JP, Chen J,et al., 2010. Temperature reconstruction from tree-ring maximum density ofBalfour sprucein eastern Tibet, China. International Journal of Climatology, 30: 972−979.
Wang Z, 2000. Phytophysiology. China Agriculture Press, Beijing, China.
Wen KG, Shen JG, 2008. The Documents of Chinese Meteorological Disaster: Volume of Inner Mongolia Province. Meteorological Publishers, Beijing, China.
Wen KG, Sun YG, 2007. The Documents of Chinese Meteorological Disaster: Volume of Heilongjiang Province. Meteorological Publishers, Beijing, China.
Wigley TML, Briffa KR, Jones PD, 1984. On the average value of correlated time series, with applications in dendroclimatology and hydrometeorology. Journal of Climate and Applied Meteorology, 23: 201−203.
Wu XP, Zhu B, Zhao SQ,et al., 2004. Comparison of community structure and species diversity of mixed forests of deciduous broad-leaved tree and Korean pine in Northeast China. Biodiversity Science, 12(1): 174-181.
Zhang QB, Cheng GD, Yao TD,et al., 2003. A 2,326-year tree-ring record of climate variability on the northeastern Qinghai-Tibetan Plateau. Geophysical Research Letters, 30(14): 1739. DOI: 10.1029/2003GL017425.
Zhang TW, Yuan YJ, Wei WS,et al., 2013a. Tree ring based temperature reconstruction for the northern Greater Higgnan Mountains, China, since A.D. 1717. International Journal of Climatology, 33: 422−429.
Zhang TW, Yuan YJ, Liu Y,et al., 2013b. A tree ring based precipitation reconstruction for the Baluntai region on the southern slope of the central Tien Shan Mountains, China, since A.D. 1464. Quaternary International, 283: 55−62.
Zhang XL, Cui MX, Ma YJ,et al., 2010.Lariχ gmeliniitree-ring width chronology and its responses to climate change in Kuduer, Great Xing’an Mountains. Chinese Journal of Applied Ecology, 21(10): 2501−2507.
: Zhang TW, Yuan YJ, Wei WS,et al., 2014. Climatic response ofPinus sylvestrisvar.mongolicatree-ring width and precipitation reconstruction for the northern Greater Higgnan Mountains, China, since 1720. Sciences in Cold and Arid Regions, 6(6): 0546-0555.
10.3724/SP.J.1226.2014.00546.
Received: May 17, 2014 Accepted: August 18, 2014
*Correspondence to: YuJiang Yuan, Professor of Institute of Desert Meteorology, China Meteorological Administration. No. 46, Jianguo Road, Urumqi, Xinjiang 830002, China. Tel: +86-991-2642265; E-mail: yuanyuj5502@sina.com
杂志排行

Sciences in Cold and Arid Regions的其它文章
- Modeled response of talik development under thermokarst lakes to permafrost thickness on the Qinghai-Tibet Plateau
- Variations of the temperature and solar activity in China
- Study on the extremely cold winter of 1670 over the middle and lower reaches of the Yangtze River
- Impacts of reduced wind speed on physiology and ecosystem carbon flux of a semi-arid steppe ecosystem
- Study on dynamic changes of land desertification in the circum-lake zone of the Qinghai Lake in the past 30 years supported by Remote Sensing and Geographical Information System
- An estimation of groundwater storage variations from GRACE gravity satellites in the Heihe River Basin, northwestern China