Impacts of reduced wind speed on physiology and ecosystem carbon flux of a semi-arid steppe ecosystem
2014-03-31DongYanJinQiongGaoYaLinWangLiXu
DongYan Jin, Qiong Gao, YaLin Wang, Li Xu
1. Academy of Disaster Reduction and Emergency Management, Ministry of Civil Affairs & Ministry of Education, Beijing Normal University, Beijing 100875, China
2. College of Natural Sciences, Beijing Normal University, Beijing 100875, China
Impacts of reduced wind speed on physiology and ecosystem carbon flux of a semi-arid steppe ecosystem
DongYan Jin1, Qiong Gao2*, YaLin Wang1, Li Xu1
1. Academy of Disaster Reduction and Emergency Management, Ministry of Civil Affairs & Ministry of Education, Beijing Normal University, Beijing 100875, China
2. College of Natural Sciences, Beijing Normal University, Beijing 100875, China
Decreasing wind speed is one aspect of global climate change as well as global warming, and has become a new research orientation in recent decades. The decrease is especially evident in places with frequent perennially high wind speeds. We simulated decreased wind speed by using a steel-sheet wind shield in a temperate grassland in Inner Mongolia to examine the changes in physical environmental variables, as well as their impacts on the photosynthesis of grass leaves and net ecosystem exchange (NEE). We then used models to calculate the variation of boundary layer conductance (BLC) and its impact on leaf photosynthesis, and this allowed us to separate the direct effects of wind speed reduction on leaf photosynthesis (BLC) from the indirect ones (via soil moisture balance). The results showed that reduced wind speed primarily resulted in higher moisture and temperature in soil, and indirectly affected net assimilation and water use efficiency of the prevalent bunch grassStipa krylovii. Moreover, the wind-sheltered plant community had a stronger ability to sequester carbon than did the wind-exposed community during the growing season.
wind speed; reduction; boundary layer conductance; photosynthesis; net ecosystem exchange; semi-arid steppe
1 Introduction
Wind plays an important part in the resource dynamics of semi-arid grasslands (Sterk, 2003; Munsonet al., 2011; Raviet al., 2011; Mooreet al., 2013). Much research has shown that the trend of wind speed is decreasing worldwide, and evidences have been reported from the United States (Pryoret al., 2009; Pryor and Ledolter, 2010), Canada (Tuller, 2004), Australia (McVicaret al., 2008), Italy (Pirazzoli, 2003), and Czechoslovakia (Brazdilet al., 2009). The same trend was also found in China, where annual, spring, and summer mean wind speeds have declined by 0.018, 0.021, and 0.015 m/(s·a), respectively. More wind speed reduction was found in the north, the Tibetan Plateau, and in coastal areas in the east and southeast parts of China (Guoet al., 2011).
Several causes have been suggested to explain the wind speed reduction. The major hypotheses are changed patterns of atmospheric circulation at high altitudes caused by climate change, increased surface roughness caused by thriving vegetation, and increased urban density and numbers of tall buildings (Iacono, 2009; Joseph, 2010). Overgrown former agricultural land, afforestation, and the change of landscape management practices could account for 25%−60% of the observed stilling in wind speed. Reduced wind speed definitely impacts ecosystem processes, functions, andstructures, especially in cold or arid areas with excessive evapotranspiration induced by extreme wind speed. Reduced wind speed increases the boundary layer thickness of the Earth’s surface and slows down the exchange of energy and water between the atmosphere and biosphere (McVicaret al., 2012). Decreased evapotranspiration and heat exchange rate are conducive to maintaining surface soil moisture and increasing the canopy temperature (Cleugh, 1998, 2002).
Previous studies on the effects of reduced wind speed were mostly focused on agriculture (Cleugh, 1998; BrandIeet al., 2004) and desert systems (Banget al., 2010). Much less is known about the impacts of reduced wind speed on environments, plant photosynthesis, and carbon sequestration of temperate grasslands. Typical steppe, a particular type of temperate grassland, is widely distributed in the eastern Eurasian steppe zone, and occupies a total area of 4.1×10⁷ha, more than half of which located in China (Haoet al., 2008). Wind-induced excessive surface evapotranspiration intensifies water stress on the physiology and growth of plants, and extreme wind speed also causes soil erosion and land degradation (Raviet al., 2011). Thus, decreasing wind speed is considered to favor ecosystem production and resources/land conservation.
In this paper, we describe a wind shield experiment conducted in a temperate grassland in Inner Mongolia. Wind speed, soil temperature and moisture, plant photosynthesis, and net ecosystem exchanges were measured on both sides of the windbreak to test the hypothesis that reducing wind speed favors grass physiology and community carbon sequestration, and to explore the mechanisms of the direct and indirect impacts of wind speed reduction on ecosystem processes.
2 Materials and methods
2.1 Experiment design
The study was conducted in Taips Banner (114°51′E −115°49′E, 41°35′N −42°10′N), an administrative division occupying most of southern half of the Xilingol League of Inner Mongolia. The site is administered by Beijing Normal University. Due to the control of Mongolian high atmospheric pressure, the predominant wind blows from the northwest at an annual average speed of 3.41 m/s. The highest wind speeds occur in April, reaching 10 m/s and above. According to the latest 35 years of meteorological data, the annual, July, and January mean temperatures are 2.1, 34, and −18 °C, respectively. The length of the frost-free season is about 100 days. The annual mean precipitation is 387 mm, with about 64.6% occurring from June to August. The soils are classified as chestnut soil, with low soil organic material content. The temperate grassland is dominated byStipa krylovii Roshev(Zhuet al., 2007).
In the summer of 2010, the Beijing Normal University landscape simulation and analysis laboratory established an experimental plot for wind field manipulation. The plot is 160 m long and 50 m wide, with the width aligned to the northwest, the prevailing wind direction. To reduce the wind speed, a 150-m-long and 3-m-high steel-sheet wind shield was erected in the middle of the plot, with its normal pointing to the prevailing wind direction of 290°49′41.2′ (north equal to 0 or 360 deg, clockwise positive). The wind shield divided that plot into two identical parts, each of which was 150m×25m. The northwest side of the wind shield was exposed to the prevailing wind and was used as the control (EX); the other side was used as the sheltered treatment (SH). Areas within 5 m of the wind shield were left as buffer zones on both sides, and the rest of the 20m×150m at each side of the wind shield was divided into 2 rows and 15 columns, thus forming 30 subplots 10m×10m on each side. One row of subplots facing the major wind on either side was used for clipping defoliation treatments, but those are not described in this paper. This paper addresses only the unclipped rows, leaving the foliage clipping experiment for later analysis.
2.2 Experimental measurements
Soil water contents and temperature of 20 randomly selected subplots were sampled every 30 min at a depth of 10 cm with EM50 devices (ECH2O EC-TM, Decagon Devices, Inc., Pullman, WA), so that each treatment had 10 replicates. We measured the leaf photosynthesis rate of the dominant speciesStipa krylovii, a perennial bunch grass, on June 30, July 23, August 31, and September 23, which spanned the whole growth season of 2012. For each of the four months, diurnal stomatal conductance, leaf transpiration, and net assimilation rates, as well as microclimate variables (e.g., leaf temperature, incident photon flux density, and vapor pressure), were measured with six replicates on both sides of wind shield at every 2 h from 08:00 to 18:00, with a portable photosynthesis system (model LI-6400, Li-Cor, Inc., Lincoln, NE).
The diurnal dynamics of the net ecosystem exchange (NEE) were also measured continuously for 24 hours in the same plots of the leaf photosynthesis measurement from May to September, at half-hour intervals by a fully automatic closed dynamic chamber (CDC) system (model LI-8150, Li-Cor, Inc.).
2.3 Model descriptions
The stomatal conductance model we used was a simplified version by Gaoet al.(2005), which calcu-lates stomatal conductance as a function of light intensity, soil water potential, and normalized vapor deficit in air. The leaf photosynthesis models for C3 plants were formulated by Thornley and Johnson (1990) (see Appendix A), which describe a process of carboxylase activated by light, then reacting with carbon dioxide to produce carbohydrates (carboxylation), or reacting with oxygen to produce carbon dioxide (photorespiration) (Gaoet al., 2004). To evaluate the impact of wind speed reduction on grass leaf physiology, we coupled a wind-speed-governed boundary layer conductance model with the stomatal conductance model. This enabled us to translate the effects of wind speed reduction into a calculation of photosynthesis. The details of the model descriptions are given in Appendix B. Model parameters were evaluated from the observed data by means of the nonlinear least-square technique (Table 1).

Table 1 List of model parameter values evaluated by the nonlinear least-square technique
3 Results
3.1 Effects of wind shield on wind velocity
Wind speed behind the wind shield was reduced significantly, and the closer to the wind shield the greater wind speed reduction (Figure 1). In particular, at 5 m away from the middle of the wind shield, the wind speed of the sheltered side was decreased on average by 58%, 29%, and 48% for April, August, and the entire growth season, respectively. The corresponding average wind speed reductions at 15 m away from the middle of the windbreak were 40%, 2%, and 30%, respectively. These differences were statistically significant except the ones in August, when wind directions diverted most from the prevailing direction.
3.2 Soil moisture and temperature
The amount of total precipitation in the growing season (from May to September) was 344 mm. During this period, the maximum and minimum monthly precipitation rates were 172 mm and 16 mm in July and August, respectively (Figure 1). The monthly variation of topsoil moisture was closely related to the amount of precipitation (Table 2).
Soil moisture in the shelter area was significantly greater than that on the windward side throughout the whole growing season (P<0.001) (Table 2). The mean value on the leeward side, from June to September, was 0.127±0.037 cm3/cm3, 14.4% greater than that on the windward side. Moreover, the maximum difference of soil moisture between sheltered and exposed, 18.6%, occurred in August, and the minimum of 8.8% occurred in September. Mean sheltered and exposed soil temperatures during the growing season of 2012 were 20.33±5.70 °C and 19.31±4.99 °C, respectively, so that the sheltered side was about 1 °C warmer than the exposed side (P<0.001). The higher soil moisture and temperature in the sheltered side implied decreased surface evaporation and sensible heat loss because of the reduced wind speed.

Figure 1 Wind speed and precipitation on both sides of the windbreak. Averaged daily wind speed measured along the middle of the windbreak; four days were measured in each month

Table 2 Topsoil temperature and moisture (0-20 cm deep) on both sides of the wind shield
3.3 Observed leaf photosynthesis
Figure 2 plots the averages of the observed diurnal net assimilation rate (AN), stomatal conductance (GS), transpiration rate (Tr), and water use efficiency (WUE) ofStipa kryloviiunder the sheltered and exposed treatments from June to September of 2012, respectively. The results show that shelteredANwas 45% greater than exposed, because of warmer and wetter soil. The mean values of sheltered and exposedANwere 7.76±4.18 and 5.35±3.96 μmol/(m2·s), respectively.
The differences ofGSbetween the leeward and windward were insignificant, except those at 08:00, 14:00, and 18:00. The exposedGSwas about 14% and 20% higher than sheltered in the morning and nightfall, respectively, but was 13% lower at 14:00. The diurnal profiles of the leaf transpiration on both sides of the shield were similar, but the overall average of transpiration in the sheltered side was 3% lower that of the exposed side.

Figure 2 Observed diurnal dynamics of photosynthesis, stomatal conductance, transpiration, and water use efficiency ofStipa kryloviion both leeward and windward sides
We calculated intrinsicWUEleafin the form ofANdivided byGS(Waterhouseet al., 2004), which presents substantial intra- and interspecific variation and obtains a better description of plant characteristics than the conventionalWUE. TheWUEleafat the leeward side was obviously greater than that of the windward side during the entire growing season, mostly due to the difference inAN. The average dailyWUEleafin the leeward was 34.5±17.6 μmolCO2/molH2O, 40% higher than that of the windward.
3.4 Effects of wind speed on leaf boundary layer conductance and gas exchanges
Predicted leaf boundary layer conductance (BLCleaf) was calculated for the control, as well as at 5 m and 15 m away from the wind shield (leeward) based on observed climate data. For an average surface roughness of 3.7×10⁻³m (Huet al., 2006), we calculated theBLCleafwith 0.1 m as the characteristic length, using the wind speed on both sides of the shield. The details of the model descriptions are given in Appendix C.
The calculated meanBLCleafat the sheltered side decreased by 25% and 17% at 5 m and 15 m away from the windbreak, for a given wind speed reduction of 48% and 30%, respectively (Figure 3a). Moreover, the total conductance (Gt), such asGSin series withBLCleaf, varied with wind speed and, more evidently, with moisture conditions in air (vapor pressure deficit,VPD) and soil (soil water potential,Si).
TheGtis primarily sensitive to wind speed when the latter is smaller than a particular value. In other words,Gtasymptotically approaches a constant value when the wind speed is beyond this range. The range decreases quickly with moisture in soil and air. When the soil water potential varied from −0.033 (the field capacity) to −1 MPa, and the vapor pressure deficit increased from 0.5 to 2 kPa, the asymptoticGtdecreased from 1.24 to 0.12 molH2O/(m2·s) at 4 m/s wind speed. However, when wind speed gradually decreased,Gtunder all of the water conditions dropped quickly or slowly. For instance,Gtunder 0.2 kPa vapor pressure deficit and −0.033 MPa soil water potential decreased when wind speed reduced from 4 m/s to 1 m/s, and sharply deceased when the speed was less than 1 m/s. However,Gtremained constant under 0.5 kPa vapor pressure deficit and −0.5 MPa soil water potential when the wind speed declined from 4 to 1 m/s, and then decreased quickly when the wind speed was less than 1 m/s. The behavior ofGtwas thus primarily controlled by the stomatal conductance, and the boundary layer conductance came into play when the wind speed was small; the drier the water condition, the smaller the value of wind speed at whichGtsharply decreased.
We also calculatedANas a function of wind speed, and found that the direct effect of wind speed reduction onAN(i.e., the boundary layer change) was negligible for wind speed greater than 0.5 m/s.

Figure 3 Calculated sheltered and exposedBLCleafbased on observed wind speed from June to September (a), and the variation ofGtwith wind speed under different vapor pressure deficits (VPD) and soil water potentials (Si) (b). Leaf temperature, incident photon flux density, and pressure were fixed to 20 °C, 1,000 μmol/(m2·s), and 101 kPa, respectively, in theBLCleafcalculation
3.5 Net ecosystem exchange
Because of the reduced transpiration and increased carbon assimilation, theNEE(negative for downward flux, or carbon input to the ecosystem) at the leeward side was −1.05±0.59, −0.35±2.26, −1.87±3.57,−0.53±1.03, and −0.92±3.28 μmol/(m2·s) lower than the windward side for May, June, July, August, and September, respectively. We summarized the negative (carbon input or sequestration) and positive (carbonloss from ecosystem) values ofNEEseparately for the five months and then converted their units into gC/(m2·d) (Figure 4). Paired-t tests (two-tailed) were used to test the mean difference between sheltered and exposedNEE. The results showed that carbon emission of the sheltered side was 0.35±0.40 gC/(m2·d), or 24%, less than the exposed, but the carbon sequestration of the sheltered side was 0.64±0.37 gC/(m2·d), or 39%, greater than the exposed from May to September (Figure 5). The maximum and minimum values of carbon emission were 3.08 and 0.21 gC/(m2·d) in the exposed, and 2.04 and 0.18 gC/(m2·d) with sheltered treatments, respectively, which implied the rates of heterotrophic and autotrophic respiration of the ecosystem in the growth season. Moreover, the maximum and minimum values of carbon sequestration were 1.66 and 0.18 gC/(m2·d) (exposed) and 2.32, 0.48 gC/(m2·d) (sheltered) in August, respectively. On average, the shelteredNEEsequestered 0.98 gC/(m2·d) more than the exposedNEEfrom May to September in 2012.
It is important to note that the measurements ofNEE, as well as leaf photosynthesis, on both sides of windbreak were conducted in the chamber with the same air velocity, and the different performances of plants between sheltered and exposed were mainly due to the variation of ambient conditions such as soil moisture and temperature. Therefore, we consider the differences inANandNEEbetween the two sides of the windbreak to mainly result from the indirect effects of reduced wind speed on the ecosystem.
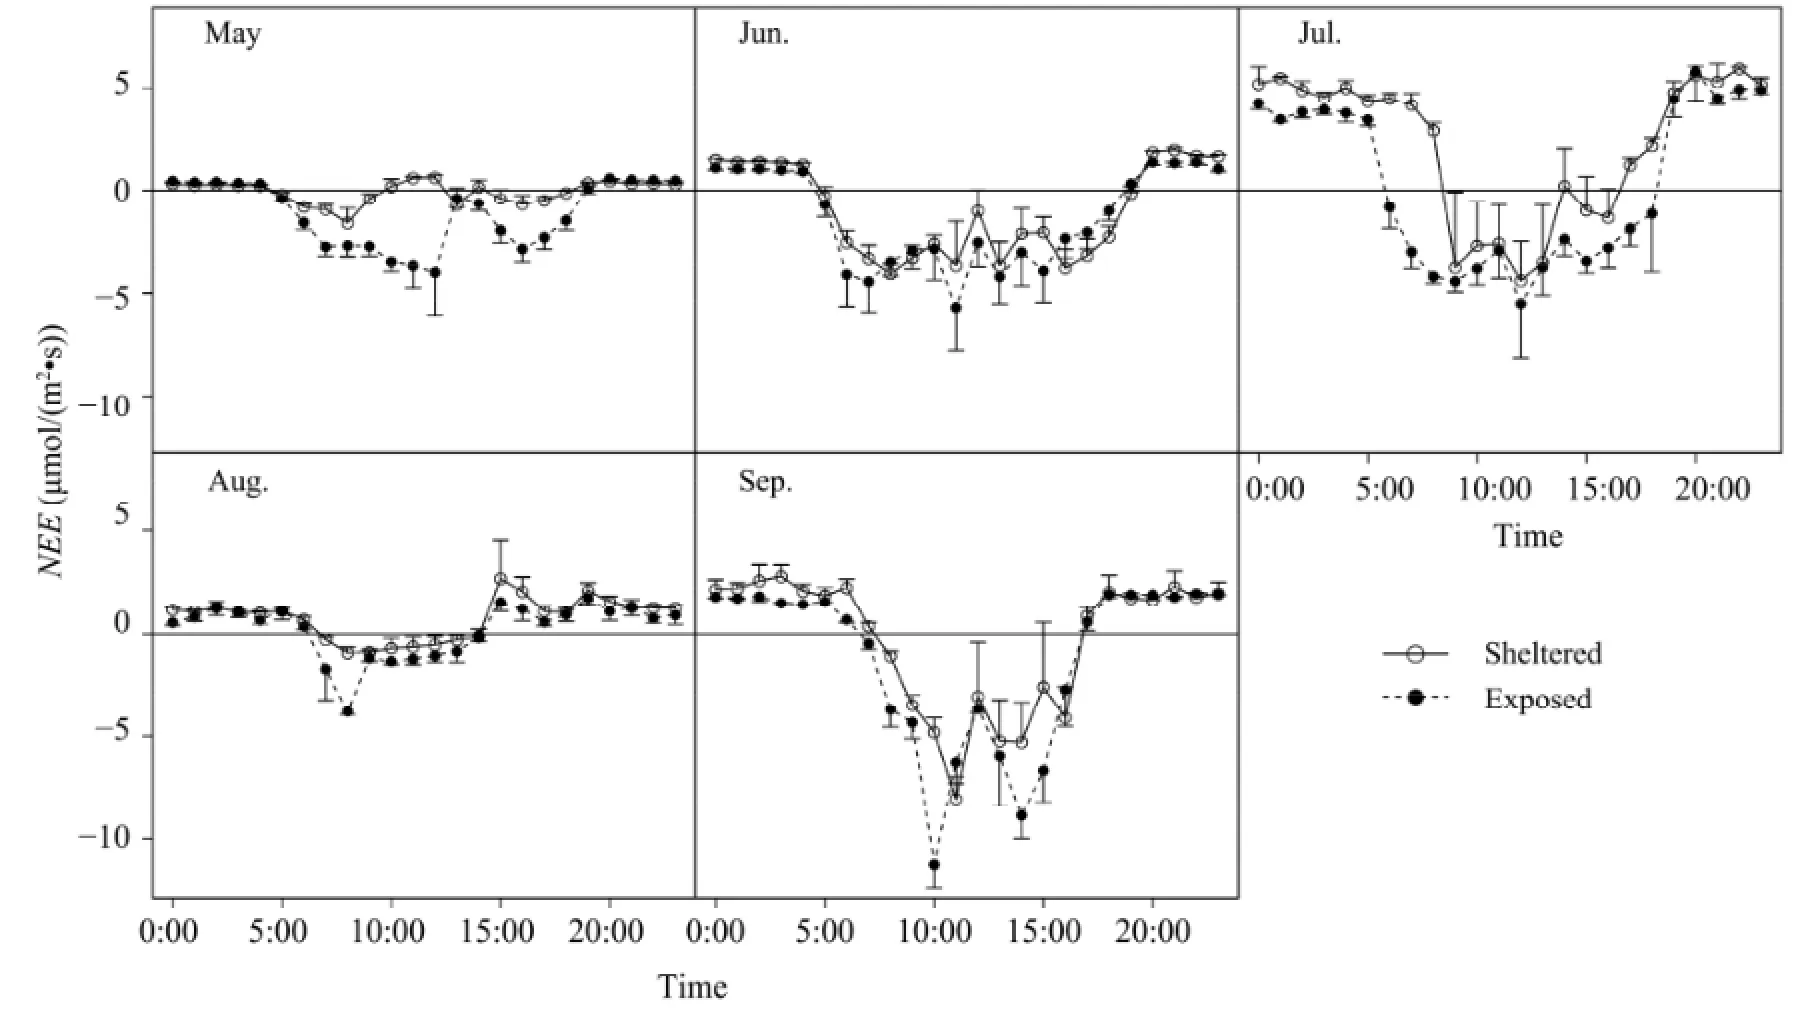
Figure 4 Diurnal dynamics of net ecosystem CO2exchange (NEE) under the sheltered and exposed treatments fromMay to September in 2012. Empty circles indicateNEEin exposed, and solid black circles indicateNEEin sheltered

Figure 5 Sum of dailyNEE, carbon sequestration, and emission on the both sides of the shield from May to September
4 Discussion
4.1 Direct effects of reduced wind speed
As a result of wind speed reduction and changes in turbulent transfer rates, the microclimate in the sheltered zone was modified (Cleugh, 2002; Brandleet al., 2004). In this study, the sheltered topsoil water content tended to be 15% wetter than in the open, and topsoil temperature tended to be about 1 °C warmer than in the exposed. According to Zhang and Brandle (1996), the combination of increased moisture and temperature in topsoil has a positive effect on plant physiology and growth in semi-arid grasslands, and our findings confirmed this.
ReducedBLCleafresulting from decreased wind velocity contributes to the decoupling of stomatal exchange with ambient conditions and lessening the relationship between changes in stomatal conductance and the rate of transpiration (Schuepp, 1993). Our results indicated that the magnitude of shelteredBLCleafwithin 5H(whereHis the height of the wind shield) was reduced by 21% when the wind speed decreased by 39%. Also, the calculatedGtvaried with wind speed and water conditions; we found thatGtincreased with wind speed only at wind speeds in the range between 0 and 0.5 m/s in moderately dry conditions. However, the control of wind speed on the total conductance was stronger when moisture stresses from soil and air were low, and the range of the wind speed increased to between 0 and 2.0 m/s when the soil water potential and vapor pressure deficit were−0.5 MPa and 0.5 kPa, respectively, and even increased to 4 m/s when the soil water potential and vapor pressure deficit were −0.033 MPa and 0.2 kPa, respectively.
In addition, we found that the direct influences of reduced wind speed onANwere negligibly small unless the wind speed was very close to zero. Previous studies on the impact of wind speed on net photosynthesis rate and transpiration rate showed similar results (Daudetet al., 1999). For example, Kitayaet al.(2003) found that the net photosynthetic rate and the transpiration rate increased sharply as the air current speeds increased from 0.01 to 0.2 m/s, and then slowed down gradually in the range from 0.2 to 1.0 m/s. In contrast to transpiration, the net photosynthetic rate was almost constant at air current speeds ranging from 0.5 to 1.0 m/s. Thus, the influence of wind speed on the plant photosynthesis process could be ignored unless it was below 0.2 m/s.
4.2 Indirect impact of reduced wind speed
Reduced wind speed indirectly affects plant physiological activities by changing the ambient microclimate (Brandleet al., 2004). The sheltered meanANofStipa kryloviiin this study was about 45% more than the exposed in 2012 because of the wetter and warmer topsoil in the leeward side. However, there were slight differences in measuredGSandTrbetween sheltered and exposed. One thing to note here is that the diurnal variation of the photosynthesis process was averaged from June to September. The shelteredGSwas significantly greater than the exposedGSin June and July, but was converted by the abnormal rainfall in September. However, greater exposedGSdid not represent greaterAN, especially in the end of the growing season, probably because of the non-stomatal limitation.
WUEleafis described as the net carbon uptake per amount of water lost from the ecosystem (Bacelaret al., 2012). The intrinsicWUE, defined as net carbon assimilation divided by stomatal conductance in this experiment (Figure 2), showed the advantage of the reduced wind speed. The result of higherWUEleafon the leeward side than the windward side was also consistent with previous studies. For example, Davis and Norman (1988) suggested that under some conditions, sheltered plants made more efficient use of available water. However, our result differs from Monteith (1981), who suggested that water use efficiency in shelter was unlikely to increase unless there was a significant decrease in the saturation vapor pressure deficit.
Changes of soil moisture and temperature caused by the reduced wind speed also affected ecosystem carbon sequestration and emission. Our experiment results show that carbon sequestration in the leeward plots was 0.64±0.37 gC/(m2·d) more than in the exposed plots. The higher carbon assimilation rate and lower plant respiration rate in the sheltered region was caused by warmer temperature than in the exposed region in daytime but cooler at night (BrandIeet al., 2004). On the other hand, Reyet al. (2012) suggested that the variable pattern and magnitude of the relationship between net ecosystem carbon balance (NECB) and wind speed under different atmospheric stability conditions implies the role of convective turbulence. If a stable atmospheric stratification precludes CO2effluxes, unstable atmospheric conditions, characterized by large sensible heat fluxes, are more efficient than neutral conditions at a given wind speed. Hence, the ecosystem carbon exchange process is not only affected by wind speed but is also determined by atmospheric stability conditions on some level, which needs further study in the future.
5 Conclusion
This paper presents the direct and indirect impacts of windbreak-reduced wind speed on soil moistureand temperature, plant photosynthesis, and carbon sequestration in a semi-arid ecosystem during the growing season of 2012. As a result of wind speed reduction and changes in the turbulent transfer rate, topsoil moisture and temperature and boundary layer resistance on the sheltered side were all increased. The lower boundary layer conductance, coupled with the stomatal conductance, brought down leaf transpiration, but this effect of reduced BLC depended on the moisture stresses from air and soil, and was negligible for wind speed greater than about 2.0 m/s. The net assimilation rate ofStipa kryloviiand community carbon sequestration were also indirectly affected by the reduced wind speed: Warmer and wetter soil caused by the reduced evapotranspiration and sensible heat flux enhanced photosynthesis and carbon sequestration. Our results, limited to a single plot within one growth season, imply that the indirect impact of reduced wind speed on plant physiology and ecosystem carbon sequestration via soil moisture and temperature was much stronger than the direct effect with altered boundary layer conductance. In conclusion, reduced wind speed exhibited a positive effect on mitigation of water stress and it enhanced grass growth in a semi-arid steppe at a regional scale.
Acknowledgments:
This research was jointly supported by the National Science Foundation of China (Nos. 41171445 and 41321001), the State Key Laboratory of Earth Surface Processes and Resources Ecology (No. 2012-TDZY-31), and the National Program on Key Basic Research Project (No. 2014CB954303).
Bacelar EL, Moutinho-Pereira JM, Gonçalves BM,et al., 2012. Water use strategies of plants under drought conditions. In: Plant Responses to Drought Stress. Springer, New York, pp. 145-170.
Bang C, Sabo JL, Faeth SH, 2010. Reduced wind speed improves plant growth in a desert city. PloS One, 5(6): e11061.
Brandle JR, Hodges L, Zhou XH, 2004. Windbreaks in North American agricultural systems. In: Nair PKR, Rao MR, Buck LE (eds.). New Vistas in Agroforestry. Springer: Dordrecht, The Netherlands, pp. 65-78.
Brazdil R, Chroma K, Dobrovolny P,et al., 2009. Climate fluctuations in the Czech Republic during the period 1961-2005. International Journal of Climatology, 29(2): 223-242.
Cleugh H, 1998. Effects of windbreaks on airflow, microclimates and crop yields. Agroforestry Systems, 41(1): 55-84.
Cleugh H, 2002. Field measurements of windbreak effects on airflow, turbulent exchanges and microclimates. Animal Production Science, 42(6): 665-677.
Daudet FA, Le Roux X, Sinoquet H,et al., 1999. Wind speed and leaf boundary layer conductance variation within tree crown: Consequences on leaf-to-atmosphere coupling and tree functions. Agricultural and Forest Meteorology, 97(3): 171-185.
Davis J, Norman J, 1988. Effects of shelter on plant water use. Agriculture, Ecosystems & Environment, 22: 393-402.
Gao Q, Yu M, Zhang XS,et al., 2005. Modelling seasonal and diurnal dynamics of stomatal conductance of plants in a semi-arid environment. Functional Plant Biology, 32(7): 583.
Gao Q, Zhang XS, Huang YM,et al., 2004. A comparative analysis of four models of photosynthesis for 11 plant species in the Loess Plateau. Agricultural and Forest Meteorology, 126(3-4): 203-222.
Guo H, Xu M, Hu Q, 2011. Changes in near-surface wind speed in China: 1969-2005. International Journal of Climatology, 31(3): 349-358.
Hao Y, Wang Y, Mei X,et al., 2008. CO2, H2O and energy exchange of an Inner Mongolia steppe ecosystem during a dry and wet year. Acta Oecologica, 33(2): 133-143.
Hu X, Liu LY, Yan P,et al., 2006. The effect of different soil surface on wind erosion in Taipusi County, Inner Mongolia. Research of Soil and Water Conservation, 13(4): 116-119.
Iacono MJ, 2009. Why is the Wind Speed Decreasing? Miltion, MA: Blue Hill Meteorological Observatory.
Joseph M, 2010. Why winds are slowing. [http://www.nature.com/ news/2010/101017/full/news.2010.543.html, accessed May 5, 2014]
Kitaya Y, Tsuruyama J, Shibuya T,et al., 2003. Effects of air current speed on gas exchange in plant leaves and plant canopies. Advances in Space, 30(1): 177-182.
McVicar TR, Roderick ML, Donohue RJ,et al., 2012. Global review and synthesis of trends in observed terrestrial near-surface wind speeds: Implications for evaporation. Journal of Hydrology, 416: 182-205.
McVicar TR, Van Niel TG, Li LT,et al., 2008. Wind speed climatology and trends for Australia, 1975-2006: Capturing the stilling phenomenon and comparison with near-surface reanalysis output. Geophysical Research Letters, 35(20): L20403.
Monteith J, 1981. Coupling of plants to the atmosphere. In: Grace J, Ford ED, Jarvis PG (eds.). Plants and Their Atmospheric Environment. Blackwell Scientific Publications, Oxford, pp. 1-29.
Moore JR, Manley BR, Park D,et al., 2013. Quantification of wind damage to New Zealands planted forests. Forestry, 86(2): 173-183.
Munson SM, Belnap J, Okin GS, 2011. Responses of wind erosion to climate-induced vegetation changes on the Colorado Plateau. Proceedings of the National Academy of Sciences of the United States of America, 108(10): 3854-3859.
Pirazzoli PA, 2003. Recent near-surface wind changes in the central Mediterranean and Adriatic areas. International Journal of Climatology, 23(8): 963-973.
Pryor SC, Barthelmie RJ, Young DT,et al., 2009. Wind speed trends over the contiguous United States. Journal of Geophysical Research, 114(D14): D14105.
Pryor SC, Ledolter J, 2010. Addendum to "Wind speed trends over the contiguous United States.'' Journal of Geophysical Research: Atmosphere, 115(D10): D10103.
Ravi S, D'Odorico P, Breshears DD,et al., 2011. Aeolian processes and the biosphere. Reviews of Geophysics, 49(3): RG3001.
Rey A, Belelli-Marchesini L, Were A,et al., 2012. Wind as a main driver of the net ecosystem carbon balance of a semi-arid Mediterranean steppe in the southeast of Spain. Global Change Biology, 18: 539-554.
Schuepp PH, 1993. Leaf boundary layers. New Phytologist, 125(3): 477-507.
Sterk G, 2003. Causes, consequences and control of wind erosion in Sahelian Africa: A review. Land Degradation & Development, 14(1): 95-108.
Thornley JH, Johnson IR, 1990. Plant and Crop Modelling. Clarendon Press, Oxford, UK.
Tuller SE, 2004. Measured wind speed trends on the west coast of Canada. International Journal of Climatology, 24(11): 1359-1374.
Waterhouse JS, Switsur VR, Barker AC,et al., 2004. Northern European trees show a progressively diminishing response to increasing atmospheric carbon dioxide concentrations. Quaternary Science Reviews, 23(7-8): 803-810.
Zhang HH, Brandle JR, 1996. Windbreak effect on biomass and grain mass accumulation of corn: A modeling approach. Agronomy Journal, 88(4): 607-613.
Zhu YJ, Gao Q, Liu JS,et al., 2007. Aggregation of plant functional types based on models of stomatal conductance and photosynthesis. Journal of Plant Ecology (Chinese version), 31(5): 873-882.
Appendix A: Thornley and Johnson (1990) leaf model for C3 plants
The model takes the following mathematical form:

where:
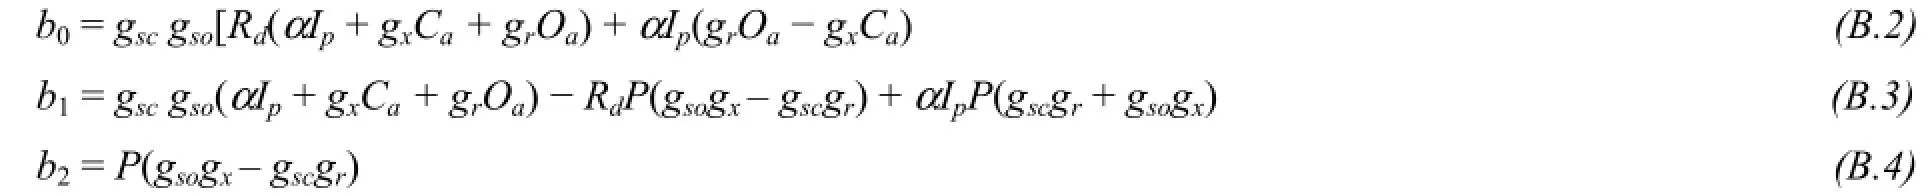
gscandgsoare stomatal conductance for CO2and O2, respectively;CaandOa, the partial CO2and O2pressure on leaf surface, respectively;gχandgr(μmol/(m2·s·kPa)), the carboxylation and photorespiration conductance, respectively. These parameters were considered dependent on temperature, so that

where constant parametersα25,gχ25,gr25andRd25were determined by fitting the model to the field data;Tis the leaf temperature (°C);R= 8.314 kJ/(mol·K), the gas constant;Eaj= 37.0 kJ/mol, andEar= 66.4 kJ/mol, are the temperature coefficients.H= 220 kJ/mol, andS= 0.71 kJ/(mol·K). Constant 298 has units of K.
Appendix B: Gaoet al. (2005) stomatal conductance model for C3 species
The model by Gaoet al. (2005) define stomatal conductance a function of incident photon flux density, vapor pressure deficit in air, and soil water potential. The model takes the following form:

where:

Ip
0

ψs(MPa) is the soil water potential;Ip(mmol/(m2·s)) is the incident photon flux density;π0(MPa), the osmotic pressure at zero light intensity (dark);β((kPa·m2·s)/mol), the apparent elastic modulus of the guard cell structure;rz0((kPa·m2·s)/mol), soil-to-leaf hydraulic resistance;kβgis thus approximately the sensitivity of stomatal conductance to vapor pressure deficit (D).λ(dimensionless) is the constant parameter;πp(MPa), the maximum osmotic pressure inducible by incident light;C(kPa), CO2on leaf surface;C0(kPa), the reference CO2.kI(mmol/(m2·s)), the half-saturation light intensity. The parameters to be fitted areπ0,πp,β,rz0andkI.
Appendix C: Boundary layer conductance model
The boundary layer conductance model was based on the principle of hydromechanics and the Maxwell-Gilliland function. The expressions are:

where:

gb(molH2O/(m2·s)) is the boundary layer conductance;Ha(m) is the thickness of the boundary layer at a specific characteristic lengthL(m);DW(m2/s) is vapor diffusivity,R(m3·kPa)/(K·mol)) is the gas constant;MA,B(g/mol) is the molar mass of water and air;VA,Bis the molecular volume of water and air;μ(Pa·s) is the dynamic viscosity; ρ (kg/m3) is fluid density;n(dimensionless) is a constant fitted by the model; andu(m/s) is the wind velocity.
: Jin DY, Gao Q, Wang YL,et al., 2014. Impacts of reduced wind speed on physiology and ecosystem carbon flux of a semi-arid steppe ecosystem. Sciences in Cold and Arid Regions, 6(6): 0556-0565.
10.3724/SP.J.1226.2014.00556.
Received: February 20, 2014 Accepted: May 26, 2014
*Correspondence to: Dr. Qiong Gao, Professor of College of Natural Sciences, Beijing Normal University, 19 Xinjiekouwai Avenue, Beijing 100875, China. Tel: +86-10-58806050; Email: gaoq@bnu.edu.cn
杂志排行

Sciences in Cold and Arid Regions的其它文章
- A discussion on improving typhoon observation through radar by scanning the negative elevation angle
- The effects of the identity of shrub species on the distribution and diversity of ground arthropods in a sandy desert ecosystem of northwestern China
- An analysis on ecological civilization construction in Gansu based on a quantified SWOT framework
- The effects of the identity of shrub species on the distribution and diversity of ground arthropods in a sandy desert ecosystem of northwestern China
- An estimation of groundwater storage variations from GRACE gravity satellites in the Heihe River Basin, northwestern China
- Study on dynamic changes of land desertification in the circum-lake zone of the Qinghai Lake in the past 30 years supported by Remote Sensing and Geographical Information System