Variations of the temperature and solar activity in China
2014-03-31MingQiLiQuanShengGeZhiXinHaoJingYunZheng
MingQi Li, QuanSheng Ge, ZhiXin Hao, JingYun Zheng
Key Laboratory of Land Surface Pattern and Simulation, Institute of Geographical Sciences and Natural Resources Research, Chinese Academy of Sciences, Beijing 100101, China
Variations of the temperature and solar activity in China
MingQi Li*, QuanSheng Ge, ZhiXin Hao, JingYun Zheng
Key Laboratory of Land Surface Pattern and Simulation, Institute of Geographical Sciences and Natural Resources Research, Chinese Academy of Sciences, Beijing 100101, China
In this paper we analyze daily mean, minimum, and maximum temperature data collected at 119 meteorological stations over five regions of China during the period 1951-2010. The series of minimum, maximum, and mean temperatures from each climatic region have similar signatures, but there are differences among the five regions and the countrywide average. The results indicate that the periods of faster warming were not synchronous across the regions studied: warming in northeast China and Tibet began in 1986, while in central-east, southeast, and northwest China the warming emerged in 1995. Furthermore, central-east and northwest China, and Tibet, have warmed continuously since 2000, but the temperature has decreased during this period in southeast China. We evaluated the evolution of these temperature series using a novel nonlinear filtering technique based on the concept of the lifetime of temperature curves. The decadal to secular evolution of solar activity and temperature variation had similar signatures in the northeast, southeast, and northwest regions and the average across the whole country, indicating that solar activity is a significant control on climate change over secular time scales in these regions. In comparison with these regions, the signatures were different in central-east China and Tibet because of regional differences (e.g., landforms and elevation) and indirect effects (e.g., cloud cover influencing the radiation balance, thereby inducing climate change). Furthermore, the results of wavelet analysis indicated that the El Niño Southern Oscillation (ENSO) has had a significant impact on climate change, but at different times among the regions, and these changes were most probably induced by differing responses of the atmospheric system to solar forcing.
temperature variation; solar activity; lifetime; wavelet analysis; China
1 Introduction
Temperature variation is one of the key indicators of climate change, and many researchers have reconstructed temperature series to track past changes in climate (e.g., Geet al., 2003; Liuet al., 2005; Mannet al., 2008). However, much controversy remains regarding the mechanism that causes climate change. The Intergovernmental Panel on Climate Change (IPCC, 2007) concluded that significant warming began to emerge from background variations between 1970 and 1980, and this was predominantly attributed to increases in anthropogenic greenhouse gas (GHG) release. However, Singer (2008) and Idso and Singer (2009) proposed that natural processes, especially solar activity, rather than human interference, dominate the climate. Furthermore, Le Mouëlet al. (2008, 2009) and Kossobokovet al. (2010) studied the effect of solar variability on temperatures recorded at meteorological stations in the USA and Europe, and they also concluded that solar activity is a significant forcing factor for climate change in these areas. However, they suggested that their preliminary study should be verified by analyzing data from other regions.
As is well known, China is located in the east of Eurasia, to the west of the Pacific Ocean, and with the Tibet Plateau in the southwest. In China, regional differences in climate change result from the uniquelandforms of each region. Consequently, China is an ideal area in which to investigate the mechanism of climate change, especially the effects of solar activity on temperature variations. Previous studies have considered the relationship between solar activity and climate change (e.g., Honget al., 2000a,b; Xuet al., 2002, 2006; Feng and Han, 2009), and found that solar activity plays an important role in climate change. However, the temperature series reconstructed from proxy indexes, such as tree rings and peat, are of a lower resolution than data obtained from meteorological stations and are thus likely to miss a significant amount of the high-frequency variability.
Therefore, in this paper, we will consider the relationship between daily mean, minimum, and maximum temperatures, and sunspot numbers, with the aim of determining the effects of solar activity on temperature variations in China.
2 Materials and methods
Based on the annual mean temperatures observed at 603 stations during the period 1961-2007, China was divided into the following five climatic regions: Northeast (NE), Northwest (NW), Central-East (CE), Tibet (TB), and Southeast (SE) (Geet al., 2010; shown in figure 1). We obtained daily mean, minimum, and maximum temperatures (available via http://cdc.cma.gov.cn) from 119 meteorological stations for the period 1951-2010 from these five regions (Figure 1). We also obtained the daily sunspot numbers series (available via http://sidc.be/sunspot-data).
To reduce the otherwise large effect of annual variations, we used a novel nonlinear filtering technique, the lifetime (Li(t)) of temperature curves approach (Le Mouëlet al., 2008, 2009), to evaluate the temperature changes:

where an averaging interval ofθ= 22 × 365 days was used to eliminate signals directly related to the solar cycle (s), andTis temperature.
We also chose as a proxy for solar activity the squared daily variation (Q(t)) of the sunspot numbers (Le Mouëlet al., 2008, 2009), which is:

and whereθ= 22 × 365 days.
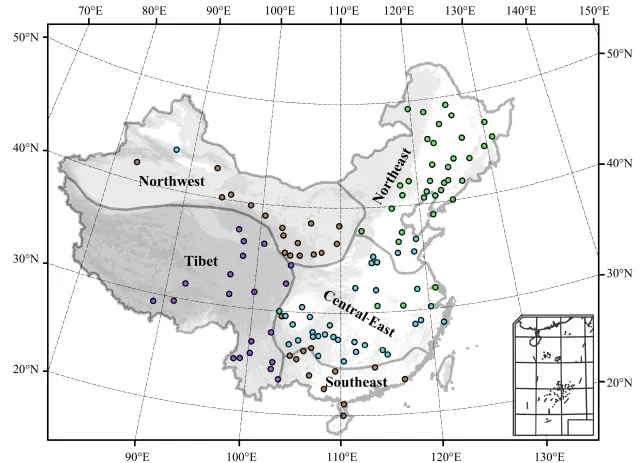
Figure 1 Climatological stations and climatic regions of China used for calculating regional averages.
3 Results
3.1 Temperature variations in China
The temperature data from the 119 stations consisted of series of daily minimum, mean, and maximum temperatures. Figures 2-4 show the changes across the five climatic regions, and the average values for the whole of China; the data were smoothed using a four-year centered running mean window. The minimum, maximum, and mean temperature series from each climatic region have similar signatures, but there are differences among the five regions and the countrywide average.
In the series of daily minimum temperatures (Figure 2), the lowest temperature occurred around 1970 in the five regions. NE, NW, and TB display jagged, zigzag-like trends before 1986, and a more rapid rise since then, with the current minimum temperature being the highest of the past 60 years; however, for NE the increase in minimum temperature was less pronounced after 1990. In contrast, the rapid warming began in 1995 in CE and SE, and CE has displayed a continuous warming trend until the present day, while in SE the highest daily minimum temperature was recorded in 1998 and it has decreased since then. Furthermore, the amplitude of the warming signal was largest in NW and TB. The daily minimum temperature averaged over the whole of China fluctuated before 1985 and has increased continuously since then, but at a lower rate since 2000.
The daily maximum and mean temperature profiles were similar except for NW, which followed a zigzag-shaped curve before 1995, rose rapidly between 1995 and 2000, and decreased again after 2000. For the whole of China, the daily mean temperature followed a pattern similar to the daily minimum temperature, while the maximum temperature increased more rapidly from 1995 and fluctuated more widely after 2000.

Figure 2 Daily minimum temperature curves (four-year running mean) for the five climatic zones and the average curve for the whole of China

Figure 3 Daily maximum temperature curves (four-year running mean) for the five climatic zones and the average curve for the whole of China
3.2 Secular evolution of temperature in China
In this paper we used a nonlinear analytical technique developed for time series whose complexity arises from the interaction between different sources over different time scales (Le Mouëlet al., 2009). The lifetime (higher frequency) of features was extracted from the time series using the technique of Le Mouëlet al. (2008), and the results are shown in figures 5 and 6.
At decadal and multi-decadal scales, the daily minimum temperature profile for NE can be subdivided into five periods (Figure 5): two with more rapidly increasing trends (1969-1978 and 1987-1991), and three with decreasing trends (1960-1969, 1978-1987, and 1991 to the present). For SE, NW, and China, the daily minimum temperature trend is consistent with NE, except during the period after 1990. On the other hand, CE and TB show a decreasing trend to 1980, followed by an increasing trend since then.
The daily maximum temperature curves display jagged, zigzag-like trends in the five regions over decadal to secular time scales (Figure 6). In NE, the lowest maximum temperature occurred around 1970, but the temperature has increased since then, until it stabilized after 1990. CE shows a decreasing trend to 1980, an increase from 1980 to 1995, and a decrease again from 1995 to the present. For SE, the temperature trend has four distinct periods: two periods of increase (before 1965, and 1971-1982), and two periods of decrease (1965-1971, and 1982 to the present). Temperature fluctuations were more frequent in NW,with four periods of clearly increasing maximum temperature (before 1965, 1970-1974, 1980-1986, and 1990 to the present), and an additional three that followed a decreasing trend (1968-1970, 1974-1980, and 1986-1990). The daily maximum temperature for TB was generally decreasing before 1980, and also between 1992 and 1996, but increased from 1980 to 1992, and from 1996 to the present day. The daily maximum temperature averaged across the whole of China displayed seven main periods: three of sharply rising temperature (before 1966, 1970-1974, and 1996 to the present), one with a slower increase (1988-1993), and three periods of falling temperature (1966-1970, 1974-1988, and 1993-1996).
The squared daily variation of the sunspot numbers (Figures 5 and 6) followed a decreasing trend until about 1970, between 1983 and 1987, and also after 1990, but increased in the periods 1970-1983 and 1987-1990. Although the temperature changes differ from region to region, the temperature trend is consistent with solar activity over secular time scales. Regarding the regional differences, the NE temperature trend follows the solar activity more closely than in other regions. The largest difference between minimum and maximum temperatures occurs in CE and TB, and the trend of maximum temperature follows the solar activity more closely than does the minimum temperature.

Figure 4 Daily mean temperature curves (four-year running mean) for the five climatic zones and the average curve for the whole of China

Figure 5 Lifetime of daily minimum temperature for the five climatic regions and the whole of China (black curves), compared with the sunspot numbers representing solar activity (the squared daily variation; red curves)
4 Discussion
The profiles of daily minimum, maximum, and mean temperature within each region had similar features. However, there were differences within the NW region, where the timing of the periods of faster warming differed as the daily minimum and mean temperatures began to increase in 1985, while the emergence of the increasing trend in maximum temperature was delayed until 1995. In addition, the daily minimum and mean temperatures increased continuously from 1985 until the present day, while the maximum temperature decreased after 2000.
Although the temperature trends showed similar signatures, they differed among regions, and the timing of the periods of faster warming was not synchronous. For NE and TB, the most rapid warming occurred after 1986, while for CE, SE, and NW it emerged after 1995. In addition, CE, NW, and TB have warmed steadily since 2000, while for NE the trend is less obvious, and the temperature has fallen in SE; the decreasing sunshine duration is probably the primary cause of the temperature decline in SE (Yinet al., 2010). We conclude from figures 2-4 that there was indeed warming at the end of the 20thcentury in China, but the characteristics of this warming differ from that recorded in some areas of the USA (Le Mouëlet al., 2008), and from that shown in figure SPM-4 of Working Group 1, part of the IPCC Fourth Assessment Report (IPCC, 2007).
Over decadal to secular time scales, the temperature trend, especially the daily maximum temperature, reflects trends in solar activity, particularly in NE, andthis implies that solar activity plays a significant role in climate change at the secular scale. However, the temperature trend differs among the regions at the secular scale (Figures 5 and 6), and this may be caused by regional differences (e.g., topography) and other indirect effects, such as the alteration of the radiation balance by clouds inducing climate change (Svensmark, 1998). That is to say, the entire interconnected system participates in the final climate outcome via multiple, nonlinear feedbacks that can amplify or diminish climate forcing, as well as changing the nature and consistency of the response (Rind, 2002).
To determine the differences among the five climatic regions over decadal to secular time scales, we analyzed the daily minimum temperature series using the wavelet analysis method (Torrence and Compo, 1998). The results showed that changes in the daily minimum temperature from the five climatic regions and the average for the whole of China had a common period of two to seven years (Figure 7), and this suggests the influence of ENSO on temperature variations in China. However, different regions have different periods. NE has a period of about 15 years, which indicates that the Pacific decadal oscillation affects this region, but this was not seen in the other regions (Figure 7). Consequently, it appears that the response of the atmospheric system to solar forcing displays regional and temporal inhomogeneity at different scales (Courtillotet al., 2010), and that this causes the observed regional differences.

Figure 6 Lifetime of daily maximum temperature for the five climatic regions and the whole of China (black curves), compared with the sunspot numbers representing solar activity (the squared daily variation; red curves)
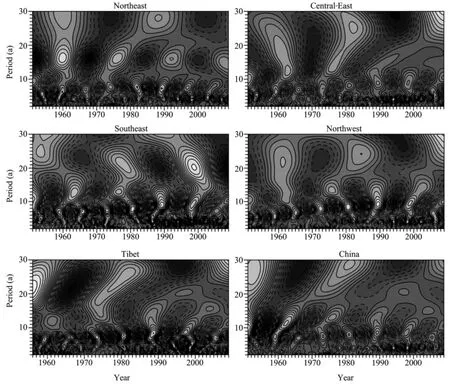
Figure 7 Wavelet analysis of the daily minimum temperature from the five climatic regions and the whole of China
5 Conclusions
We analyzed patterns of temperature disturbance and the correlation between solar activity and temperature variations in China during the period 1951-2010 using a novel nonlinear filtering technique based on the lifetime of temperature curves. Our results showed that the temperature profiles were similar, but there were regional differences: the periods of enhanced warming were not synchronous across China. Warming in NE and TB began around 1986, while for CE, SE, and NW it began in 1995. In addition, CE, NW, and TB have warmed continuously since 2000, while there has been a cooling trend in SE. At the same time, solar activity had a significant influence on climate change at the secular scale, but there were regional differences driven by factors such as topography and other indirect effects, including the impact of clouds on the radiation balance, which in turn drives climate change. The results of wavelet analysis also indicated that ENSO has a significant impact on climate change, and that there are differences among the regions.
Acknowledgments:
We gratefully acknowledge the support of the National Natural Science Foundation of China (Grant No. 41201200) and the CAS Strategic Priority Research Program (Grant No. XDA05080101).
Courtillot V, Le Mouël JL, Blanter E,et al., 2010. Evolution of seasonal temperature disturbances and solar forcing in the US North Pacific. Journal of Atmospheric and Solar-Terrestrial Physics, 72(1): 83-89.
Feng B, Han YB, 2009. Possible effect of solar activity on variation of the tree-rings of a 500 aPlatycladus orientalisat the Mausoleum of Emperor Huang. Science in China (Series G: Physics, Mechanics and Astronomy), 52(4): 631-639.
Ge QS, Zheng JY, Fang XQ,et al., 2003. Winter half-year temperature reconstruction for the middle and lower reaches of the Yellow River and Yangtze River, China, during the past 2000 years. The Holocene, 13(6): 933-940.
Ge QS, Zheng JY, Hao ZX,et al., 2010. Temperature variation through 2000 years in China: An uncertainty analysis of reconstruction and regional difference. Geophysical ResearchLetters, 37(3): L03703. DOI: 10.1029/2009gl041281.
Hong Y, Liu D, Jiang H,et al., 2000a. Evidence for solar forcing of climate variation from δ18O of peat cellulose. Science in China (Series D: Earth Sciences), 43(2): 217-224.
Hong YT, Jiang HB, Liu TS,et al., 2000b. Response of climate to solar forcing recorded in a 6000-year δ18O time-series of Chinese peat cellulose. The Holocene, 10(1): 1-7.
Idso C, Singer S, 2009. Climate Change Reconsidered: 2009 Report of the Nongovernmental International Panel on Climate Change (NIPCC). The Heartland Institute, Chicago, IL.
International Panel on Climate Change (IPCC), 2007. Climate Change 2007: The Physical Science Basis, Summary for Policymakers, Fourth Assessment Report. Cambridge University Press, Cambridge, UK.
Kossobokov V, Le Mouël JL, Courtillot V, 2010. A statistically significant signature of multi-decadal solar activity changes in atmospheric temperatures at three European stations. Journal of Atmospheric and Solar-Terrestrial Physics, 72(7-8): 595-606.
Le Mouël JL, Blanter E, Shnirman M,et al., 2009. Evidence for solar forcing in variability of temperatures and pressures in Europe. Journal of Atmospheric and Solar-Terrestrial Physics, 71(12): 1309-1321.
Le Mouël JL, Courtillot V, Blanter E,et al., 2008. Evidence for a solar signature in 20th-century temperature data from the USA and Europe. Comptes Rendus Geoscience, 340(7): 421-430.
Liu XH, Qin DH, Shao XM,et al., 2005. Temperature variations recovered from tree-rings in the middle Qilian Mountain over the last millennium. Science in China (Series D: Earth Sciences), 48(4): 521-529.
Mann ME, Zhang Z, Hughes MK,et al., 2008. Proxy-based reconstructions of hemispheric and global surface temperature variations over the past two millennia. Proceedings of the National Academy of Sciences U.S.A., 105(36): 13252-13257.
Rind D, 2002. The sun’s role in climate variations. Science, 296(5568): 673-677.
Singer SF, 2008. Nature, not Human Activity, Rules the Climate: Summary for Policymakers of the Report of the Nongovernmental International Panel on Climate Change. The Heartland Institute, Chicago, IL.
Svensmark H, 1998. Influence of cosmic rays on Earth's climate. Physical Review Letters, 81(22): 5027-5030.
Torrence C, Compo GP, 1998. A practical guide to wavelet analysis. Bulletin of the American Meteorological Society, 79(1): 61-78.
Xu H, Hong Y, Lin Q,et al., 2002. Temperature variations in the past 6000 years inferred from δ18O of peat cellulose from Hongyuan, China. Chinese Science Bulletin, 47(18): 1578-1584.
Xu H, Hong Y, Lin Q,et al., 2006. Temperature responses to quasi-100-yr solar variability during the past 6000 years based on δ18O of peat cellulose in Hongyuan, eastern Qinghai-Tibet Plateau, China. Palaeogeography, Palaeoclimatology, Palaeoecology, 230(1-2): 155-164.
Yin YH, Wu SH, Dai EF, 2010. Determining factors in potential evapotranspiration changes over China in the period 1971−2008. Chinese Science Bulletin, 55(29): 3329-3337.
: Li MQ, Ge QS, Hao ZX,et al., 2014. Variations of the temperature and solar activity in China. Sciences in Cold and Arid Regions, 6(6): 0531-0539.
10.3724/SP.J.1226.2014.00531.
Received: July 10, 2014 Accepted: September 1, 2014
*Correspondence to: MingQi Li, Institute of Geographic Sciences and Natural Resources Research, Chinese Academy of Sciences. 11A Datun Road, Chaoyang District, Beijing 100101, China. Beijing 100101, China. E-mail: limq@igsnrr.ac.cn
杂志排行

Sciences in Cold and Arid Regions的其它文章
- A discussion on improving typhoon observation through radar by scanning the negative elevation angle
- The effects of the identity of shrub species on the distribution and diversity of ground arthropods in a sandy desert ecosystem of northwestern China
- An analysis on ecological civilization construction in Gansu based on a quantified SWOT framework
- The effects of the identity of shrub species on the distribution and diversity of ground arthropods in a sandy desert ecosystem of northwestern China
- An estimation of groundwater storage variations from GRACE gravity satellites in the Heihe River Basin, northwestern China
- Study on dynamic changes of land desertification in the circum-lake zone of the Qinghai Lake in the past 30 years supported by Remote Sensing and Geographical Information System