Technical Research for Detector of Grain Moisture Content Based on Error Compensation
2014-03-07DongYudeYangXianlongYeFeiPanKaiJinXingchiandShiDecai
Dong Yu-de, Yang Xian-long, Ye Fei, Pan Kai, Jin Xing-chi, and Shi De-cai
1School of Mechanical and Automotive Engineering, Hefei University of Technology, Hefei 230009, China
2Microsoft Corporation, One Microsoft Way, Redmond, WA 98052-6399, USA
3Quanjiao Jinxhu Mechanical Manufacturing Co., Ltd., Quanjiao 239500, Anhui, China
Technical Research for Detector of Grain Moisture Content Based on Error Compensation
Dong Yu-de1, Yang Xian-long1, Ye Fei1, Pan Kai2, Jin Xing-chi1, and Shi De-cai3
1School of Mechanical and Automotive Engineering, Hefei University of Technology, Hefei 230009, China
2Microsoft Corporation, One Microsoft Way, Redmond, WA 98052-6399, USA
3Quanjiao Jinxhu Mechanical Manufacturing Co., Ltd., Quanjiao 239500, Anhui, China
According to the existing method including testing the frequency and establishing the relationship between moisture content and frequency, a corresponding instrument was designed. In order to further improve the accuracy and rapidity of the system, a new approach to describe the relationship between the measurement error and the temperature was proposed. The error band could be obtained and divided into several parts (based on the range of temperature) to indicate the error value that should compensate the grain moisture content for the changes in temperature. By calculating the error band at the maximum and the minimum operating temperatures, as well as by determining the error compensation value from the error band based on the measurement moisture content, the final effective result was derived.
grain moisture content, frequency measurement, micro controller unit, error compensation, mathematical model
Introduction
The technology of measuring grain moisture content has been concerned for a long time as an important subject of agricultural detection area (Zhao, 2007). In China, currently, most colleges and institutions haven't participated in such kind of researches, except some whose primary researches focus on agriculture. With the construction of agricultural information gradually becomes deeply, the detection field has entered an automated and electronic era (Teng et al., 2004). In the area of grain moisture content detection, because of the high sensitivity and stability, capacitance sensor is widely used by most colleges and institutions (Liu et al., 2012). Despite the fact that some more advanced sensor technologies have been studied and applied, the capacitance sensor's advantages, such as low cost, high reliability, easy fabrication, and simple structure, make itself widely available in the detection industry (Tong et al., 2013).
In this paper, a new mathematical modeling method was developed based on the study of traditional methods. Compared with the traditional method, the new approach has assigned different importance to each factor, established the error compensation term, and structured the mathematical model. This approach mainly indicated that the model's error could be reduced by analyzing which factor was the most probable to cause the error. Based on the analysis, the mathematical model of error compensation could be structured.
From many existing experiments, it was observed that the method of converting the capacitance value to the frequency signal was the most effective one. Thus, the low cost and high stable timer IC NE555 was selected to be the frequency signal generator (Dusan, 2012).
Finally, the trial result indicated that this detector was able to measure the moisture content ranging from 8% to 25% rapidly, with the measurement frequency being up to 30 times per minute. Compared to some similar productions in the market, evaluation results demonstrated that this detector with new mathematical modeling method had higher precision and better rapidity (Lee et al., 2013).
Materials and Methods
Detector model
The model mainly consists of several modules, including the power module, the sensor module, the signal processing module, the key module, and the display module (Geng et al., 2010). Fig. 1 shows the actual model of this detector.
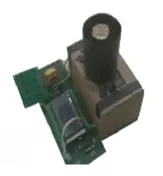
Fig. 1 Experimental model of detector of grain moisture content
The cylindrical capacitance sensor was made of iron with the thickness of 1 mm and its height is 80 mm. The sensor's outer barrel had a diameter of 60 mm and its inner barrel had a diameter of 30 mm. To avoid the edge effect, the equipotential hoop was used and placed on the sensor's both sides.
With DS18B20, the temperature can be obtained and be used for the error compensation (Ma, 2007). ATmega128 was used as the micro controller unit, and its two 8-bit timers were activated to calculate the frequency (Jack, 2010).
Mathematical modeling
Preparation for the measurement
In this research, rice was selected as the measurement object and used in all the experiments. All the experimental data were obtained with the model of detector which has been shown in Fig. 1.
As shown in Fig. 2, the grain dryer 5HY-12.5 made by Quanjiao Jinzhu Mechanical Manufacturing Corporation was used to make the samples of rice with different moisture contents. This dryer worked on the principle of forcing the hot air into the drying tower. With the hot air, the rice was dried peacefully and its moisture content was reduced to a certain value.
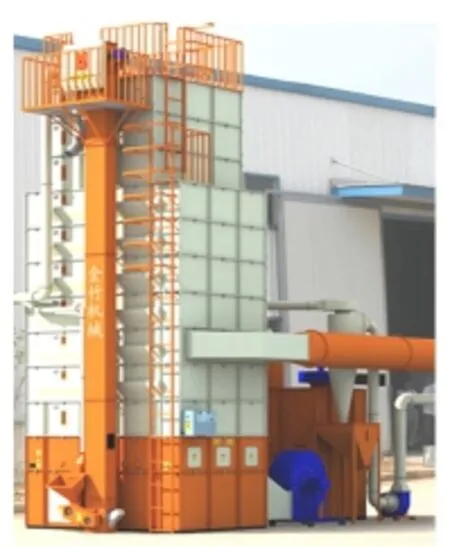
Fig. 2 5HY-12.5 grain dryer
A room with air conditioner was used as the closed laboratory, where different experimental temperatures could be obtained. When this room had a temperature of 24℃ and the sensor was empty, the result of frequency was about 155.625 KHz, and this result was viewed as the reference frequency.
Factors in measurement of rice moisture content
The cylindrical capacitance sensor with fixed volume was selected so that the volume of sensor could be ignored. Here, rice moisture content (G) is mainly affected by three factors: frequency (F), temperature(T), and mass (M). Based on the weight algorithm, a different weight coefficient K can be assigned as the followings (Zhao et al., 2005):
The weight coefficient of frequency is:
Kf=0.7.
The weight coefficient of temperature is:
Kt=0.2.
The weight coefficient of mass is:
Km=0.1.
The value of K (Kf, Kt, Km) reflects the importance of each factor.
The compaction of rice will be high when the capacitance sensor is filled with rice, because the size of rice is normally small. Meanwhile, given the fact that the volume of the cylindrical capacitance sensor is fixed, the mass of rice changes little in very iteration (Cai and Kong, 2009). In order to prove the inference, a few necessary experiments have been conducted regarding the relationship between F and M. Table 1 shows the results.

Table 1 Mass and measurement frequency of different rice with same moisture content at 24℃
From Table 1, the experimental data provided us a new conclusion that the factor of mass could be also ignored, because it only changed the frequency little, and the volume density changed slightly.
Traditional mathematical method
The traditional method of structuring mathematical model is the basic approach to structure the improved model based on error compensation.
From the consideration of working condition, the temperature's range was set from 17℃ to 24℃. Excluding the factor of temperature, the relation between frequency and moisture content was derived by another group of experiments, which described a few sequential discrete points. Table 2 shows the results.

Table 2 Moisture content and frequency of different samples of rice at 24℃
Based on Table 2, the sequential discrete points were drawn by MATLAB. Given the trajectory generated by connecting these points, the cubic curve has been selected to fit these sequential discrete points (Fig. 3) (Frank, 2003).
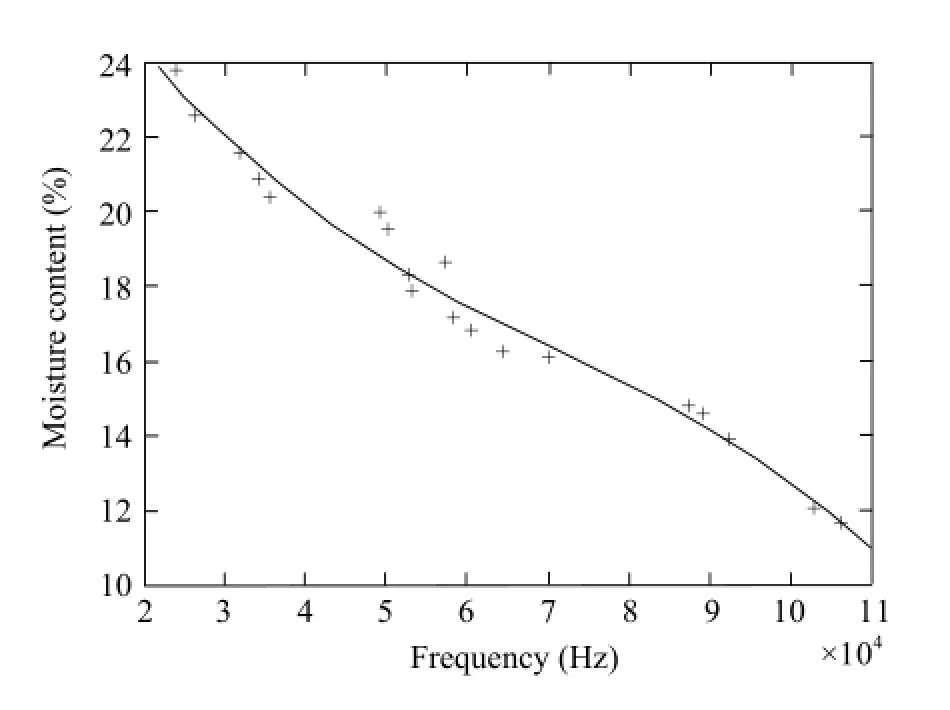
Fig. 3 Diagram of relationship between frequency and rice moisture content at 24℃
A function about frequency and rice moisture content could be used to describe this cubic curve as the following:

This function was used to describe the relation between rice moisture content (G) and the frequency (F) at a fixed temperature. As a result, a few functions could be obtained with more experiments done at different temperatures with the same method (Fig. 4). It was concluded that the curves had the same pattern, with only slight changes from the shapes. G was associated directly with F in the relationship of mapping, because the curves fluctuated slightly with temperature change.
The method of fitting the data regressively with bivariate polynomial is normally used to build the mathematical model about G (moisture content), F (frequency), and T (temperature). There are four applicable types of regressive models (Wu, 2010) .
These four models are:
Linear model:

Pure quadratic model:

Interaction model:

Full quadratic model:

Based on the regression estimates, the full quadratic model is the best one to describe the curves with the consideration of different temperatures. From MATLAB, the relationship among G, F and T was depicted (Stormy, 2013) as shown in Fig. 5.

Fig. 4 Curves of relationships between rice moisture content and frequency at different temperatures

Fig. 5 Relationship among moisture content, frequency and temperature
With MATLAB, the equation was described as the following:

As shown in Table 3, the standard values of rice moisture content (G) could be compared to theobserved values (G*) got by this model at a certain temperature (Yang et al., 2010) .
A variable Err was defined as the absolute error, and it was described as the following (Khairetdinova et al., 2011):

The values of Err in Table 3 were less than 1%, so that this mathematical model was used to establish the relation among rice moisture content, frequency, and temperature.
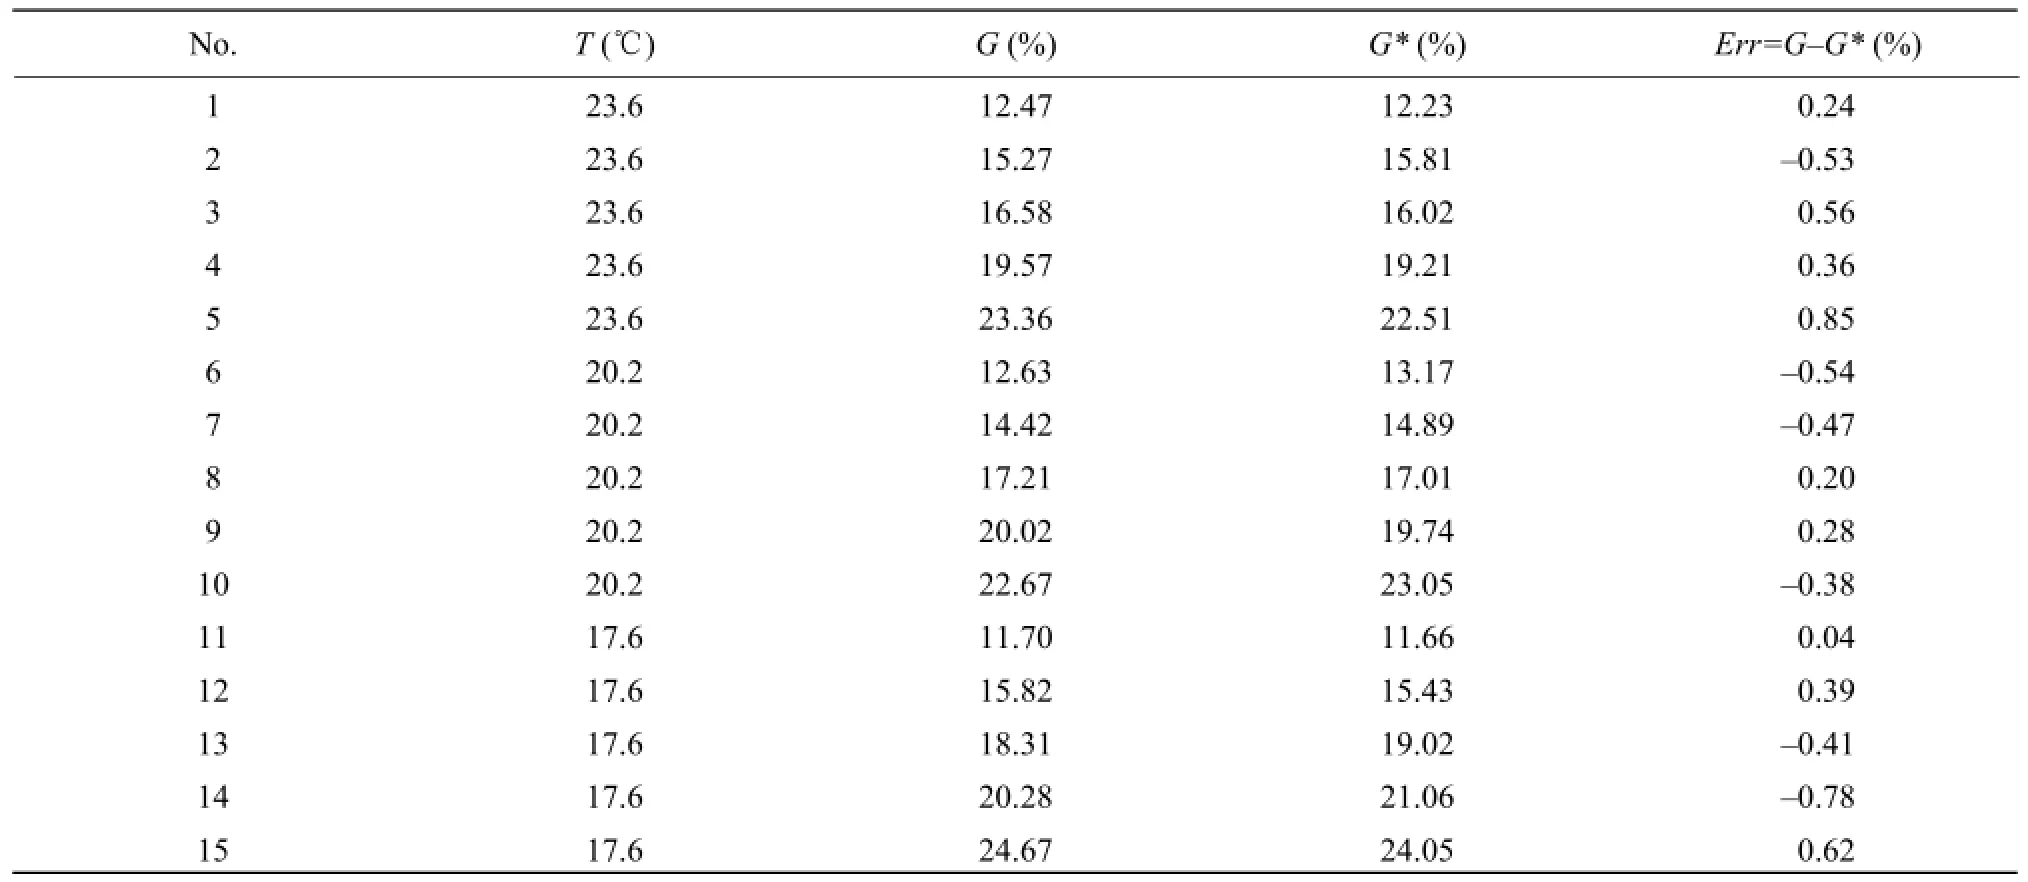
Table 3 Comparison between observed values and actual values of moisture content
Method based on error compensation
There are two forms of water in rice, crystalliferous water and free water. The crystalliferous water is the natural formation in the rice's growth process, which exists in the cells and does not participate in conducting the electricity. The free water is the measured object and its activity can be sensitive to temperature, thus causing a fluctuating error with the change in temperature.
It is known that the rice with high moisture content had a lower measurement than its true moisture content when the temperature approached or exceeded 20℃, because the high temperature enhanced the free water's activity and diffusion, especially if the rice was exposed to the air. Moreover, the measurement of the rice with low moisture content had low temperature dependence.
Therefore, Fig. 6 indicated that the curve whose measured temperature was between 17℃ and 24℃was in the area bounded by the two curves at the temperature of 17℃ and 24℃. The two curves can be called as the boundary curves.
Based on the first way and the theory above, the method with error compensation was used to solve the problem of the temperature effects. The frequency was the factor that directly related with rice moisture content, while temperature was not the key factor but can be considered as the environmental factor. The method of error compensation was used to establish the mathematical model in order to calculate the error bands and decrease the measurement error Err (Martinello et al., 2013) .
The test's temperature was from 17℃ to 24℃, so the upper boundary was the curve at the temperature of 17℃ and the lower boundary was the curve at the temperature of 24℃. According to the function (2), the boundary curves' expressions were written as thefollowings:

With the same method, a few experiments have been conducted to derive the relationship between Err and G* at the temperature of 17℃ and 24℃. Two expressions were shown as the followings:

Error was obtained through the observed value of rice moisture content. The difference between Err(T=17℃)and Err(T=24℃), an important expression used to limit the error's range, was named as the error band. With the error band, the error compensation term (ECT) was constructed and used to search the value of error for some measurement of rice moisture content.
As shown in Fig. 6, two curves were drawn to describe the functions about Err and G* (formulas (10) and (11)). A vertical line segment which connected with the two curves was drawn and divided into seven equal parts because of the temperature range (from 17℃ to 24℃) (Perez et al., 2012). With these seven small segments, the error band was equally distributed to each degree. Hence, the value of error compensation was calculated according to the actual temperature.

Fig. 6 Diagram of relationships between error and rice moisture content at 17℃ and 24℃
The actual temperature (T) guided us to find the offset degree of moisture content and ECT was defined as follows (Kandala and Puppala, 2012):

In the equation above, Err(T=24℃)was selected as the basic error term, (Err(T=17℃)–Err(T=24℃)) was the error band to indicate the error's range, and (24-T)/7 was the error searching coefficient based on temperature.
The final formula to calculate the rice moisture content based on this model was described as the following:

G*(T=24℃), the observed value of rice moisture content at 24℃, was chosen as the basic calculating rice moisture content. And ECT was used to make corrections on the observed value in the light of the error band and the actual temperature.
The formulas were written with the experimental data and the fitting results as the followings:
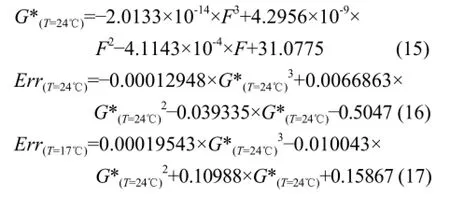
For example, when the actual moisture content equaled to 23.0, the measurement of moisture content equaled to 22.3, the temperature was 22℃, and the calculating process was as the followings:
According to the formula (15),
G*(T=24℃)=22.3.
According to the formula (16),
Err(T=24℃)=0.50728.
According to the formula (17),
Err(T=17℃)=–0.21806.
According to theformula (13),
ECT=0.50728+(–0.21806–0.50728)× (24–22)/7=0.30004.
According to the formula (14),
G*=G*(T=24℃)+ECT=22.3+0.30004=22.60004.
So, the absolute error was:
Err=G–G*=23.0–22.60004=0.39996
Based on the calculating process above, the processof searching for the value of error compensation could be concluded in Fig. 7.
Formula (15) was used to calculate the measurement of rice moisture content at 24℃. Formulas (16) and (17) were used to specify the two edges of error band. With the actual temperature measured by DS18B20, the value of error compensation would be ascertained.
Given the actual condition, the next step was to enlarge the temperature's range in order to enable this method meet the most requirements. But this method, a new thought that gives us a view to consider the error apart from the result and search for the error value through the result, has proven effectively, especially for the researches of nonlinear system and some other piecewise nonlinear questions.
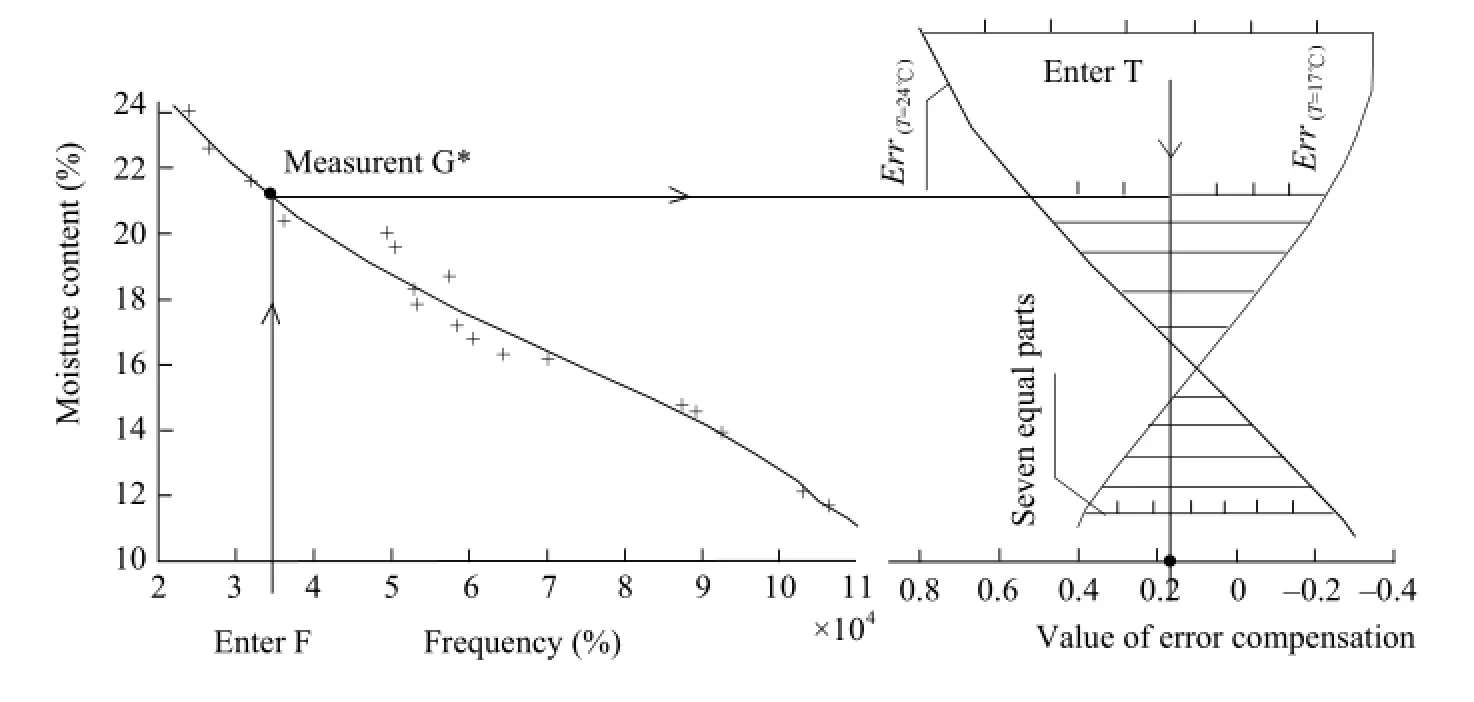
Fig. 7 Process of searching for error compensation value
Discussion
Comparing the traditional method with the method based on error compensation, it is found that the two methods both have advantages and disadvantages.
The first method required a large number of experiments to ensure the correctness of the data used in fitting process. All the results obtained by one function were associated with two factors so that a small change of temperature would cause an evident change of moisture content. But the function which described the relation among rice moisture content, frequency and temperature could be obtained easily with the traditional method.
The second method's advantage lied in that it assigned different importance to the two factors so that different appropriate approaches were taken to get the relationship between moisture content and frequency, and the relationship between moisture content and temperature. But the second method had the possibility to enlarge the error due to fitting data three times (Demir and Kursat, 2013).
Conclusions
(1) In this paper, a new method has been proposed to structure the error compensation term ECT in order to further improve the detective technology for rice moisture content. The factors in measurement were analyzed, and the error caused by temperature was discussed. This model of detector could work rapidly and automatically, with the error of moisture content detection less than 1%.
(2) Two methods of structuring the mathematical model have been also provided in this research. If the sensors with other structures were applied, it is necessary to consider more about the factors thatcould affect the models. However, applying the idea described above allowed the users to follow an effective way.
(3) This paper did not relate to the section of structure designing, but the reliable structure that allowed the machine to run normally and have longer life should also be further considered in the real production.
Cai L M, Kong L. 2009. Mathematical model of cylindrical capacitance grain moisture sensor and analysis of influential factors. Analytical Instrumentation, 1: 49-52.
Demir Y, Kursat S. 2013. Evaluation of mathematical models for flexible job-shop scheduling problems. Applied Mathematical Modelling, 37(3): 977-988.
Dusan S. 2012. Pulse modulated power supply for the microwave oscillator. 2012 20th Telecommunications forum. Belgrade, Serbia. pp. 1744-1746.
Frank R G, Maurice D W, William P F. 2003. A first course in mathematical modeling. China Machine Press: Thomson Asia Pte, Beijing. pp. 123-145.
Geng D Q, Zhao Z, Fang Z, et al. 2010. Sensor for measurement of grain moisture content online. Instrument Technique and Sensor, 1: 9-10, 13.
Jack C. 2010. Embedded hardware: know it all. Publishing House of Electronics Inc., Beijing. pp. 274-305.
Kandala C V, Puppala N. 2012. Capacitance sensors for nondestructive moisture determination in grain, nuts and bio-fuel materials. 2012 6th international conference on sensing technology, ICST 2012, Kolkata, India. pp. 42-45.
Khairetdinova A F, Saitov R I, Abdeev R G. 2011. Instrument for monitoring the moisture content of wheat grain in the production process of drying. Measurement Techniques, 54(3): 356-360.
Lee Y, Kim H, Park Y. 2013. Improved multi-precision squaring for low-end RISC microcontrollers. Journal of Systems and Software, 86(1): 60-71.
Liu Z Z, Wang N, Wang Y B. 2012. Digital capacitance sensor for grain moisture content measurement. American society of a gricultural and biological engineers annual international meeting. Dallas, TX, United States. pp. 6266-6272.
Ma C. 2007. AVR micro-controller embedded system principles and practices. Beijing University of Aeronautics and Astronautics Press, Beijing. pp. 322-337.
Martinello M A, Munoz D J, Giner S A. 2013. Mathematical modelling of low temperature drying of maize: comparison of numerical methods for solving the differential equations. Biosystems Engineering, 114(2): 187-194.
Perez J H, Tanaka F, Uchino T. 2012. Modeling of mass transfer and initiation of hygroscopically induced cracks in rice grains in a thermally controlled soaking condition: with dependency of diffusion coefficient to moisture content and temperature - a 3D finite element approach. Journal of Food Engineering, 111(3): 519-527.
Stormy A. 2013. MATLAB: a practical introduction to programming and problem solving. Elsevier (Singapore) Pte Ltd., Singpore. pp. 234-258.
Teng Z S, Ning L W, Zhang H X, et al. 2004. On-line measurement system of grain dryer for monitoring moisture content. Transactions of the Chinese Society of Agricultural Engineering, 5: 24-27.
Tong Z M, Rong L H, Huang C J. 2013. Grain moisture content measurement system based on time-domain transmission technology. Applied Mechanics and Materials, 241-244: 214-217.
Wu S. 2010. Mathematical analysis. Peking University Press, Beijing. pp. 132-151.
Yang L, Mao Z H, Dong L L. 2010. Development of plane polar probe of capacitive grain moisture sensor. Transactions of the Chinese Society of Agricultural Engineering, 26(2): 185-189.
Zhao H, Huang K, Chen K. 2005. Design principles of mechanical systems. Higher Education Press, Beijing. pp. 25-42.
Zhao W Y, Yang S M, Yang Q. 2007. The development and thinking of the precision agriculture technology. Journal of Agriculture Mechanization Research, 4: 167-170.
S24; TH89
A
1006-8104(2014)-03-0076-08
Received 29 December 2013
Supported by the National Natural Science Foundation of China (51275145)
Dong Yu-de (1966-), male, Ph. D, professor, engaged in the research of agricultural detection technology, CAD/CAE/PDM and MIS. E-mail: dydjiaoshou@126.com
杂志排行
Journal of Northeast Agricultural University(English Edition)的其它文章
- Effect of Seed Soaking with Exogenous Proline on Seed Germination of Rice Under Salt Stress
- Physiological Changes and Cold Tolerance of Three Camphor Species During Natural Winter Temperature Fluctuations
- Effects of Methylated Soybean Oil Adjuvant on Fomesafen Efficacy to Weeds
- Method for Isolating Mitochondrial DNA from Etiolated Tissue of Cabbage
- Lentivirus Mediated Gene Manipulation in Trophectoderm of Porcine Embryos
- Effects of Allicin on Lipid Metabolism and Antioxidant Activity in Chickens
