Physiological Changes and Cold Tolerance of Three Camphor Species During Natural Winter Temperature Fluctuations
2014-03-07WangNingYuanMeiliandYaoFang
Wang Ning, Yuan Mei-li, and Yao Fang
1College of Forestry, Henan University of Science and Technology, Luoyang 471002, Henan, China
2The Sui & Tang Dynasties Relics Botanic Garden of Luoyang, Luoyang 471002, Henan, China
3Henan Vocational College of Forestry, Luoyang 471000, Henan, China
Physiological Changes and Cold Tolerance of Three Camphor Species During Natural Winter Temperature Fluctuations
Wang Ning1, Yuan Mei-li2, and Yao Fang3
1College of Forestry, Henan University of Science and Technology, Luoyang 471002, Henan, China
2The Sui & Tang Dynasties Relics Botanic Garden of Luoyang, Luoyang 471002, Henan, China
3Henan Vocational College of Forestry, Luoyang 471000, Henan, China
The dynamic changes in the malondialdehyde (MDA), superoxide dismutase (SOD), soluble sugar, proline, and soluble protein contents, as well as the relative electrolyte conductivity and the corresponding cold resistance, of Cinnamomum bodinieri Level., C. camphora L., and C. caudiferum Kisterm were investigated during the winter months of October 2009 to April 2010. During the short period of temperature decline that lasted until mid-December, the changes in the relative electrolyte conductivity and MDA content with temperature were insignificant. In January, SOD activity continued to increase and then peaked as a result of rapid increases in soluble sugar, proline, soluble protein, as well as the inhibition of the relative electrolyte conductivity and decrease in MDA content. These physiological changes protected the camphor trees from cold damage during winter. From February to March, SOD activity and the soluble protein and proline contents increased with the increase in temperature. However, the relative electrolyte conductivity and MDA content decreased, indicating that the cell membrane damaged by low temperature was gradually being repaired. The cold dip in April led to slight increases in the relative electrolyte conductivity and MDA content. Using a fuzzy mathematics method, the cold resistance adaptability of the camphor trees was divided into three periods namely, the enhancement setting stage, the vigorous stage, and the reducing stage. The cold tolerance abilities were ranked as the following order: C. bodinieri Level>C. camphora L.>C. caudiferum Kisterm.
camphor tree, cold resistance, natural temperature reduction, fuzzy synthetic evaluation
Introduction
Low temperature is one of the primary environmental stresses that limit the northern boundary of plants (Stushnoff and Junttila, 1986). However, a number of species have been successfully grown in the north part of their natural range. Loblolly pines have been planted over 100 miles west and north of their natural range with good success during the past few decades (Parker, 1950). Despite the evidence against a relationship between the natural range of trees and their apparent physiological range, a significant amount of data shows that cold (low-temperature extremes) can directly affect the range of forest trees (Jenny et al., 2005). Damage can occur in any seasons, and frosts commonly occur in summer in some forested locations. However, in temperate climate, damage occurs most commonly in autumn and spring, during which spring frosts are the more serious (Parker, 1963). Although earlier studies on plant cold resistance considered the spring (Janowik and Dorffling, 2003), autumn, (Markovskayaet al., 2003; Stavang et al., 2008) and winter injuries (Zhou and Zhao, 2004), comprehensive studies on the interconnection of three separate cold resistance processes are scarce. Such a division may be artificial because sometimes the damage incurred in autumn remains and is added to all through winter till spring (Leng and Qi, 2003; Tomasz and Orville, 1996).
Camphor trees are one of the most characteristic evergreen species in China. With the gradual warming of the global climate, the introduction of evergreen species has become increasingly popular. In the current study, experiments were conducted on Cinnamomum bodinieri Level, C. camphora L., and C. caudiferum Kisterm to investigate the changes in the superoxide dismutase (SOD) activity as well as in the contents of malondiadehyde (MDA), soluble sugar, soluble protein, and proline. The changes in the relative electrical conductivity during the natural drop in temperature were also determined. The objective of these experiments was to explore the physiological and biochemical responses of camphor trees that reflect the dynamic changes of cold resistance under the natural temperature reduction during winter.
Materials and Methods
Study site and experimental design
An 8-year-old street tree in Shangjie district (34°35′N, 113°14′E), located in Zhengzhou, Henan Province in central China (Fig. 1), was analyzed. The site is characterized by a warm to temperate continental monsoon climate, with an average annual temperature of 13.5℃and a minimum winter temperature of −16.5 ℃.

Fig. 1 Map of central China showing location of study field within central of Henan Province and distribution of soil sampling sites within soil map
The marked decline in temperature in the fall of 2009 (October 30) was chosen as the starting time point of the experimental period, and the time when the temperature was stable in the spring of 2010 was chosen as the end date (April 16); the entire period lasted 169 days. The daily maximum and minimum temperatures were recorded and shown in Fig. 2. Given the irregular change in the temperature, the sampling time during the day was not fixed; sampling was usually done at least once a month in sunny days after significant cooling. The first batch of the 11 samples was taken collected on November 3; the sampling date and daily maximum and minimum temperatures are listed in Table 1. Blade samples (30 per tree species) were randomly selected from the current year shoot in the middle and upper parts of a crown. A part of the blade sample was immediately taken to determine the relative electrolyte conductivity after successive washing with tap water and distilled water, whereas the remaining leaves were placed in anultra-low-temperature freezer prior to determination of other physiological indicators. C. bodinieri Level, C. camphora L., and C. caudiferum Kisterm were labeled as I, II, and III, respectively.

Fig. 2 The highest and the lowest day temperature of Zhengzhou City from Oct. 30, 2009 to Apr. 16, 2010

Table 1 The highest and the lowest day temperatures of sampling date
SOD activity measurement
Leaves (0.5 g) were ground in a mortar and pestle and added to 5 mL of 50 mmol • L-1phosphate buffer (pH 7.8) at 4℃. The homogenate was centrifuged at 13 000×g for 15 min. The supernatant fluid was collected for the determination of SOD activities (Zhou et al., 2005). To determine SOD activities, 3 mL reaction solution containing 13 μmol • L-1methionine, 63 μmol • L-1ρ-nitro blue tetrazolium chloride (NBT), 1.3 μmol• L-1riboflavin, 50 mmol • L-1phosphate buffer (pH 7.8), and 50 μL of the supernatant fluid was incubated for 10 min under fluorescent light (80 μmol • m-2• s-1). The absorbance was measured at 560 nm using a spectrophotometer (752 models, Shanghai Jinghua Technology Equipment Co., Ltd., China). One unit of SOD activity was defined as the amount of the enzymes required for the inhibition of the photochemical reduction of NBT by 50%.
MDA measurement
The samples for MDA and enzyme analyses were prepared through homogenization of the fresh tissues with a mortar and pestle, and a small amount of sand in a solution (4 mL • g-1fresh weight) containing 50 mmol • L-1KH2PO4/K2HPO4(pH 7.8), 1% polyvinylpyrrolidine (PVP), 0.2 mmol • L-1EDTA, and 1% Triton X-100. After the homogenate was centrifugedat 12 000×g for 20 min at 4℃, the supernate was analyzed for enzymatic activities (Cho and Park, 2000). All spectrophotometric analyses were conducted on a UV-vis recording spectrophotometer (UV-160A, Shimadzu, Japan). MDA content was measured using the thiobarbituric acid reaction as described by Heath and Packer (1968). MDA concentration was calculated based on A532−A600(ε=155 mmol • L-1• cm-1).
Soluble sugar, proline, and soluble protein content measurements
The proline, soluble sugar, and soluble protein contents were measured using the method of Li (2000).
Determination of relative electrical conductivity
The sliced leaf (5 g) was soaked in 40 mL deionized water for 1 min. The conductance (E0) was measured on a DDS-307 conductivity meter (Shanghai Precision Scientific Instrument Co., Ltd., China). The first conductance (E1) was measured after 12 h. The second conductance (E2) was measured after the sample was boiled in deionized water for 30 min followed by being soaked in 40 mL of deionized water for 12 h. The relative electrical conductivity (REC) was calculated as the following (Zhou, 2000):
REC=(E1−E0)/(E2−E0)×100%
Fuzzy synthetic evaluation
The following equations from the fuzzy mathematics method were used:
(1) The positive correlation with cold resistance, such as SOD, proline, soluble sugar, and soluble protein content, was calculated as the following:

Where, f(Xij) was the membership degree of I tree species of the j-item, and f(Xij)∈[0, 1]; Xijwas the measured value of I tree species of the j-item; and Xjmax and Xjmin were the minimum and maximum values of the j-item, respectively.
(2) The negative correlation with cold resistance, such as MDA content and the relative electrical conductivity, was calculated as the following:

Statistical analysis
Values were presented as the mean±standard deviation of the three replicates. Statistical analyses were performed via ANOVA using DPS software. Duncan's multiple range test was used to compare the results among treatments.
Results
Relative electrolyte conductivity
From November, 2009 to January, 2010, the change in REC with the temperature during the shorter cold duration was not significant (Table 2).
In January, the relative electrolyte conductivity continuously increased under the sustained low temperature. The peak did not occur at the lowest temperature, possibly because of the accumulation of protective enzymes and osmoregulatory substances. From February to March, the relative electrolyte conductivity significantly decreased with the increasing temperature, indicating that the low temperature-induced damage on the cell membranes was gradually healing. The cold dip in April again led to slight increases in the relative electrolyte conductivity.
MDA
The change in MDA content was similar to that of the relative electrolyte conductivity during the natural lowering of the temperature, with its peak appearing at the same time as that of the relative electrolyte conductivity (Table 3). The cold dip in April also led to an increase in MDA content. MDA content of I species significantly increased (P<0.05).
SOD activity
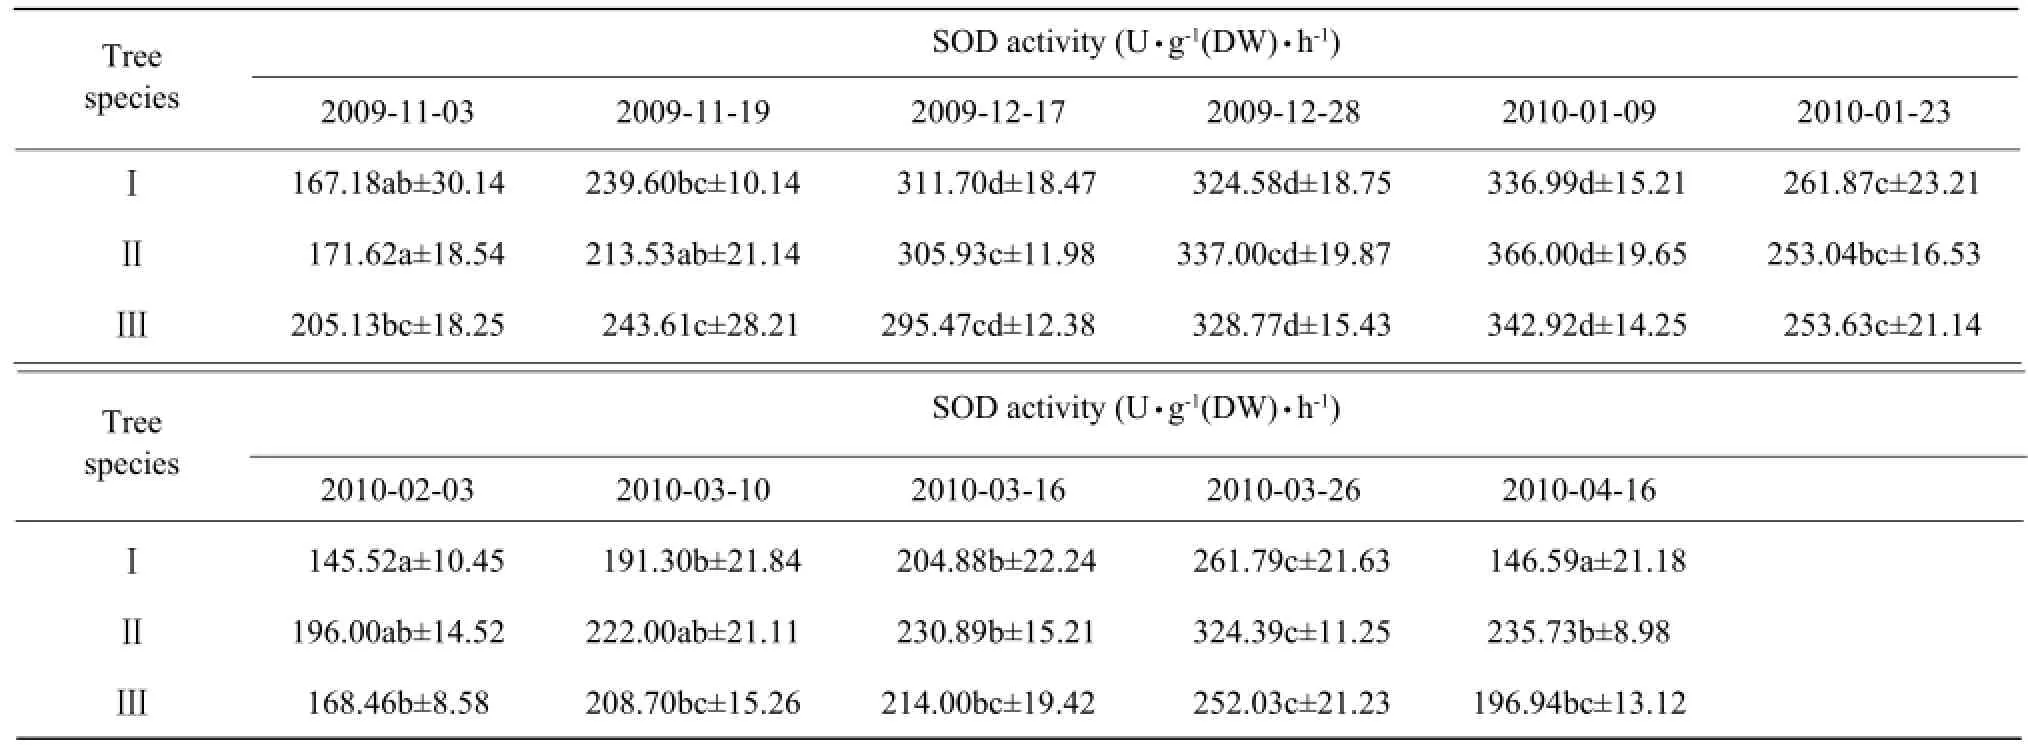
SOD activity continuously increased during the sustained low-temperature stress, and its peak appearing in January enhanced the cold tolerance of the camphor trees in winter (Table 4). The activity later decreased,possibly because of excessive low-temperature stress. In March, SOD activity was gradually restored as the temperature rose, but the cold dip in April led to a slight decrease.

Table 2 Effects of natural temperature drop on relative electrolyte conductivity in leaves of camphor trees

Table 3 Effects of natural temperature drop on MDA content in leaves of three species of camphor trees
Soluble protein
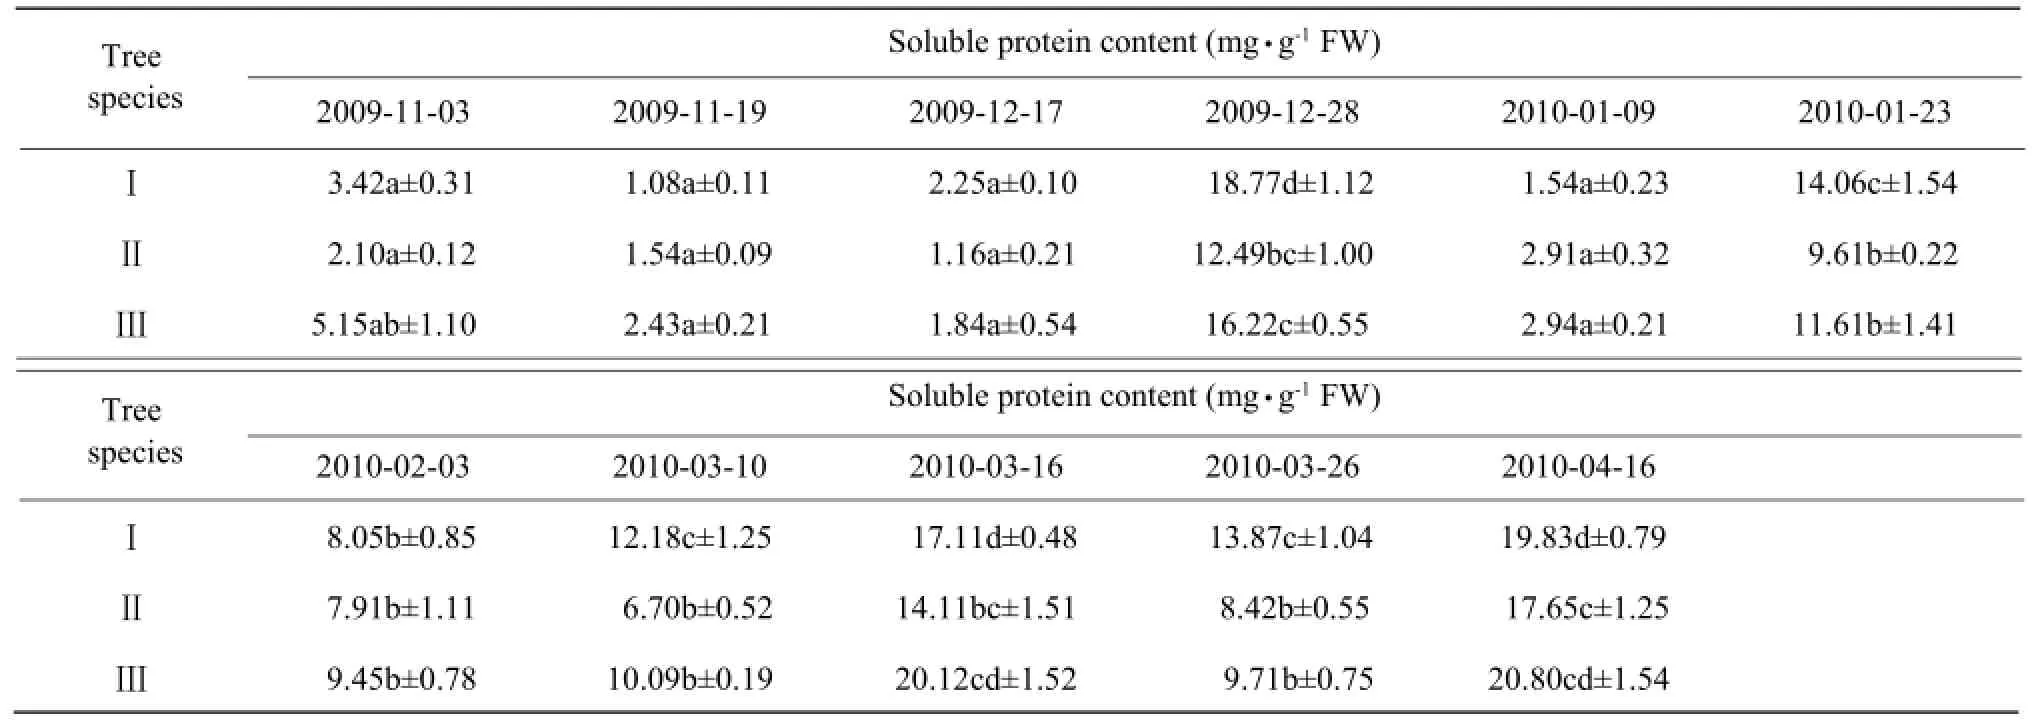
The soluble protein content showed no obvious change before mid-December, possibly reflecting the short cold duration (Table 5). However, the content showed a sharp increase and peaked on December 28, then sharply decreased from January 5 to 8, when temperature at −8℃. The soluble protein content appeared at significantly higher or lower levels, except for II species.
Soluble sugar
The first peak of the soluble sugar content of I species appeared on November 19, but those of II and III species appeared on December 17, followed by a slight decrease.
The second peak of the soluble sugar content appearing increased again in January (Table 6). This increase enhanced the cold resistance of the camphor trees in winter.

Table 4 Effects of natural temperature drop on SOD activity in leaves of camphor trees

Table 5 Effects of natural temperature drop on soluble protein content in leaves of camphor trees

Table 6 Effects of natural temperature drop on soluble sugar content in leaves of camphor trees
Proline content
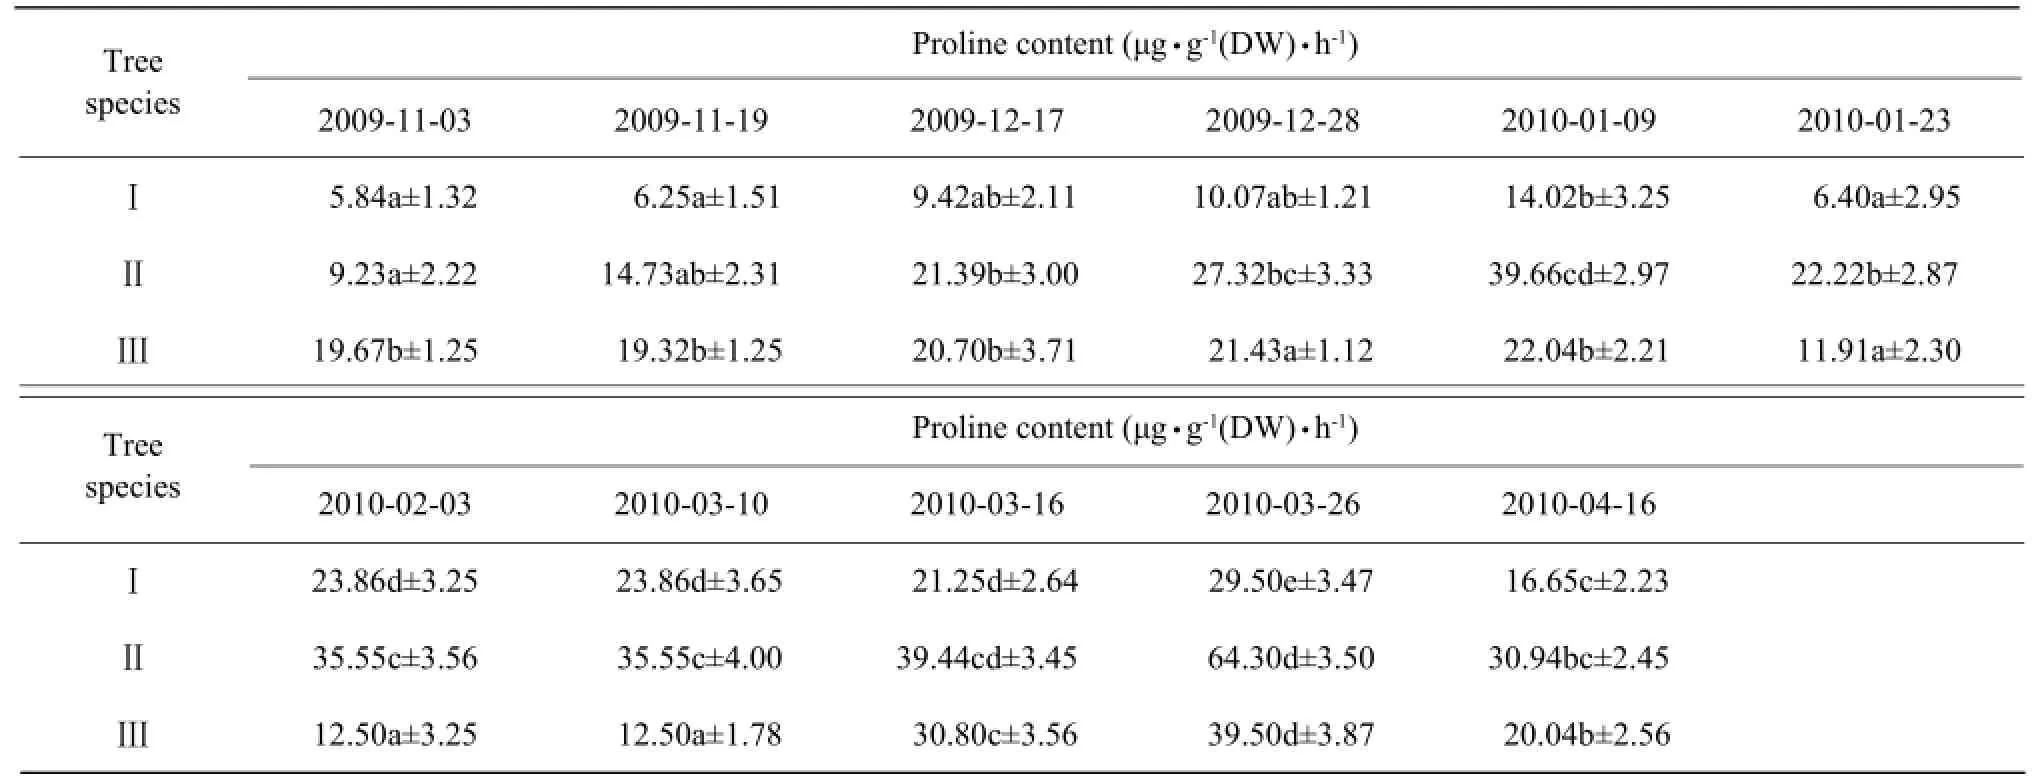
The proline content progressively increased until January 9, resulting in enhanced resistance to the lowest temperature stress, and then decreased. The proline content gradually increased as the temperature rose in February, but showed a slight decrease during the cold dip in April (Table 7).

Table 7 Effects of natural temperature drop on proline content in leaves of camphor trees
Membership values of cold resistance indicators
Taking C. camphora L. as an example, the comprehensive evaluation value obtained using the fuzzy mathematics method showed a "rise-fall-rise-fall" trend (Table 8), indicating that the cold resistance of camphor trees was improved and then declined with the natural drop in temperature. Therefore, the cold resistance adaptability of the camphor trees was divided into three periods, as the followings: (1) enhancement stage, (2) vigorous stage, and (3) reducing stage. At the first stage, the cold tolerance of the camphor trees was enhanced by the accumulation of protective enzymes and osmoregulatory substances from November to December. At the second stage, SOD activity, the soluble protein and proline contents gradually increased with the increase in temperature from February to March, indicating that the low temperature-induced damage on the cell membranes was gradually healing, leading to the gradual restoration of the cold resistance. In addition, the cold resistance peaked in January after the cold hardening in autumn, which ensured the safety of the camphor trees in winter. At the third stage, the cold resistance decreased after the excessive cold stress from January to February. Another decline was again observed, during the cold dip from late March to April.
Synthetic evaluation of cold tolerance
The cold resistance of the camphor trees during the natural drop in the temperature was as a result of several factors, and thus, appropriate evaluation indices and methods must be used. The cold resistance of C. bodinieri Level, C. camphora L., and C. caudiferum Kisterm was evaluated using the fuzzy mathematics method. Using equations (1) and (2), the subordinate function values of each index were calculated and multiplied with its weight; the average was the comprehensive evaluation value (Table 9). Therefore, the cold resistance of the three camphor tree species were ranked as the order of II>III>I.

Table 8 Membership values of cold resistance indicator under natural temperature reduction

Table 9 Integrated evaluation of cold resistance character of camphor trees
Discussion
Under low-temperature stress, plants suffer from oxidative injury caused by the active oxygen species (AOS) (Elstner, 1982; Cardona et al., 1997). Plants are equipped with antioxidant systems composed of low-molecular weight antioxidants and enzymes that protect the cell from the damaging effects of AOS (Alscher and Donahue, 1997). SOD is an enzyme that catalyzes the dismutation of superoxide into hydrogen peroxide and molecular oxygen. Under low-temperature stress, the high SOD activity is very important in enhancing the cold resistance (Liu et al., 2012). In Jatropha curcas seedlings, SOD can enhance the tolerance to freezing stress (Ao et al., 2013). Enzymatic activity generally becomes stronger as the stress increases, or increases at the beginning and then decreases by the end of the stress treatment (Bowler et al., 1992; Miyake and Yakota, 2000; Ying et al., 2011). In the present study, SOD activity of the camphor trees increased to resist the low-temperature stress, and its peak appearing in January was beneficial to the safety of the camphor trees during winter. However, the decrease that later occurred might be related to excessive low-temperature stress.
When plants are exposed to low-temperatures, AOS, such as superoxide, hydrogen peroxide, hydroxyl radicals, and singlet oxygen accumulates in vivo can lead to lipid peroxidation (Wise and Naylor, 1987; Hariyadi, 1993). MDA, the final product of lipid peroxidation, can induce protein intercrossing and conjugation, which seriously destroys the lipid structures and functions and disrupts normal metabolism. MDA is often used as an index of the cell oxidative damage under an environmental stress (Pan et al., 2002; Gao et al., 2003). When plants suffer from low-temperature, the cell membrane permeabilityincreases and some electrolytes leak into the cells. Thus, the degree of cellular injury can be determined by the amount of electrolyte leakage (Lyons, 1973). The relative electrolyte conductivity and MDA content of the three camphor tree species have shown similar changes; their peak did not appear at the lowest temperature from January 5 to January 8, possibly due to the accumulation of protective enzymes and osmoregulatory substances. These results indicated that the camphor trees were not subjected to cold damage during this period.
The cold tolerance of the plants was enhanced with the accumulation of osmoregulatory substances under low-temperature stress (Wang et al., 2010). The soluble sugar, soluble protein, and proline contents of the camphor trees increased to resist the lowest temperature stress in January. Earlier studies have reported that the soluble sugar of a plant increased in autumn, but decreased in spring (Katao et al., 2004). These results were consistent with those of the present study.
Taking C. camphora L. as an example, the cold tolerance adaptability of the camphor trees was divided into three periods, namely, the enhancement, vigorous, and reducing stage, based on the fuzzy mathematics method. The cold tolerance was gradually enhanced in autumn before the lowest temperature was reached, which ensured the survival of the camphor trees in winter; however, the tolerance later decreased, possibly because of the excessive cold stress.
According to Li et al. (2009), the cold tolerance of a plant is the genetic expression of the comprehensive function between its physiological and biochemical characteristics. When plants experience low-temperature, plant growth, as well as the physiological and biochemical characteristics, exhibits different variations. Hence, the old resistance of the plant cannot be correctly determined using a single index. By using the fuzzy mathematics method, the membrane permeability, osmoregulatory substance, and enzymatic activity data were collected, and an integrated analysis of the plant cold tolerance was conducted.
Conclusions
From the results, the camphor trees adapted to lowtemperature stress by changing the content of the osmoregulatory substance and by strengthening the enzymatic activity. By using a fuzzy mathematics method, the cold resistance adaptability of the camphor trees was divided into three periods namely, the enhancement setting stage, the vigorous stage, and the reducing stage. The cold tolerance abilities were ranked as the following order: C. bodinieri Level>C. camphora L.>C. caudiferum Kisterm.
Alscher R G, Donahue J L. 1997. Reactive oxygen species and antioxidants: relationships in green cells. Physiol Plantarum, 100: 224-233.
Ao P X, Li Z G, Fan D M, et al. 2013. Involvement of antioxidant defense system in chill hardening-induced chilling tolerance in Jatropha curcas seedlings. Acta Physiologiae Plantarum, 35(1): 153-160.
Bowler C, Van Montagu M, Inze D. 1992. Superoxide dismutase and stress tolerance. Ann Rev Plant Physiol Plant Mol Biol, 43: 83-116.
Cardona C A, Duncan R R, Lindstrom O. 1997. Low temperature tolerance assessment in paspalum. Crop Sci, 37: 1283-1291.
Cho U H, Park J O. 2000. Mercury-induced oxidative stress in tomato seedlings. Plant Sci, 156: 1-9.
Elstner E F. 1982. Oxygen activation and oxygen toxicity. Ann Rev Plant Physiol, 33: 73-96.
Gao S M, Chen P J, Guo H H, et al. 2003. Study on cold acclimation and freezing-tolerance mechanism of Aucuba japonica cv. Variegata. Acta Bot Boreal-Occidenta Sin, 23(12): 2113-2119.
Hariyadi P. 1993. Chilling-induced oxidative stress in cucumber (Cucumis sativus L.cv. Calypso) seedlings. Plants Physiol, 141: 733-738.
Janowik F E, Dorffling K. 2003. Chilling tolerance of maize seedlings in the field during cold periods in spring is related to chilling-induced increase in abscisic acid level. J Agron Crop Sci, 189: 156-161.
Jenny R, Lucien H, Jean-Francois H. 2005. Biochemical and physiological mechanisms related to cold acclimation and enhanced freezing tolerance in polar plantlets. Physiologic Plantarum, 125:82-94.
Kataoka K, Sumitomo K, Fudano T, et al. 2004. Changes in sugar content of Phalaenopsis leaves before floral transition. Sciential Horticulture, 102: 121-132.
Leng P, Qi J X. 2003. Effect of anthocyanin on David peach (Prunus davidiana Franch) under low temperature stress. Scientia Horticulturae, 97: 27-39.
Li H S. 2000. Principles of plant physiology and biochemistry and technology experiment. Higher Education Press, Beijing.
Li Y B, Yang S Q, Ren G X, et al. 2009. Changes analysis in physiological properties of several gramineous grass species and coldresistance comparison on under cold stress. Acta Ecologica Siniea, 29(3): 1341-1347.
Liu X D, Ren W J, He M. 2012.Cold resistance of Rosa rugosa 'kushui' and Rosa rugosa 'lengxiang'. Journal of Northeast Forestry University, 40(11): 28-30.
Lyons J M. 1973. Chilling injury in plants. Ann Rev Plant Physio1, 24: 445-466.
Markovskaya E F, Sherudilo E G, Sysoyeva M I. 2003. Influence of long-term and short-term drops on acclimation and deacclimation in cucumber cold resistance. Acta Hortic, 618: 233-236.
Miyake C, Yakota A. 2000. Determination of the rate of photoreduction of O2in the water-water cycle in water melon leaves and enhancement of the rate by the limitation of photosynthesis. Plant Cell Physiol, 4: 335-343.
Pan X Y, Cao Q D, Wang G X. 2002. Evaluation of lipid peroxidation for use in selection of cold hardiness cultivars of almond. Acta Ecologica Sinica, 22(11): 1902-1911.
Parker J. 1950. Planting loblolly pine outside its natural range. Jour For, 48: 278-279.
Parker J S. 1963. Cold resistance in woody plants. The Botanical Review, 2: 123-201.
Stavang J A, Hansen M, Olsen J E. 2008. Short term temperature drops do not enhance cold tolerance. Plant Growth Regul, 55: 199-206.
Stushnoff C, Junttila O. 1986. Seasonal development of cold stress resistance in several plant species at a coastal and a continental location in North Norway. Polar Biology, l5: 129-133.
Tomasz A, Orville M L. 1996. Seasonal changes in cold hardiness of Rhododendron L. catwbiense boursault, grown under continuous and periodic water stress. J Amer Soc Hort Sci, 121: 301-306.
Wang J, Liao K, Wang Y L, et al. 2010. Effects of natural temperature drop on osmosis substances in leaves of wild cherry plum. Xinjiang Agricultural Sciences, 47(5): 952-957.
Wise R R, Naylor A W. 1987. Chilling enhanced photooxidation. Plant Physiol, 83: 278-282.
Ying Y Q, Wei J F, Xie N N, et al. 2011. Effects of natural low temperature stress on physiological and biochemical properties of Phyllostachys edulis. Journal of Nanjing Forestry University (Natural Science Edition), 35(3): 133-136.
Zhou B, Guo Z, Xing J, et al. 2005. Nitric oxide is involved in abscisic acid-induced antioxidant activities in Stylosanthes guianensis. J Exp Bot, 56: 3223-3228.
Zhou R L, Zhao H L. 2004. Cryo-protectant changes in roots of perennial grasses habituated in alpine area in spring related to dehardening. Acta Botanica Boreali-Occidentalia Sinica, 24(2), 199-204.
Zou Q. 2000. The guidance of plant physiological and biochemical. Higher Education Press, Beijing.
S722.7
A
1006-8104(2014)-03-0007-10
Received 7 March 2014
Supported by Youth Science Foundation from Henan University of Science and Technology (2013)
Wang Ning (1979-), male. Ph. D, engaged in the research of cold-resistance in landscape-plants. E-mail: hnkjdxwangning2013@163.com
杂志排行
Journal of Northeast Agricultural University(English Edition)的其它文章
- Effect of Seed Soaking with Exogenous Proline on Seed Germination of Rice Under Salt Stress
- Effects of Methylated Soybean Oil Adjuvant on Fomesafen Efficacy to Weeds
- Method for Isolating Mitochondrial DNA from Etiolated Tissue of Cabbage
- Lentivirus Mediated Gene Manipulation in Trophectoderm of Porcine Embryos
- Effects of Allicin on Lipid Metabolism and Antioxidant Activity in Chickens
- Design and Implementation of Stud-farm Daily Management System Based on C/S Structure
