鄱阳湖湿地两种优势植物叶片C、N、P动态特征
2013-12-09郑艳明胡斌华胡启武
郑艳明, 尧 波,吴 琴,胡斌华, 胡启武,*
(1. 江西师范大学鄱阳湖湿地与流域研究教育部重点实验室, 南昌 330022; 2. 江西鄱阳湖南矶湿地国家级自然保护区管理局, 南昌 330038)
鄱阳湖湿地两种优势植物叶片C、N、P动态特征
郑艳明1, 尧 波1,吴 琴1,胡斌华2, 胡启武1,*
(1. 江西师范大学鄱阳湖湿地与流域研究教育部重点实验室, 南昌 330022; 2. 江西鄱阳湖南矶湿地国家级自然保护区管理局, 南昌 330038)
2011年2—6月在鄱阳湖南矶湿地国家级自然保护区逐月测定了灰化苔草(Carexcinerascens)、南荻(Triarrhenalutarioriparia)叶片C、N、P含量及其地上生物量,以阐明鄱阳湖湿地优势植物C、N、P含量及化学计量比动态特征与控制因子,探讨湿地养分利用与限制状况。结果表明:(1)两种优势植物叶有机碳含量变化范围分别为365.3—386.6 mg/g和352.6—393.2 mg/g,平均值(±标准差)分别为(375.5±17.4) mg/g和(371.7±12.5) mg/g;叶N含量分别为6.96—17.59 mg/g和5.50—20.68 mg/g,平均值分别为(11.35±1.40) mg/g和(11.54±0.84) mg/g;叶P含量变化范围为0.65—2.14 mg/g和0.57—2.25 mg/g,平均含量为(1.56±0.69) mg/g和(1.55±0.68) mg/g。两种植物C∶N、C∶P、N∶P平均值分别为44.00、1068.46、21.30和47.90、1059.92、21.19,C、N、P及其化学计量比种间差异不显著(Pgt;0.05)。(2)气温与地上生物量是N、P及其化学计量比季节变化的主要控制因子,气温和生物量对两种优势植物叶片氮、磷含量的影响要高于对叶有机碳含量的影响。(3)植物C∶N、C∶P与地上生物量变化趋势基本一致,显示N、P养分利用效率随植物的快速生长而提高;根据两种优势植物及土壤N、P含量与化学计量比来判断,研究区植物更多地受氮限制。
鄱阳湖;湿地;化学计量比;养分限制
C、N、P是植物的基本营养元素,在植物生长、发育、行为调节中起着重要作用,并且彼此密切相关。生态化学计量学为探索C、N、P等元素的生物地球化学循环和生态学过程提供了一种新思路,因而受到国内外众多学者的广泛关注[1- 4]。近年来生态化学计量学研究多集中于化学计量比的空间分布格局以及个体、种群、群落、生态系统动态变化与化学计量比的联系[2]。此外,亦有不少学者关注化学计量比对气候变化的响应[5- 7]。多数研究结果均表明化学计量比在不同组织尺度上具有内稳性的特征[8- 11],并且化学计量内稳性通过调节生物与环境之间的关系,成为生态系统结构、功能和稳定性维持的重要机理,内稳性高的物种具有较高的优势度和稳定性,而内稳性高的生态系统具有较高的生产力和稳定性[12]。国内生态化学计量学虽起步较晚,但发展迅速。先后有学者从全国[13- 16]、区域[11,17- 20]以及局地尺度[21- 23]研究了不同生态系统类型植物叶片的化学计量学特征。但这些研究多集中于探讨化学计量比的空间格局,化学计量比随时间变化的信息则极为缺乏。目前仍不清楚化学计量比基于空间的分布规律是否随时间发生变化[3, 24]。此外,化学计量学研究主要集中于森林、草地、荒漠等陆生植被类型,湿地相关研究较为缺乏。湿地处于水陆交界部位,湿地植物的生境条件相对于陆生植物具有更大的波动性,其化学计量学特征以及对环境变化的响应可能有别于陆生植物[25- 26]。因而,加强湿地植物C、N、P及其化学计量比的动态变化研究,一方面可以深入了解植物生长过程中的养分利用状况,另一方面对理解生态系统物质循环过程与元素耦合关系具有重要意义。本研究通过逐月测定生长季两种优势植物叶片C、N、P含量及其地上生物量,以阐明鄱阳湖典型湿地植物C、N、P含量及化学计量比动态变化规律与控制因子,探讨湿地植物的养分限制状况,为进一步揭示鄱阳湖湿地植物对环境变化的响应与适应策略提供数据支持。同时,为理解区域C∶N∶P生态化学计量学格局的趋同与分异提供参考。
1 材料与方法
1.1 研究区概况
实验地设置在鄱阳湖南矶湿地国家级自然保护区内,地理坐标为28°52′05″—29°06′50″ N,116°10′33″—116°25′05″ E。南矶湿地位于鄱阳湖南部,赣江三角洲前沿地带,在南昌市新建县界内,区内除南山岛和矶山岛(乡行政机构所在地,面积仅4 km2)外,其余为洲滩和水域,总面积约330 km2。洲滩淹没时间视当年具体水文情势一般在3—5个月不等。多年平均气温17.6 ℃,平均降水量为1450—1550 mm。
保护区草洲主要以苔草(Carexcinerascens)、南荻(Triarrhenalutarioriparia)群落为主,群落结构相对简单,其中苔草植物群落以灰化苔草为优势种,几乎遍布整个草洲。该类型群落高度一般在40—60 cm,伴生种极少,主要有:水田碎米荠(Cardaminelyrata)、水蓼(Polygonumhydropiper)等。南荻植物群落以南荻为优势种,植株高度为140—160 cm。主要伴生种有:下江委陵菜(Potrntillalimprichtii)、蒌蒿(Artemisiaselengensis)、灰化苔草等,两种植物群落的盖度均超过90%[27]。
1.2 样品采集与分析
采样时间为2011年2—6月(2月份为生长季初期,6月底研究区草洲完全淹没,灰化苔草沉入水底完成一个完整的生长季,挺水植物南荻视分布高程被部分或全部淹没),每月中下旬在苔草和南荻分布的固定样地中(固定样地设置于2009年初,主要用于鄱阳湖典型湿地植物生产力、生物量监测用途,并被随机划分为3个小区,各小区间隔200 m),随机设置3个50 cm × 50 cm生物量调查样方,且每次采样时3个重复随机分布于不同小区中,采用收获法收集样方内地上植物部分,样品带回实验室后80 ℃烘干至恒重,生物量称重后利用四分法随机取其中一部分植物叶片进行粉碎混匀,测定C、N、P含量。其中有机碳含量利用重铬酸钾氧化外加热法,全N含量采用凯氏定氮法,全P含量采取钼锑抗比色法。C、N、P测定结果以单位质量的养分含量表示(mg/g),生物量则以单位面积内的干物质量表示(g/m2),C、N、P化学计量比均采用摩尔比表示。在测定植物样品的同时,利用上述方法对样地土壤样品进行了有机碳、全氮、全磷的测定,文中气温数据来自所在固定样地所设置的气温自动记录仪(HOBO Pro,美国Onset公司,精确度0.1 ℃)。
1.3 数据分析
采用Excel 2003软件进行数据处理及制图;利用SPSS 17.0软件,对两优势物种各月间叶片C、N、P含量进行重复测量方差分析(repeated measures ANOVA),并进一步利用单因素方差分析(One-way ANOVA)中LSD多重比较分析各月份间养分含量的差异;对叶片养分含量与生物量、气温之间进行了相关分析,并基于SPSS中GLM模型分析了温度与生物量及二者交互作用对叶片养分元素的影响。文中显著性水平设定为α=0.05。
2 结果
2.1 灰化苔草、南荻叶片养分元素动态特征
2.1.1 灰化苔草、南荻叶片C、N、P含量动态特征
灰化苔草和南荻两种优势植物叶有机碳含量没有明显的变化模式,经重复测量方差分析显示叶碳含量在各月份间和各物种间均无显著差异(F=2.5; 0.0,Pgt;0.05)。其中,灰化苔草的叶碳含量变化范围为365.3—386.6 mg/g,平均含量为(375.5±17.4) mg/g。南荻的叶碳含量在352.6—393.2 mg/g之间波动,平均含量为(371.7±12.5) mg/g (图1)。
鄱阳湖典型湿地两优势植物的叶氮含量在生长季节内均呈现明显的动态变化模式,表现为生长季初期较高,随着叶片的生长其含量逐渐降低,在5月份植物生长旺盛期达到最低值,随后叶片基本不再生长,叶氮含量又有不同程度的升高(图1)。其中灰化苔草的叶氮含量在6.96—17.59 mg/g之间变化,平均含量为(11.35±1.40) mg/g;南荻叶氮含量变化范围为5.50—20.68 mg/g,平均含量为(11.54±0.84) mg/g。叶氮含量在各月份间有显著差异(F=168.9,Plt;0.01),而在物种间无显著差异(F=0.1,Pgt;0.05)。
与叶片氮含量季节变化模式相似,两种植物叶片P元素含量亦表现为生长初期较高,其中最大含量出现在2月份,之后其含量逐渐降低,到5月份植物生长旺盛期,叶磷含量达到最低值,至6月份叶磷含量又略有增加(图1)。灰化苔草叶片磷含量在生长季节内变化范围为0.65—2.14 mg/g,平均含量为(1.56±0.69) mg/g;南荻叶磷含量变化范围则为0.57—2.25 mg/g,平均含量为(1.55±0.68) mg/g。重复测量方差分析表明,叶磷含量在各月份间呈显著差异(F=25.1,Plt;0.01),而在两物种间无显著差异(F=0.0,Pgt;0.05)。
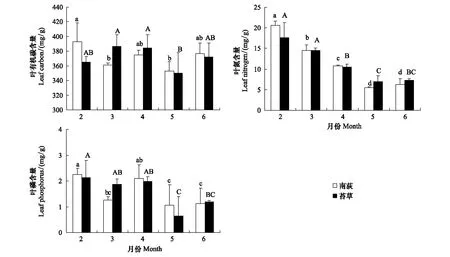
图1 苔草、南荻叶片碳、氮、磷含量的动态特征Fig.1 Dynamics in leaf organic carbon, nitrogen and phosphorus concentration of Carex cinerascens and Triarrhena lutarioriparia图中不同大小写字母表示差异显著
2.1.2 灰化苔草、南荻叶片C/N、C/P及N/P的动态特征
灰化苔草叶片C∶N、C∶P、N∶P变化范围分别为24.86—60.89、472.82—3012.94、11.76—44.63,平均值分别为44.00、1068.46、21.30;南荻叶片C∶N、C∶P、N∶P变化范围分别为22.27—74.86、453.93—2437.38、11.94—31.89,平均值分别为47.90、1059.92、21.19 (图2)。灰化苔草和南荻C、N、P化学计量比值均表现为生长初期较低,最高值出现在5月,在生长季末期其比值都有不同程度降低。两种优势植物生态化学计量比范围虽存在一定的差异,但C∶N、C∶P、N∶P均未达到显著性差异。
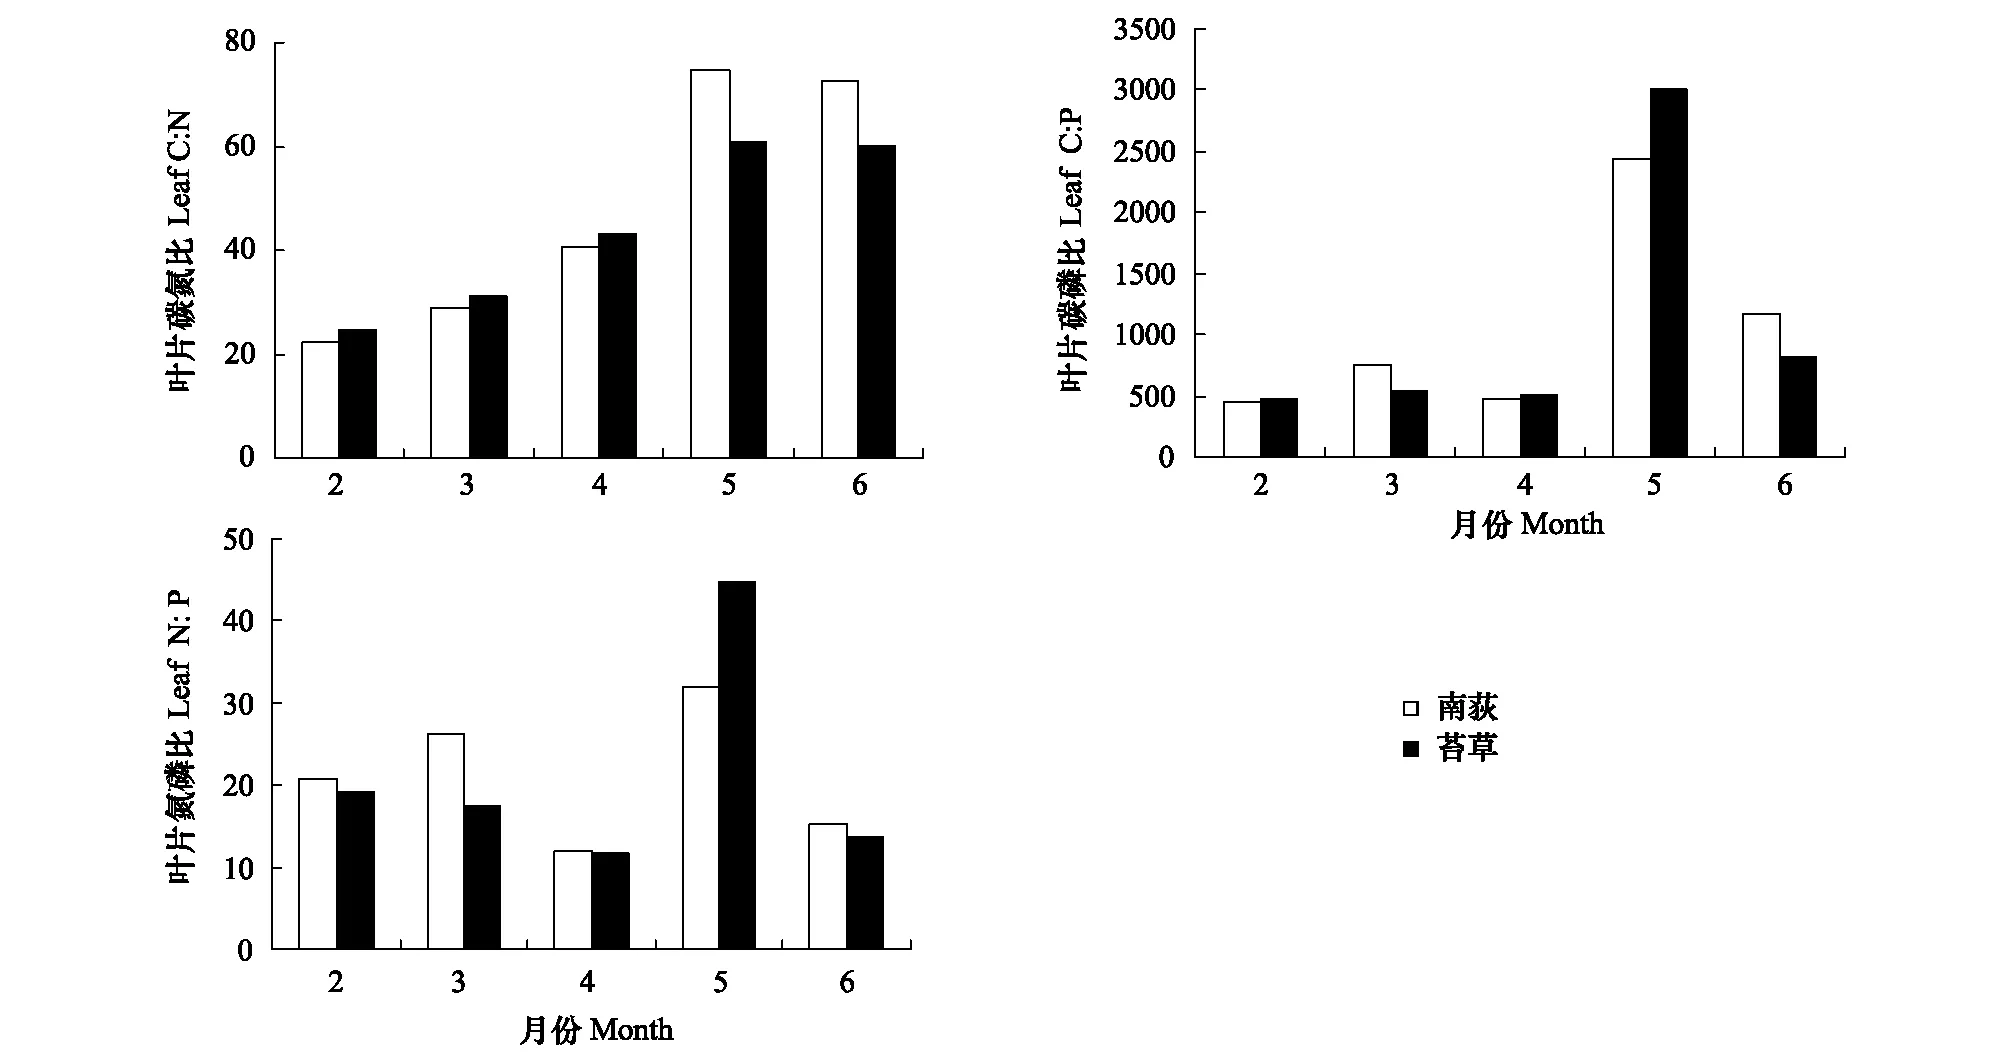
图2 苔草、南荻叶片C∶N、C∶P及N∶P的动态特征Fig.2 Dynamics in leaf C∶N,C∶P,N∶P of Carex cinerascens and Triarrhena lutarioriparia
2.2 生长季叶片养分元素动态与温度和地上生物量的关系
2.2.1 灰化苔草、南荻地上生物量动态特征
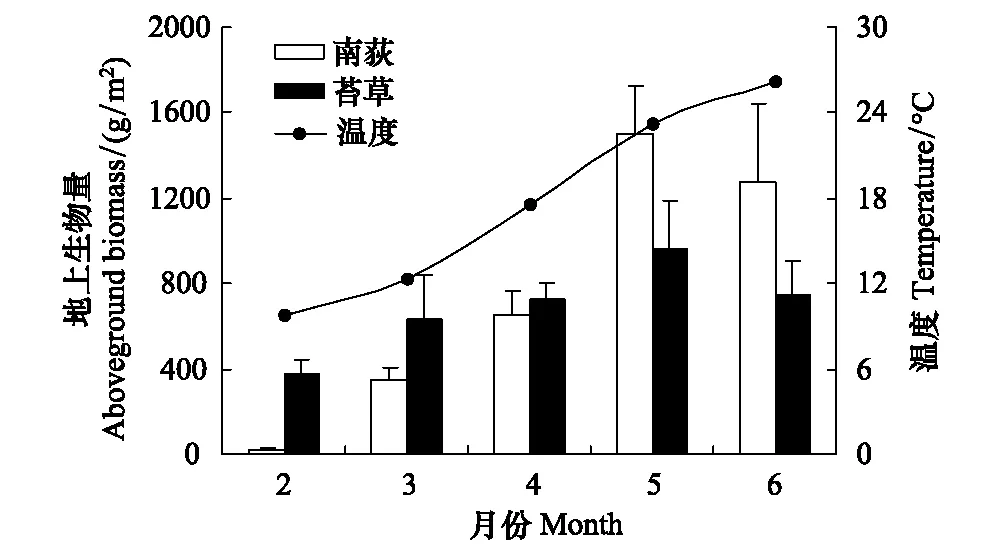
图3 苔草、南荻地上生物量动态特征 Fig.3 Dynamics in aboveground biomass of Carex cinerascens and Triarrhena lutarioriparia
灰化苔草地上生物量变化范围为380.8—961.1 g/m2,平均含量为(689.8±148.0) g/m2。南荻地上生物量变化范围为15.7—1500.8 g/m2,平均含量为(757.7±153.8) g/m2(图3)。初春,灰化苔草、南荻由地下匍匐茎先端或节上萌生植株,由于此时的温度较低,光合作用较弱,地上生物量的累积较少(图3)。随着气温的上升,叶片生物量逐渐积累,植物光合叶面积增加,同化能力增强,地上生物量在生长旺季4—5月份的时候达到生长季的最大值(图3)。到了6月份,研究区即将进入丰水期,灰化苔草、南荻进入生长季末期,植物地上生物量呈下降趋势。
2.2.2 温度与生物量对养分元素动态特征的影响
GLM分析表明气温与生物量对苔草和南荻叶有机碳含量均无显著影响,但两变量交互作用对南荻叶有机碳有显著影响;气温、生物量及两变量交互作用对南荻叶氮含量均有显著作用,仅气温对苔草叶氮含量作用显著;气温仅对苔草叶磷有显著影响,生物量及两变量交互作用对叶磷影响均不显著(表1)。可以发现,气温和生物量对两种优势植物叶片氮、磷含量的影响要高于对叶有机碳含量的影响。
如果把两物种的观测值放在一起,则地上生物量能解释83%的叶N含量的变异以及45%的叶P变异(图4)。此外,叶片C∶N、C∶P与地上生物量之间均表现为显著正相关关系,表明鄱阳湖草洲植物随着气温的升高,生长加速,养分利用效率提高(图4)。
3 讨论
3.1鄱阳湖湿地两种优势植物C、N、P及其化学计量比与其它地区比较
与森林、草地、荒漠等陆生植物相比较,本研究中两种湿地优势植物平均叶C(371.7 mg/g)、N(11.45 mg/g)含量不仅低于木本植物,也低于相应生态系统内的草本植物,叶P(1.56 mg/g)含量则与相关文献报道接近[10,13,19,28- 30]。Koerselman和Meuleman[31]综述了湿地植物的N、P含量变化范围分别为6—20 mg/g,0.2—3.3 mg/g;本研究两种优势植物的N、P均在此范围内,但明显低于云南洱海流域44种湿地植物N、P平均含量以及白洋淀湿地的芦苇、闽江河口湿地的芦苇、短叶茳芏的叶片N、P含量[20,32- 33];与长江口九段沙湿地植物海三棱藨草、互花米草叶N、P含量相当[34];与杭州湾滨海湿地3种优势植物相比较则叶N含量相当,而叶P含量明显偏高[25]。在同一区域内,鄱阳湖草洲两种优势植物与鄱阳湖湖滨沙山14种优势植物叶片N(10.21 mg/g)、P(1.24 mg/g)含量相当或略高[35]。
除了植物生活型不同引起的叶片C、N、P的差异之外,气温、降水等是引起C、N、P空间分异的主要原因[36]。对于湿地植物而言,叶片C、N、P含量及其化学计量比的差异可能还与湿地水体、沉积物的营养水平,以及湿地植物本身的生物学特性密切相关[37]。例如,云南洱海流域湿地植物的N、P含量明显高于其他地区的湿地,而众多文献均报道芦苇相对于其他湿地植物具有更高的N、P水平[20,32- 34]。本研究中两种优势植物的C、N、P含量相对较低可能与鄱阳湖作为通江湖泊密切相关,鄱阳湖每年丰水期时草洲淹没、枯水期时草洲出露,频繁的干湿交替导致土壤中的可溶性N、P随着地表、地下径流而发生迁移、流失,从而影响到植物叶片的养分含量。
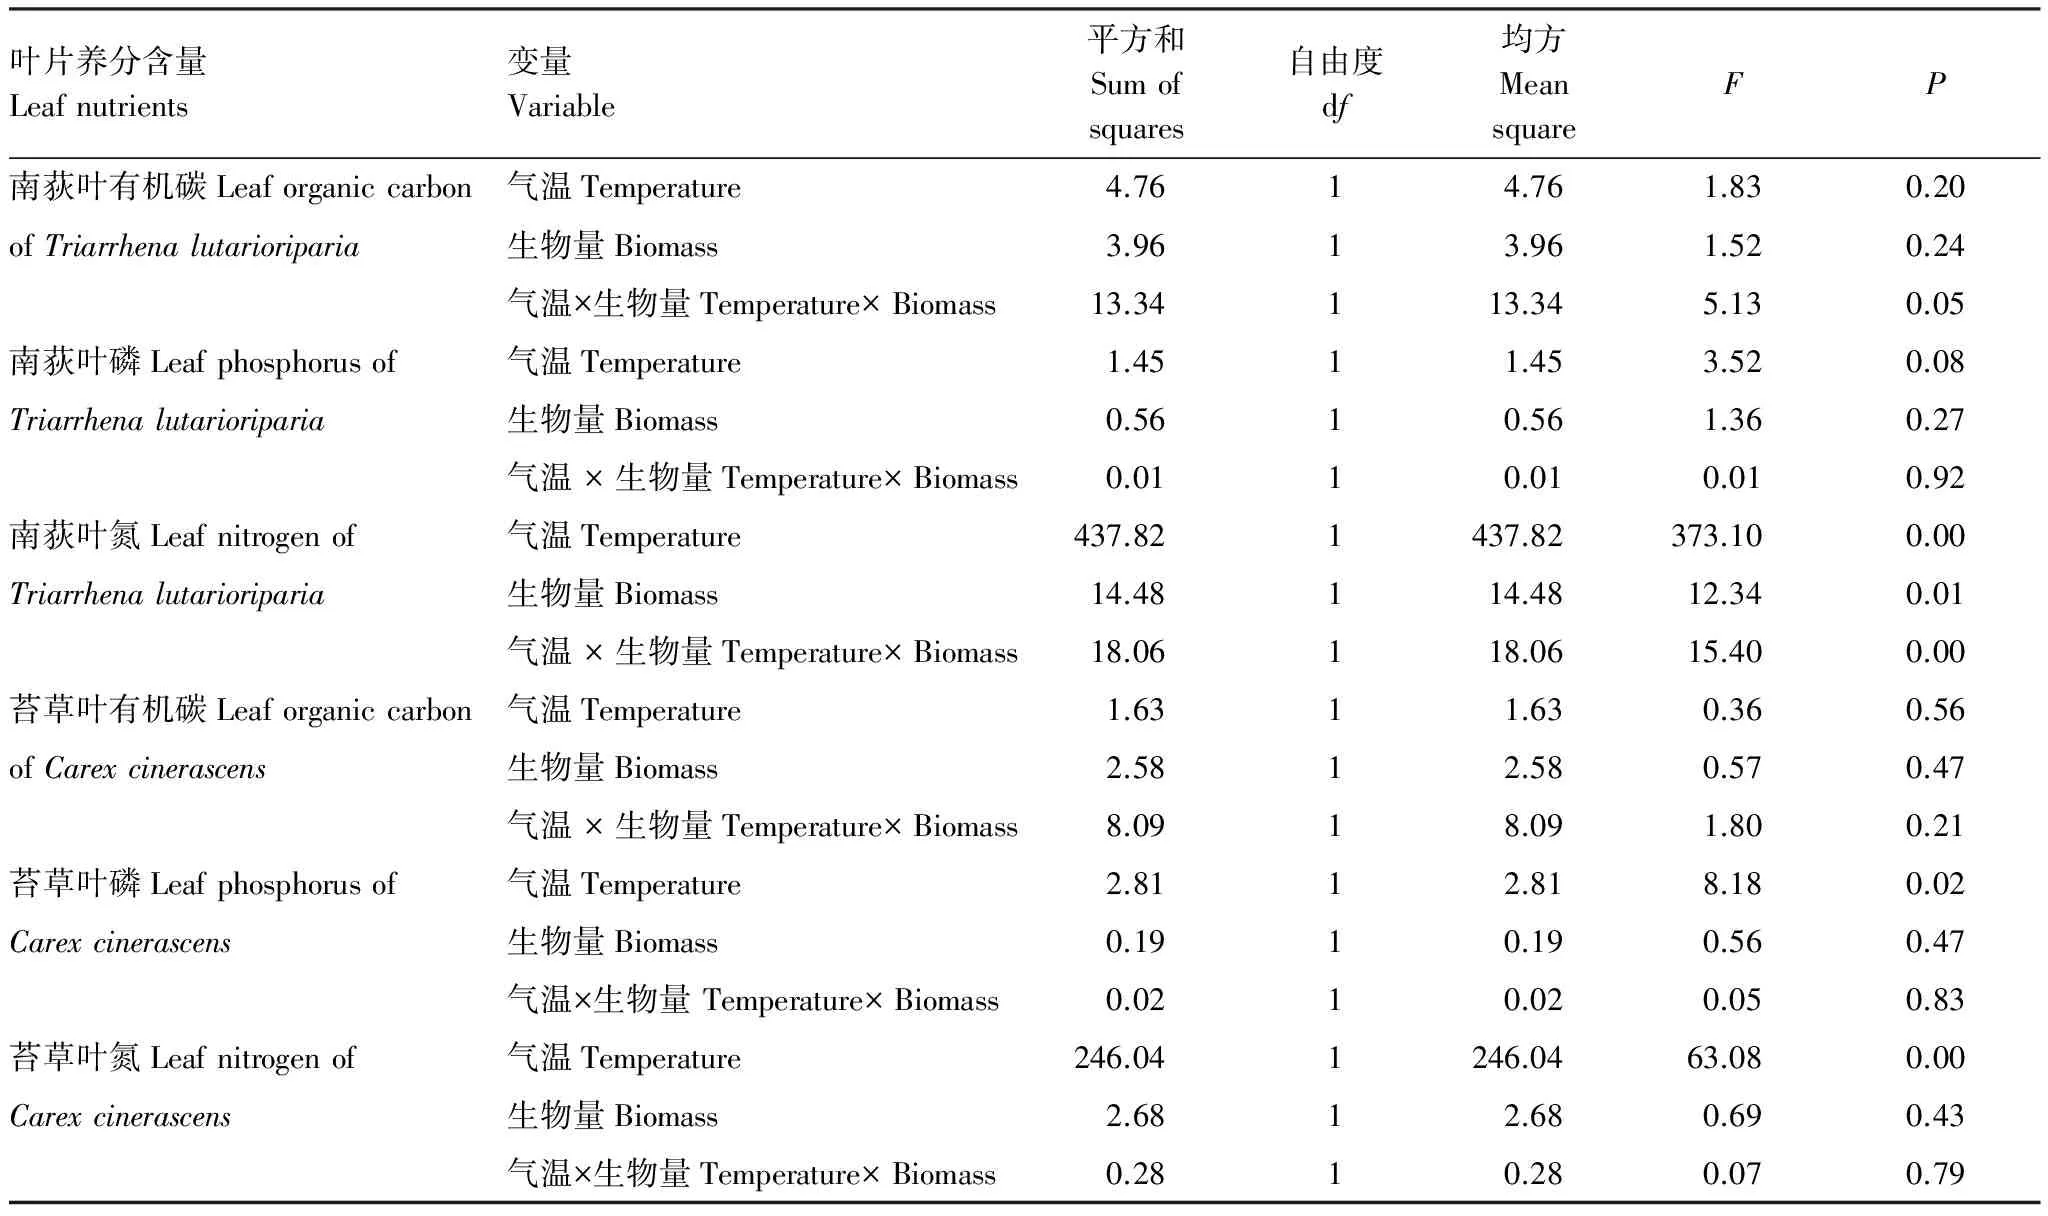
表1 气温与生物量对两种优势植物叶片养分影响的GLM分析
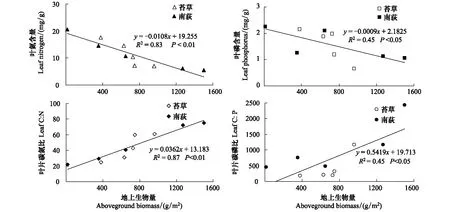
图4 叶片N、P及C∶N、C∶P与地上生物量之间的关系Fig.4 Relationships between aboveground biomass, N and P concentrations, C∶N and C∶ P of leaves
尽管基于样本数量不同而导致不同研究中植物C、N、P平均含量的差异,但多数大尺度的研究结果均表明中国陆生植物的P含量相对较低,从而N∶P高于全球平均水平[10- 11,13,17]。本研究中两种优势植物由于叶片N含量明显偏低,导致C∶N(45.95)高于Kattge等[28]报道的全球平均C∶N(27.30)以及He等[11]报道的中国草地C∶N(20.88);而N∶P(21.24)则低于全球N∶P(28.34)及中国草地的N∶P(33.88)。本研究中两种优势植物相对较高的C∶N、C∶P反映了更高的N、P利用效率,可能是一种在低有效养分环境下的适应策略。此外,本研究中两种优势植物之间的C∶N、N∶P、C∶P差异不显著,反映了同一区域不同物种间的化学计量比无明显差别, 这与其它文献报道一致[23,38]。
3.2 叶片C、N、P动态变化影响因子
叶片C、N、P含量的动态变化是植物物候期、光合作用、细胞分裂、温度、土壤养分等因素综合作用的结果,而温度的变化是一切生理、生态过程的直接驱动因素,一方面温度会影响微生物对土壤有机质的矿化分解速率,进而影响土壤养分的有效性。同时,温度的高低会影响有效养分在土壤中的移动速度以及根系对养分的吸收效率。从而,这些来自于温度对生物地球化学过程的影响将会导致叶片氮、磷含量的增加或降低[36]。另一方面,随着气温的变化,植物光合作用增强、生长加速,有机物质累积增加,这些都将影响到植物叶片的养分含量。本研究中两种优势植物叶片N、P含量具有明显的动态特征,其变化模式与白洋淀、闽江口及杭州湾湿地植物的N、P季节动态基本一致[25,32- 33]。
2月份,在灰化苔草、南荻生长初期,植物细胞迅速分裂,需要大量的N、P来合成生长所需要的蛋白质和核酸,N、P吸收较多,此时叶片N、P含量较高。4—5月份,随着气温的上升,叶片生物量逐渐积累,植物光合叶面积增加,同化能力增强,灰化苔草和南荻叶片N、P含量受稀释效应的影响表现为下降趋势。到了6月份,研究区即将进入丰水期,灰化苔草、南荻进入生长季末期,叶片不再生长,保持相对稳定,植物地上生物量呈下降趋势,此阶段为植物吸收快速生长期,根系的吸收能力加强,植物叶片N、P营养元素含量又有不同程度的升高。
当前,区域C、N、P化学计量学格局及其驱动因素仍然是植物生态化学计量学的一个主要研究领域[2]。由于植物C、N、P含量及其化学计量比存在明显的动态变化,因而在进行大尺度的样品采集与数据分析时亟需反映不同季节的C、N、P及其化学计量比信息。
3.3 植物、土壤C、N、P及其化学计量比对养分限制的指示作用
Tian等[15]研究表明,中国土壤表层0—10 cm C∶N(14.35)、C∶P(135.8)、N∶P(9.30)均趋向于相对稳定性,认为表层土壤C、N、P化学计量比能很好地指示土壤养分状况。研究区灰化苔草分布区表层土壤(0—10 cm)有机碳、全氮、全磷含量分别为19.40、1.78、0.70 mg/g,C∶N、C∶P、N∶P则分别为12.72、71.60、5.63;南荻分布区相应的土壤养分含量分别为12.90、1.24、0.53 mg/g;C∶N、C∶P、N∶P分别为12.14、62.88、5.18。两种优势种分布区表层土壤养分含量虽存在一定差异,但其化学计量比基本保持一致。此外,研究区土壤C∶N、C∶P、N∶P均明显低于相应地表优势植物C∶N、C∶P、N∶P,这与其它地区的研究一致[33]。
土壤有机质矿化分解速率通常与C∶N、C∶P呈负相关关系,较低的C∶N、C∶P意味着土壤N、P有效性较高[1],本研究区土壤C∶N、C∶P均低于全国平均水平,理论上土壤有效N、P含量应该较为丰富,但鄱阳湖受五河与长江来水的双重影响,一年中发生频繁的干湿交替,土壤中的可溶性N、P极易随地表、地下径流发生迁移,因此造成研究区土壤及植物N、P含量总体偏低。
由于土壤中P的来源除了地表枯枝落叶的归还之外,很大程度上还来源于母质矿物,因此,在研究区土壤、植物N、P含量总体偏低的基础上,P保持相对较高水平,亦即N相对于P更加的缺乏。根据Koerselman和Meuleman[31]研究结果:当湿地植物N∶P比lt;31时通常意味着氮受限,N∶P比gt;35时存在磷限制。鄱阳湖草洲两种优势植物叶片N∶P平均值分别为21.30、21.19,表明鄱阳湖草洲优势植物的生长更多地受氮的限制。
[1] Wang S Q, Yu G R. Ecological stoichiometry characteristics of ecosystem carbon, nitrogen and phosphorus elements. Acta Ecologica Sinica, 2008, 28(8): 3937- 3947.
[2] He J S, Han X G. Ecological stoichiometry: searching for unifying principles from individuals to ecosystems. Chinese Journal of Plant Ecology, 2010, 34(1): 2- 6.
[3] Ågren G I. Stoichiometry and nutrition of plant growth in natural communities. Annual Review of Ecology, Evolution, and Systematics, 2008, 39(1): 153- 170.
[4] Ågren G I, Weih M. Plant stoichiometry at different scales: element concentration patterns reflect environment more than genotype. New Phytologist, 2012, 194(4): 944- 952.
[5] Dijkstra F A, Pendall E, Morgan J A, Blumenthal D M, Carrillo Y, LeCain D R, Folleett R F, Williams D G. Climate change alters stoichiometry of phosphorus and nitrogen in a semiarid grassland. New Phytologist, 2012, 196(3): 807- 815.
[6] Urabe J, Naeem S, Raubenheimer D, Elser J J. The evolution of biological stoichiometry under global change. Oikos, 2010, 119(5): 737- 740.
[8] Elser J J, Fagan W F, Denno R F, Dobberfuhl D R, Folarin A, Huberty A, Interlandi S, Kilham S S, McCauley E, Schulz K L, Siemann E H, Sterner R W. Nutritional constraints in terrestrial and freshwater food webs. Nature, 2000, 408(6812): 578- 580.
[9] McGroddy M E, Daufresne T, Hedin L O. Scaling of C ∶N ∶P stoichiometry in forests worldwide: implications of terrestrial Redfield-type ratios. Ecology, 2004, 85(9): 2390- 2401.
[10] He J S, Fang J Y, Wang Z H, Guo D L, Flynn D F B, Geng Z. Stoichiometry and large-scale patterns of leaf carbon and nitrogen in the grassland biomes of China. Oecologia, 2006, 149(1): 115- 122.
[11] He J S, Wang L, Flynn D F B, Wang X P, Ma W H, Fang J Y. Leaf nitrogen:phosphorus stoichiometry across Chinese grassland biomes. Oecologia, 2008, 155(2): 301- 310.
[12] Yu Q, Elser J J, Chen Q S, He N P, Wu H H, Zhang G M, Wu J G, Bai Y F, Han X G. Linking stoichiometric homoeostasis with ecosystem structure, functioning and stability. Ecology Letters, 2010, 13(11): 1390- 1399.
[13] Han W X, Fang J Y, Guo D L, Zhang Y. Leaf nitrogen and phosphorus stoichiometry across 753 terrestrial plant species in China. New Phytologist, 2005, 168(2): 377- 385.
[14] Qin H, Li J X, Gao S P, Li C, Li R, Shen X H. Characteristics of leaf element contents for eight nutrients across 660 terrestrial plant species in China. Acta Ecologica Sinica, 2010, 30(5): 1247- 1257.
[15] Tian H Q, Chen G S, Zhang C, Melillo J M, Hall C A S. Pattern and variation of C:N:P ratios in China′s soils: a synthesis of observational data. Biogeochemistry, 2010, 98(1/3): 139- 151.
[16] Zhang S B, Zhang J L, Ferry-Slik J W, Cao K F. Leaf element concentrations of terrestrial plants across China are influenced by taxonomy and the environment. Global Ecology and Biogeography, 2012, 21(8): 809- 818.
[17] Ren S J, Yu G R, Tao B, Wang S Q. Leaf nitrogen and phosphorus stoichiometry across 654 terrestrial plant species in NSTEC. Environmental Science, 2007, 28(12): 2665- 2673.
[18] Zheng S X, Shangguan Z P. Spatial patterns of leaf nutrient traits of the plants in the Loess Plateau of China. Progress in Natural Science, 2006, 16(8): 965- 973.
[19] Li Y L, Mao W, Zhao X Y, Zhang T H. Leaf nitrogen and phosphorus stoichiometry in typical desert and desertified regions North China. Environmental Science, 2010, 31(8):1716- 1725.
[20] Lu J, Zhou H X, Tian G Y, Liu G H. Nitrogen and phosphorus contents in 44 wetland species from the Lake Erhai Basin. Acta Ecologica Sinica, 2011, 31(3): 709- 715.
[21] Liu W D, Su J R, Li S F, Zhang Z J, Li Z W. Stoichiometry study of C, N and P in plant and soil at different successional stages of monsoon evergreen broad-leaved forest in Pu′er, Yunnan Province. Acta Ecologica Sinica, 2010, 30(23): 6581- 6590.
[22] Gao S P, Li J X, Xu M C, Chen X, Dai J. Leaf N and P stoichiometry of common species in successional stages of the evergreen broad-leaved forest in Tiantong National Forest Park. Acta Ecologica Sinica, 2007, 27(3): 947- 952.
[23] Wu T G, Chen B F, Xiao Y H, Pan Y J, Chen Y, Xiao J H. Leaf stoichiometry of trees in three forest types in Pearl River Delta, South China. Chinese Journal of Plant Ecology, 2010, 34(1): 58- 63.
[24] Yang Y H, Luo Y Q. Carbon:nitrogen stoichiometry in forest ecosystems during stand development. Global Ecology and Biogeography, 2011, 20(2): 354- 361.
[25] Wu T G, Wu M, Liu L, Xiao J H. Seasonal variations of leaf nitrogen and phosphorus stoichiometry of three herbaceous species in Hangzhou Bay coastal wetlands. Chinese Journal of Plant Ecology, 2010, 34(1): 23- 28.
[26] Liu C, Wang Y, Wang N, Wang G X. Advances research in plant nitrogen, phosphorus and their stoichiometry in terrestrial ecosystems: a review. Chinese Journal of Plant Ecology, 2012, 36(11): 1205- 1216.
[27] Liu X Z, Fan S B, Hu B H. Comprehensive and scientific survey of Jiangxi Nanjishan wetland nature Reserve. Beijing: Chinese Forestry Press, 2006: 50- 51.
[28] Kattge J, Díaz S, Lavorel S, Prentice I C, Leadley P, Bõnisch G, Garnier E, Westoby M, Reich P B, Wright I J, Cornelissen J H C, Violle C, Harrison S P, Van Bodegom P M, Reichstein M, Enquist B J, Soudzilovskaia N A, Ackerly D D, Anand M, Atkin O, Bahn M, Baker T R, Baldocchi D, Bekker R, Blanco C C, Blonder B, Bond W J, Bradstock R, Bunker D E, Casanoves F, Cavender-bares J, Chambers J Q, Chapin iii F S, Chave J, Coomes D, Cornwell W K, Craine J M, Dobrin B H, Duarte L, Durka W, Elser J, Esser G, Estiarte M, Fagan W F, Fang J, Fernández-Méndez F, Fidelis A, Finegan B, Flores O, Ford H, Frank D, Freschet G T, Fyllas N M, Gallagher R V, Green W A, Gutierrez A G, Hickler T, Higgins S I, Hodgson J G, Jalili A, Jansen S, Joly C A, Kerkhoff A J, Kirkup D, Kitajima K, Kleyer M, Klotz S, Knops J M H, Kramer K, Kühn I, Kurokawa H, Laughlin D, Lee T D, Leishman M, Lens F, Lenz T, Lewis S L, Lloyd J, Llusià J, Louault F, Ma S, Massad T, Medlyn B E, Messier J, Moles A T, Müller S C, Nadrowski K, Naeem S, Ninemets Ü, Nöllert S, Nüske A, Ogaya R, Oleskyn J, Onipchenko V G, Onoda Y, Ordoez J, Overbeck G, Ozinga W A, Patio S, Paula S, Pausas J G, Peuelas J, Phillips O L, Pillar V, Poorter L, Poschlod P, Prinzing A, Proulx R, Rammig A, Reinsch S, Reu B, Sack L, Salgado-negret B, Sardans J, Shiodera S, Shipley B, Siefert A, Sosinski E, Soussana J F, Swaine E, Swenson N, Thompson K, Thornton P, Waldram M, Weiher E, White M, White S, Wright S J, Yguel B, Zaehle S, Zanne A E, Wirth C. TRY-a global database of plant traits. Global Change Biology, 2011, 17(9): 2905- 2935.
[29] Wang J Y, Wang S Q, Li R L, Yan J H, Sha L Q, Han S J. C ∶N ∶P stoichiometric characteristics of four forest types′dominant tree species in China. Chinese Journal of Plant Ecology, 2011, 35(6): 587- 595.
[30] Song Y T, Zhou D W, Li Q, Wang P, Huang Y X. Leaf nitrogen and phosphorus stoichiometry in 80 herbaceous plant species of Songnen grassland in Northeast China. Chinese Journal of Plant Ecology, 2012, 36(3): 222- 230.
[31] Koerselman W, Meuleman A F M. The vegetation N:P ratio: a new tool to detect the nature of nutrient limitation. The Journal of Applied Ecology, 1996, 33(6): 1441- 1450.
[32] Liu C Q, Li A, Li B, Wang J X, Zhang Y J, Liu S. Dynamics of biomass, nitrogen and phosphorus storage ofPhragmitesaustralisin Baiyangdian Lake. Acta Scientiae Circumstantiae, 2012, 32(6):1503- 1511.
[33] Wang W Q, Xu L L, Zeng C S, Tong C, Zhang H L. Carbon, nitrogen and phosphorus ecological stoichiometric ratios among live plant-litter-soil systems in estuarine wetland. Acta Ecologica Sinica, 2011, 31(23): 7119- 7124.
[34] Liu C E, Yang Y X, Yang Y. Distribution characteristics and seasonal dynamics of N, P and K in wetland plants in upper shoal of Jiuduansha. Chinese Journal of Ecology, 2008, 27(11): 1876- 1882.
[35] Hu Q W, Zheng L, Wu Q, Li X F, Cao Y, Ding M J. Study on nitrogen and phosphorus content in the leaves of dominant plant species in sandy hills along Poyang Lake. Ecological Science, 2010, 29(2): 97- 101.
[36] Reich P B, Oleksyn J. Global patterns of plant leaf N and P in relation to temperature and latitude. Proceedings of the National Academy of Sciences of the United States of America, 2004, 101(30): 11001- 11006.
[37] Sardans J, Rivas-Ubach A, Peuelas J. The elemental stoichiometry of aquatic and terrestrial ecosystems and its relationships with organismic lifestyle and ecosystem structure and function: a review and perspectives. Biogeochemistry, 2012, 111(1/3): 1- 39.
[38] Gueswell S, Koerselman W. Variation in nitrogen and phosphorus concentrations of wetland plants. Perspectives in Plant Ecology, Evolution and Systematics, 2002, 5(1): 37- 61.
参考文献:
[1] 王绍强, 于贵瑞. 生态系统碳氮磷元素的生态化学计量学特征. 生态学报, 2008, 28(8): 3937- 3947.
[2] 贺金生, 韩兴国. 生态化学计量学: 探索从个体到生态系统的统一化理论. 植物生态学报, 2010, 34(1): 2- 6.
[14] 秦海, 李俊祥, 高三平, 李铖, 李蓉, 沈兴华. 中国660种陆生植物叶片8种元素含量特征. 生态学报, 2010, 30(5): 1247- 1257.
[17] 任书杰, 于贵瑞, 陶波, 王绍强. 中国东部南北样带654种植物叶片氮和磷的化学计量学特征研究.环境科学, 2007, 28(12): 2665- 2673.
[18] 郑淑霞, 上官周平. 黄土高原地区植物叶片养分组成的空间分布格局. 自然科学进展, 2006, 16(8): 965- 973.
[19] 李玉霖, 毛伟, 赵学勇, 张铜会. 北方典型荒漠及荒漠化地区植物叶片氮磷化学计量特征研究. 环境科学, 2010, 31(8): 1716- 1725.
[20] 鲁静, 周虹霞, 田广宇, 刘贵华. 洱海流域44种湿地植物的氮磷含量特征. 生态学报, 2011, 31(3): 709- 715.
[21] 刘万德, 苏建荣, 李帅锋, 张志钧, 李忠文. 云南普洱季风常绿阔叶林演替系列植物和土壤C、N、P化学计量特征. 生态学报, 2010, 30(23): 6581- 6590.
[22] 高三平, 李俊祥, 徐明策, 陈熙, 戴洁. 天童常绿阔叶林不同演替阶段常见种叶片N、P 化学计量学特征. 生态学报, 2007, 27(3): 947- 952.
[23] 吴统贵, 陈步峰, 肖以华, 潘勇军, 陈勇, 萧江华. 珠江三角洲3种典型森林类型乔木叶片生态化学计量学. 植物生态学报, 2010, 34(1): 58- 63.
[25] 吴统贵, 吴明, 刘丽, 萧江华. 杭州湾滨海湿地3种草本植物叶片N、P化学计量学的季节变化. 植物生态学报, 2010, 34 (1): 23- 28.
[26] 刘超, 王洋, 王楠, 王根轩. 陆地生态系统植被氮磷化学计量研究进展. 植物生态学报, 2012, 36(11): 1205- 1216.
[27] 刘信中, 樊三宝, 胡斌华. 江西南矶山湿地自然保护区综合科学考察. 北京: 中国林业出版社, 2006: 50- 51.
[29] 王晶苑, 王绍强, 李纫兰, 闫俊华, 沙丽清, 韩士杰. 中国四种森林类型主要优势植物的C:N:P化学计量学特征. 植物生态学报, 2011, 35(6): 587- 595.
[30] 宋彦涛, 周道玮, 李强, 王平, 黄迎新. 松嫩草地80种草本植物叶片氮磷化学计量特征. 植物生态学报, 2012, 36(3): 222- 230.
[32] 刘存歧, 李昂, 李博, 王军霞, 张亚娟, 刘莎. 白洋淀湿地芦苇生物量及氮、磷储量动态特征. 环境科学学报, 2012, 32(6): 1503- 1511.
[33] 王维奇, 徐玲琳, 曾从盛, 仝川, 张林海.河口湿地植物活体- 枯落物- 土壤的碳氮磷生态化学计量特征.生态学报, 2011, 31(23): 7119- 7124.
[34] 刘长娥, 杨永兴, 杨杨. 九段沙上沙湿地植物N、P、K的分布特征与季节动态. 生态学杂志, 2008, 27(11): 1876- 1882.
[35] 胡启武, 郑林, 吴琴, 李晓峰, 曹昀, 丁明军. 鄱阳湖沙山优势植物种叶片氮磷特征. 生态科学, 2010, 29(2): 97- 101.
Dynamicsofleafcarbon,nitrogenandphosphorusoftwodominantspeciesinaPoyangLakewetland
ZHENG Yanming1, YAO Bo1, WU Qin1, HU Binhua2, HU Qiwu1,*
1KeyLaboratoryofPoyangLakeWetlandandWatershedResearch,MinistryofEducation,JiangxiNormalUniversity,Nanchang330022,China2JiangxiPoyangLakeNanjiWetlandNationalNatureReserveAuthority,Nanchang330038,China
Carbon(C), nitrogen (N) and phosphorous (P) stoichiometry are critical indicators of biogeochemical coupling in terrestrial ecosystems. Stoichiometric homoeostasis plays important role in modulating structure, functioning and stability of ecosystems. However, our current understanding of C∶N∶P stoichiometry is mainly derived from observations across space, and little is known about its dynamics through the time. Besides, stoichiometric researches have been carried out in various terrestrial ecosystems in China, but few data are available for wetland ecosystem. Wetland plants live in more fluctuant environments than terrestrial plants, and responses of wetland ecosystem to climate change are more sensitive than terrestrial ecosystem. The C∶N∶P stoichiometry for wetland plants may differ from terrestrial plants. Hence, more researches on dynamics of leaf carbon, nitrogen and phosphorus concentrations, as well as their stoichiometry for wetland plants are necessary. Poyang Lake is the largest fresh lake in China, with huge areas of wetland occurred in non-flood periods in a year. In this study, a wetland dominated by plant species ofCarexcinerascensandTriarrhenalutarioripariawas selected in the national nature reserve, Nanji wetlands of Poyang Lake. Subsequently, carbon, nitrogen and phosphorus concentrations, as well as aboveground plant biomass were measured every month from February to June in 2011. The objectives of this study were as follows:(1) to clarify dynamics and control factors of the dominant plants′ carbon, nitrogen and phosphorus concentrations, as well as their stoichiometric ratios, (2) to discuss the current status of wetland nutrient utilization and nutrient limitation. Results showed that leaf carbon ranged from 365.3 to 386.6 mg/g forCarexcinerascens, and 352.6 to 393.2 mg/g forTriarrhenalutarioriparia, respectively. Leaf nitrogen differed from 6.96 to 17.59 mg/g forCarexcinerascens, and 5.50 to 20.68 mg/g forTriarrhenalutarioriparia, respectively. Besides, the ranges of leaf phosphorus were 0.65 to 2.14 mg/g and 0.57 to 2.25 mg/g for the two species, respectively. The arithmetic means were (375.5±17.4) mg/g and (371.7±12.5) mg/g for carbon, (11.35±1.40) mg/g and (11.54±0.84) mg/g for nitrogen, (1.56±0.69) mg/g and (1.55±0.68) mg/g for phosphorus, respectively. The arithmetic means of C∶N, C∶P and N∶P ratios were 44.00, 1068.46 and 21.30 forCarexcinerascensand 47.90, 1059.92 and 21.19 forTriarrhenalutarioriparia.There was no significant difference of carbon, nitrogen and phosphorus concentrations, as well as stoichiometric ratios between the two species (pgt; 0.05). Moreover, both leaf nitrogen and phosphorous showed clear dynamic patterns. Leaf nitrogen and phosphorus concentrations peaked at the early stage of growth, and then decreased substantially during the fast growth period, but increased a little by the end of the growing season. Temperature and aboveground biomass were the two main factors controlling the dynamic patterns of nitrogen, phosphorus concentrations and their stoichiometric ratios. C∶N and C∶P ratios were positively correlated with aboveground biomass, which suggested nutrient use efficiency of nitrogen and phosphorus were greatly affected by the growth rate. Additionally, according to nitrogen and phosphorus concentrations both in soil and the two dominant plants′ leaves, as well as the stoichiometric ratios of nitrogen to phosphorus, the plants in the wetland were more limited by nitrogen, rather than by phosphorous.
Poyang Lake; wetland; stoichiometry; nutrient limitation
国家自然科学基金资助项目(31270522, 40803022)
2012- 12- 04;
2013- 07- 19
*通讯作者Corresponding author.E-mail: huqiwu1979@gmail.com
10.5846/stxb201212041740
郑艳明, 尧波,吴琴,胡斌华, 胡启武.鄱阳湖湿地两种优势植物叶片C、N、P动态特征.生态学报,2013,33(20):6488- 6496.
Zheng Y M, Yao B, Wu Q, Hu B H, Hu Q W.Dynamics of leaf carbon, nitrogen and phosphorus of two dominant species in a Poyang Lake wetland.Acta Ecologica Sinica,2013,33(20):6488- 6496.
