PREDICTION OF SURFACE ROUGHNESS FOR END MILLING TITANIUM ALLOY USING MODIFIED PARTICLE SWARM OPTIMIZATION LS-SVM
2013-12-02LiuChunjing刘春景TangDunbing唐敦兵Hehua何华ChenXingqiang陈兴强
Liu Chunjing(刘春景),Tang Dunbing(唐敦兵),He hua(何华) Chen Xingqiang(陈兴强)
(1.College of Mechanical and Electronic Engineering,Nanjing University of Aeronautics and Astronautics,Nanjing,210016,P.R.China;2.Department of Mechanical and Electronic Engineering,College of Bengbu,Bengbu,233030,P.R.China)
INTRODUCTION
Since titanium alloys like Ti6Al4Vhas dislocation motion obstacles in microstructure,it has additional desired characteristics such as,high strength and excellent mechanical resistance even at elevated temperatures[1-2].Many manufacturers propose titanium alloy applications which offer higher strength and wider processing window than conventional hard steels do[3].Compressor blades,discs and rings for jet engines,airframe and space components,pressure vessels,rocket engine cases,helicopter rotor hubs and fasteners are all made of Ti6Al4Vtitanium alloys[4-8].
The quality of components,normally referring to dimensional accuracy,form,and surface finish,is the main concern of manufacturing industry.Among them,the arithmetic average of absolute roughness parameter(Ra)is the most extended index of product quality and,in most cases,a technical requirement for mechanical products[9].During cutting titanium alloys,complex interactions are created between the tool and the workpiece at the contact surface.Consequently,significant forces and high temperatures are recorded causing wear and sometimes breakage of the tool.As a result,the dimension precisions of the finished workpiece and the surface roughness are altered,but the generation process of surface roughness is not fully understood[10].Thus,experimental and analytical models,or those called empirical models developed by conventional approaches like the statistical regression technique which is combined with the response surface methodology(RSM),have remained as an alternative in modeling machining process.Although the statistical regression technique works well for modeling,it can not describe precisely the underlying complicated nonlinear relations between machining parameters and surface roughness[11].Researchers proposed several approaches for predicting surface roughness to increase precision.Palani and Natarajan[12]presented a system for automated and flexible noncontact prediction of the surface roughness of end milling parts through a machine vision system with an integrated artificial neural network (ANN).Costes and Moreau[13]proposed a methodology to predict surface topography using tool displacements and based on tool center point.From the recorded signals and the machining parameters,the tool deformation was modeled.Then,from the calculated deflection,the surface topography in 3-D was predicted.Neşeli,et al[14]used RSM to find out the effect of tool geometry parameters on the surface roughness during turning.The results indicated that the tool nose radius was the dominant factor on the surface roughness.Brezocnik,et al[15]proposed a genetic programming approach to predict surface roughness in end milling process.It was believed that the surface roughness was influenced most highly by feed rate,whereas the vibrations increased the prediction accuracy.Brecher,et al[16]used NC kernel data for monitoring surface roughness in milling operations and developed a human-machine interface through global user data to analyze on-line data with ANN.Zhang,et al[17]studied the development of a surface roughness model for the finish turning of TC11.The multi-quadratic regression equation predicting formula for surface roughness was established by means of the central composite de-sign of experiment.
As we all know,conventional methods like back-propagation(BP)network model based on empirical risk minimization principle have some drawbacks in practical applications,such as slow convergence,easy immerging in local minimum,network structure and type overdepending on experiences,and so on[18].In recent years,support vector machine(SVM)based on statistical learning theory has been developed and successfully used to solve the problem with small samples,nonlinearity,and higher dimension.SVM is designed to minimize structural risk,so it is usually less vulnerable to overfit,local minimum problem,etc.SVM maps input data into a high dimensional feature space and constructs an optimal separating hyperplane in this space.This basically involves solving aquadratic programming(QP)problem with inequality constraints in dual space[19].Least square (LS)-SVM is a modified version of SVM,in which analytical solutions can be obtained by solving linear equations instead of a QP problem,and it greatly reduces the computational complexity[20].Therefore,aprediction model of surface roughness is established by means of LS-SVM.As the prediction model is smooth,nonconvex and constrained,it can hardly be solved by conventional methods.And considering the bigger dimensions of practical engineering with large-scale problems,to ensure a reliable convergence and improve the convergence speed,the modified partical swarm optimization(PSO)algorithm without calculating the inversion of matrix is applied for the control parameters.
1 EXPERIMENTAL SETUP AND ANALYSIS
1.1 Means and materials
Milling tests are performed on a three-axis vertical milling center with numerical control provided by a FANUC 0i.The machine tool axes have a range of 0—900mm in Xdirection,0—500mm in Ydirection and 0—300mm in Zdirection.It has a 16kW spindle motor with a maxi-mum rotation speed of 15 000rad/m.Prior to machining trials,the six surfaces of the workpiece are machined for removing the hard layer on the outer surface.
PVD-TiAlN base coated carbide tools with a 12mm diameter and 4flutes are used in the experiments.Rake angle,helix angle and relief an-gle of the tool are 4°,30°and 10°,respectively.The composition and properties of the cutting tools are illustrated in Table 1.
α-βtitanium alloy′Ti6Al4V′is selected as the workpiece material.The physical and chemical properties of Ti6Al4Valloy are summarized in Tables 2-3.

Table 1 Composition and property of cuttingtool

Table 2 Chemical property of titanium alloy Ti6Al4Vwt%
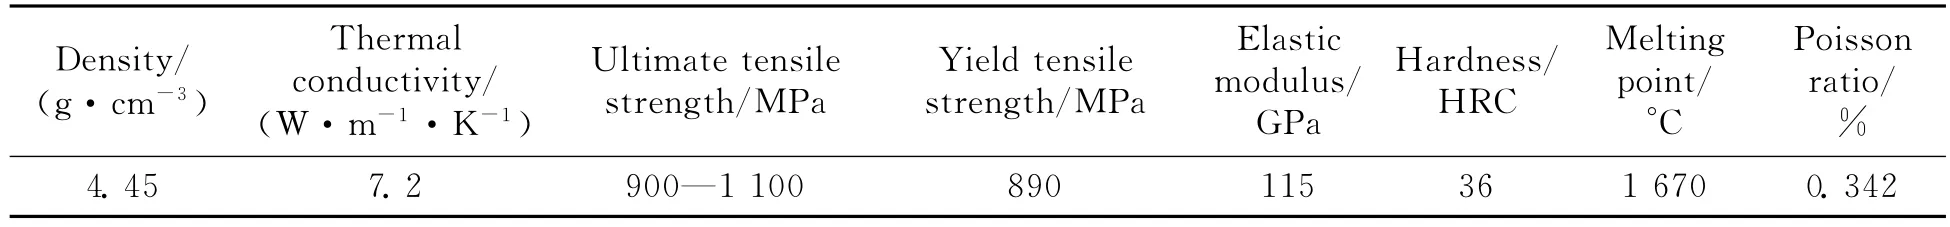
Table 3 Physical property of titanium alloy Ti6A14V
The surface roughness(Ra)is measured by using Mitutoyo Surftest 301.The measurements are repeated three times.The considered result is an average of these values for a given machining pass.
1.2 Orthogonal array experiment
Taguchi method studies the influence of the input parameters on the outputs by using the analysis of variance(ANOVA)and signal-to-noise(S/N)ratio[21].To determine the influence of control factors on surface roughness,three input parameters are selected:cutting speed,feed rate and axial depth of cut.Moreover,the radial depth of cut is kept as a constant of 8.6mm.The L27(313)orthogonal array is employed.Cutting speed,feed rate and axial depth of cut are arranged in columns 1,2and 5,respectively.The levels of the test factors and the L27(313)orthogonal array are presented in Tables 4-5,respectively.In Table 4,the three experimental variables are coded as X1=(Vc-160)/40,X2=(fz-0.12)/0.02,and X3=(aa-0.35)/0.15.where X1,X2and X3are coded values of the variables.Vcis the cutting speed,fzthe feed rate and aathe axial depth of cut.

Table 4 Cutting parameters and their levels
1.3 Result and analysis
For evaluating the reliability of experimental results and the credibility of mathematical models,the experimental results must be tested.ANOVA is used for graphically analyzing the data to obtain the interaction between the process variables and the responses.The quality of the fit model is expressed by the coefficient of determination R2,and its statistical significance is checked by Fisher′s F-test in the same program.Model terms are evaluated by P (probability)with 95%confidence level[22].ANOVA of surface roughness are shown in Table 6.
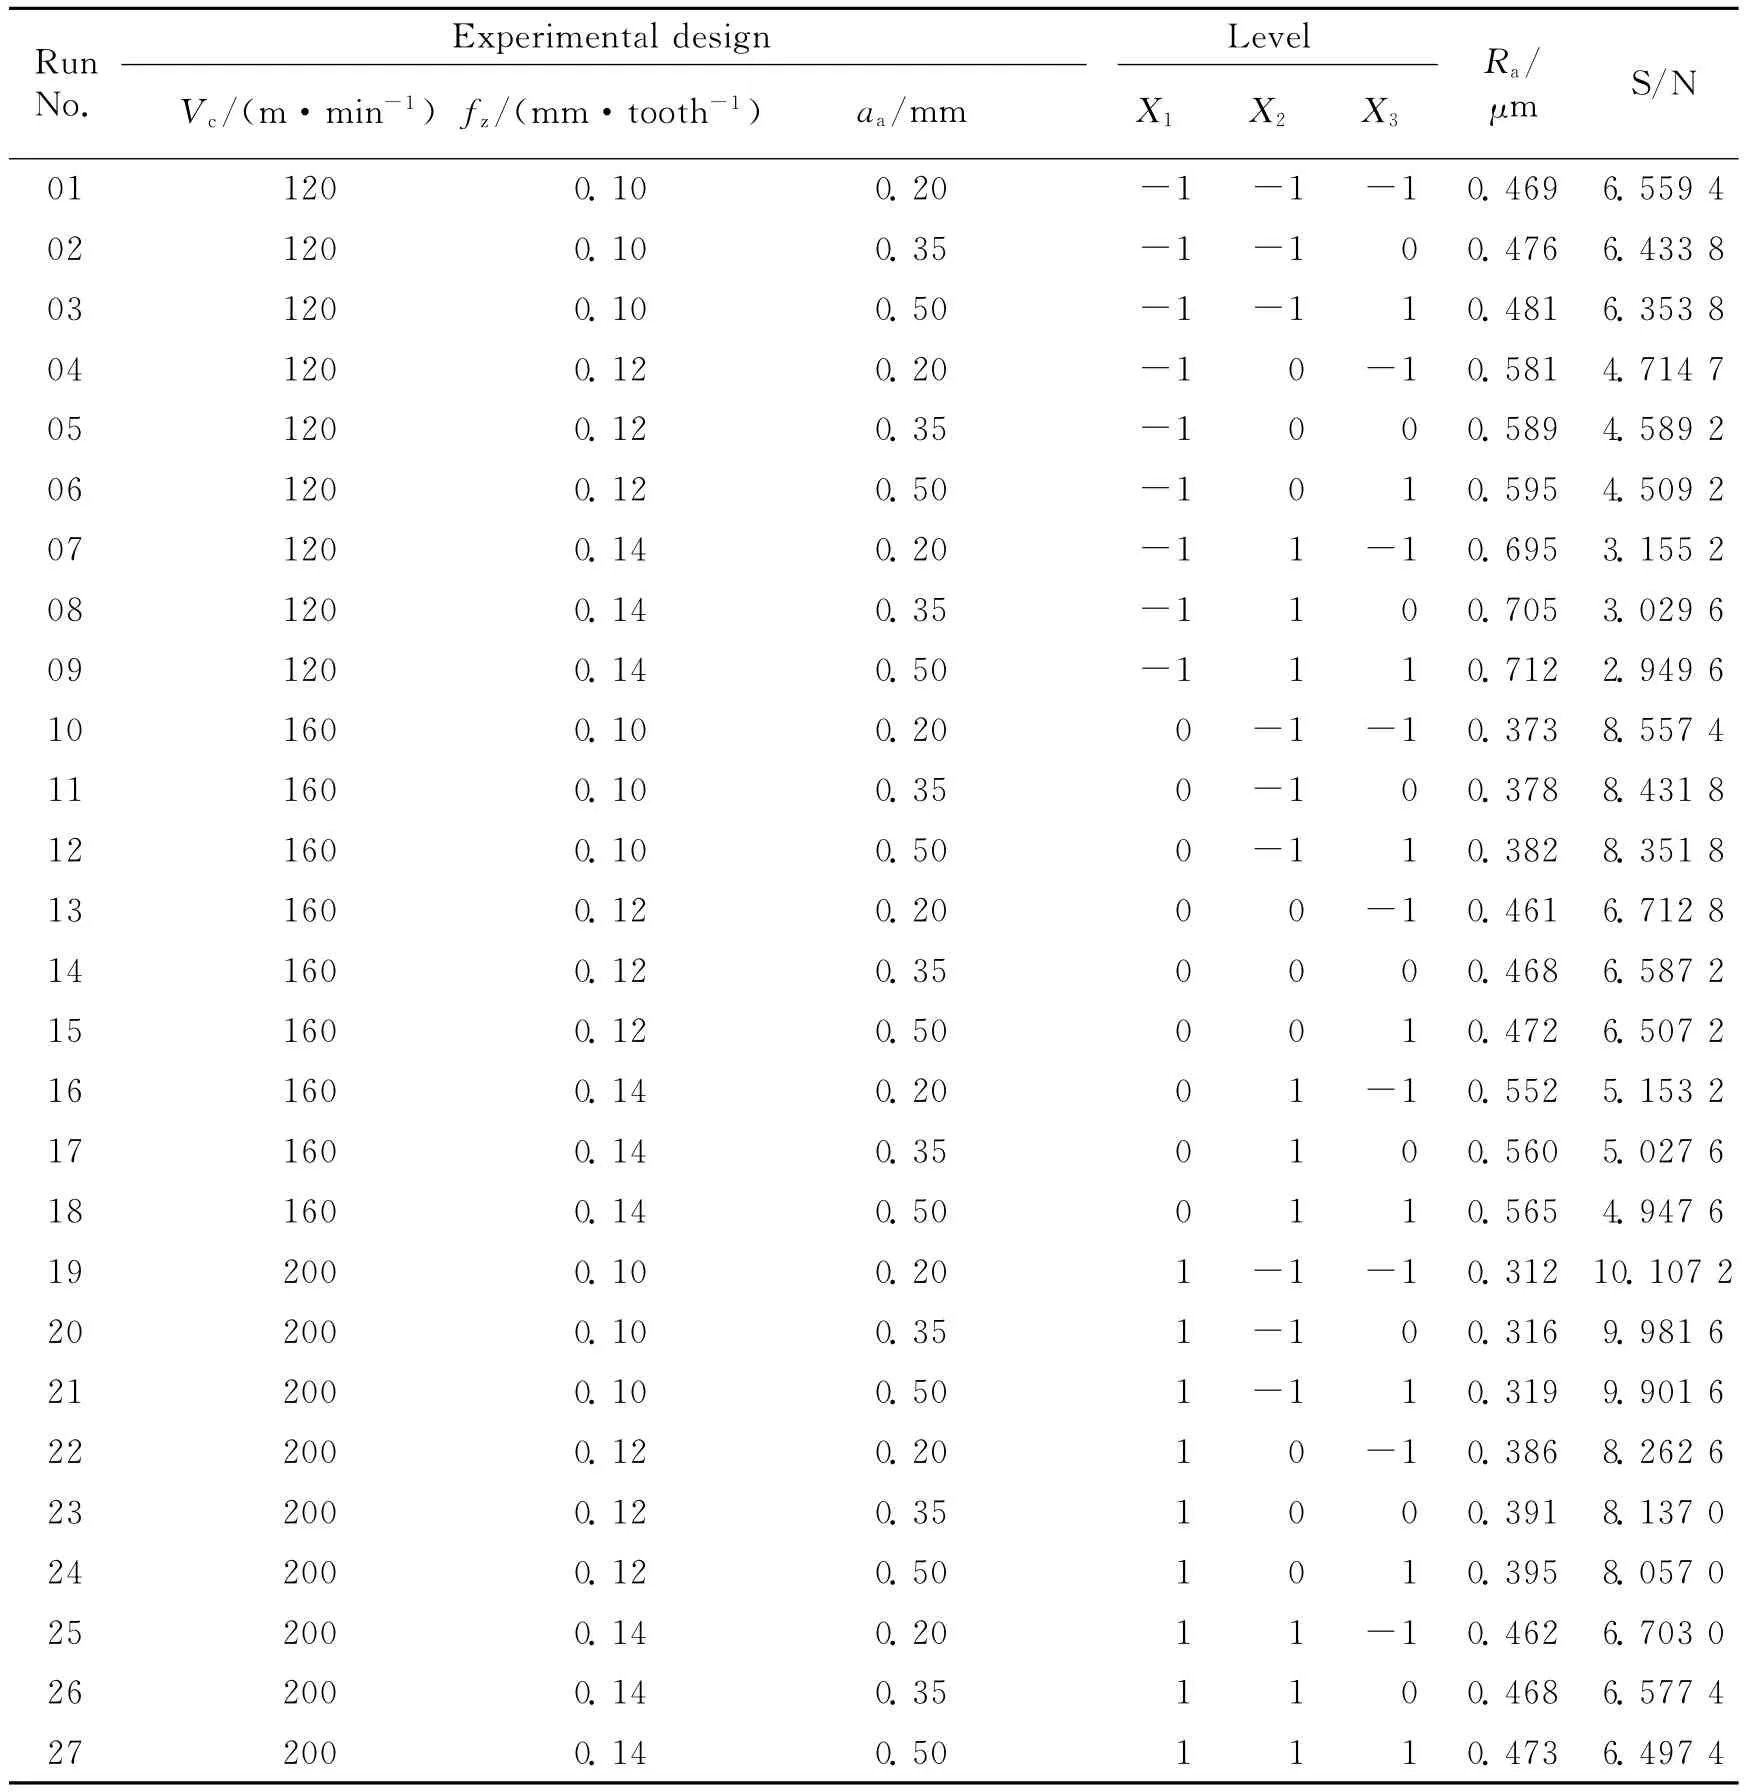
Table 5 Experimental result for surface roughness
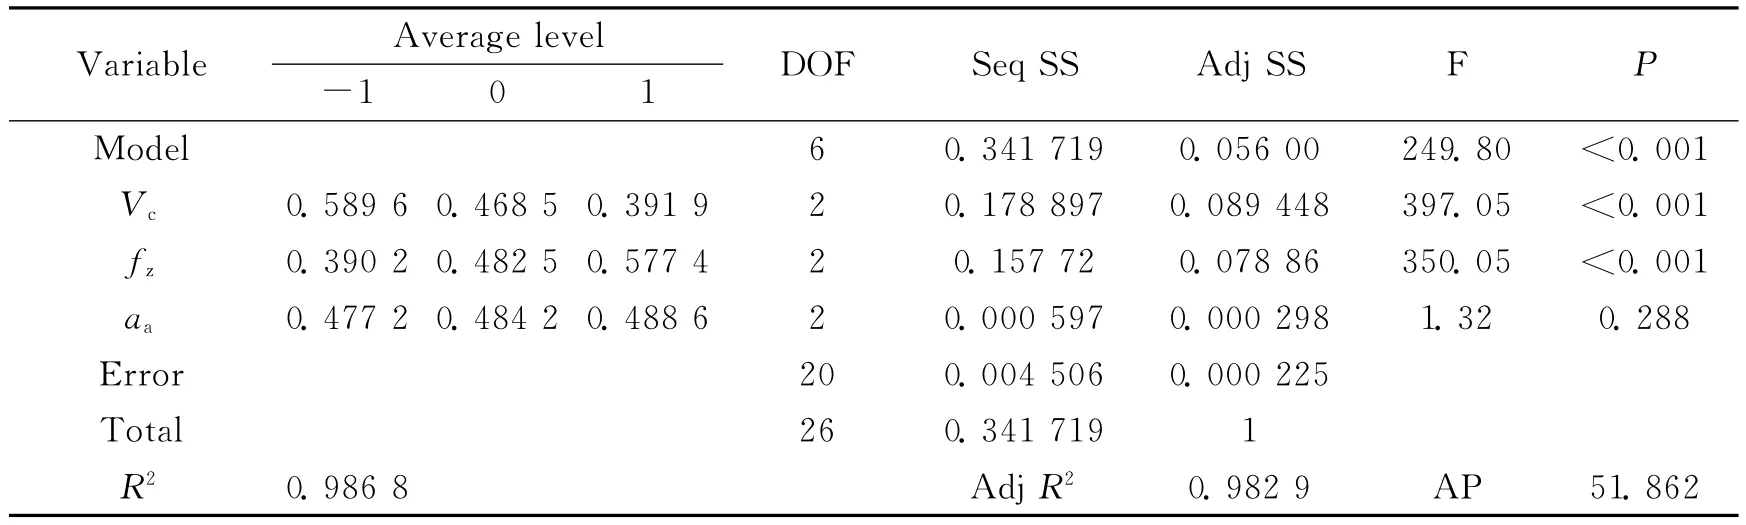
Table 6 Response and ANOVA of surface roughness
Data given in Table 6demonstrates that the model is significant at the 5%confidence level since P is less than 0.05.R2(0.986 8)ensures a 98.68%adjustment of the model to the experimental data,and only 1.32%does not agree with the model.The correlation coefficient AdjR2is 0.982 9,which indi-cates that there is a good correlation between the predicted values and the test results of surface roughness.Adequate precision(AP)compares the range of the predicted values at the design points with the average prediction error.AP value higher than 4(51.862)for the response confirms that the predicted model can be used to navigate the design space defined by the L27(313)orthogonal experiment.In Table 6,DOF is the degree of freedom,Seq SS the sequential sum of square and Adj SS the adjust sum of square.
S/N ratios are calculated and listed in Table 5.The highest S/N ratio is observed at the 19th test condition with the cutting parameters listed as 1level(cutting speed),-1level(feed rate)and-1level(axial depth of cut).The values of Raand S/N are also plotted in Figs.1-2.

Fig.1 S/N ratio at different control levels
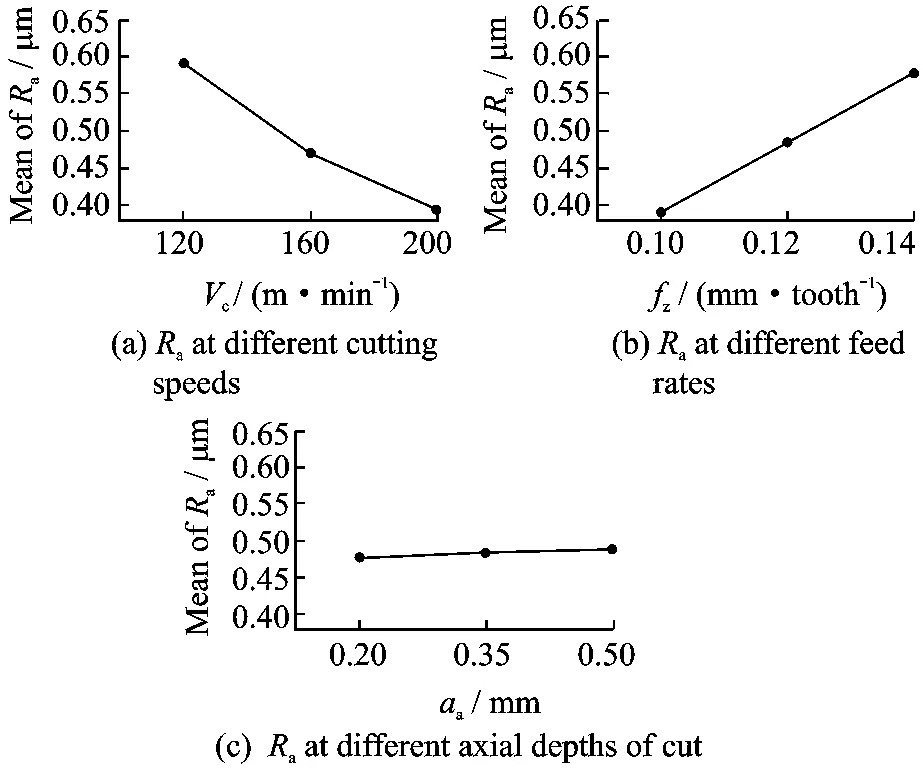
Fig.2 Raat different control levels
2 MODIFIED PSO LS-SVM
Given a training data set{(xi,yi)|xi∈ Rn,yi∈ R}ni=1,where xiand yiare the input and the corresponding output,respectively.Using nonlinear relations,the data samples are mapped from the original space to a higher-dimensional characteristic space.In the higher-dimensional space,the optimal decision function is constructed in the form

where the nonlinear functionφ(·)maps the input pattern into a higher-dimensional feature space.The coefficient vectorωand bias termbare unknown.These unknown parameters can be obtained through solving the following optimization problem
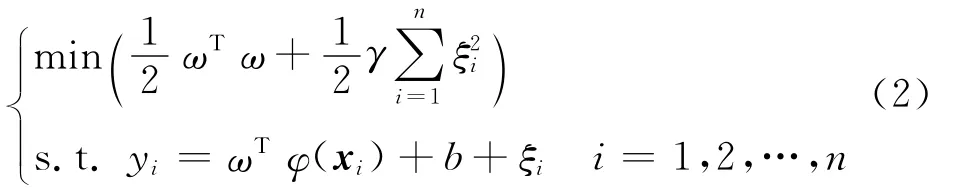
whereξiis the non-negative slack variable,representing the error in the classification problem.The regularized parameterγis a constant denoting a trade-off between the maximum margin 1/‖ω‖2and the minimum experience risk.
The corresponding Lagrange function is given as

where Lis the Lagrangian and aithe Lagrange multiplier.It follows the saddle point condition that the partial derivatives of L with respect to the primal variables(ω,b,ξ,a)have to vanish for optimality.
Taking partial derivatives of L with respect toω,b,ξand a,the following equations are derived
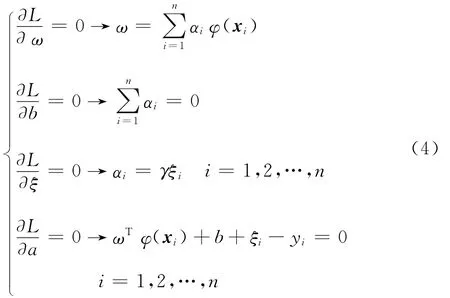
According to Karush-Kuhn-Tucker (KKT)conditions[23],the optimization is converted to solving the set of linear Eq.(5)by eliminating the parameters ofωandξof Eq.(4)

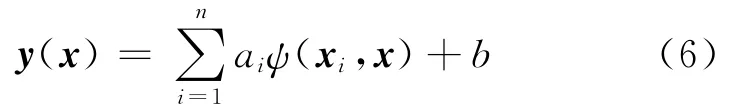
where y=[y1y2… yn]T,Θ=[1 1 …1]T,a=[a1a2… an]T,Ωij=ψ(xi,xj)=φ(xi)Tφ(xj),andψ(·)is a symmetric function satisfying the Mercer condition.The regression function of LS-SVM is
Duo to Eq.(5),the original problem can be described as

Generally least square method is used to resolve these equations in LS-SVM.Considering the bigger dimensions of ATAin practical engineering with largescale problems,PSO algorithm with the performance of avoiding calculating the inversion of matrix is applied to resolve the optimum particle S=[s1,s2,…,sn]Tof Eq(7).
PSO is one of the modern heuristic algorithms developed by Kennedy and Eberhart.It uses a number of particles that constitute a swarm,and each particle represents a potential solution within the search space.The i-th particle has its own best position pbest= (pi1,pi2,…,piD)at which the best fitness is encountered by the particle so far,and the global best position is denoted by gbest=(pg1,pg2,…,pgD)corresponding to all particles in current generation.
The change of position of each particle from one iteration to another can be computed according to the distance between the current position and its previous best position and the distance between the current position and the best position of swarm.Then the updating of velocity and particle position can be obtained by using the following equations
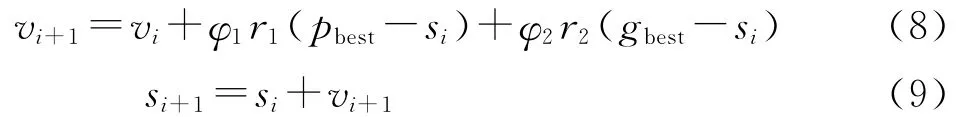
where viis the velocity and sithe position of particle,φ1andφ2are accelerative constants,r1and r2random variables uniformly distributed in the range of[0,1].
To ensure a reliable convergence and improve the convergence speed,the modified PSO is carried out to solve the considered problem by adding convergence factor (χ),inertia weight (μ)and constrain factor (β).Particle iteration formulas are as follows

3 PREDICTION MODEL OF SURFACE ROUGHNESS
Based on formation mechanism and process analysis,the main factors affecting the surface roughness are cutting speed,feed rate and depth of cut.Therefore,they are selected as the input variables of the model.The output is surface roughness.Due to the complicated relations between influential factors and surface roughness,the prediction model can not be constructed through analyzing the formation mechanism of surface roughness.Experimental data are used to establish the prediction model directly based on modified PSO LS-SVM.The analysis of surface roughness formation mechanism is converted to the parameter identification problem of prediction model.
The procedures for establishing the prediction model are as follows:
Step 1 Record the relations between influencing factors and surface roughness by using L27(313)orthogonal array experiments.
Step 2 Construct the training set of prediction model based on modified PSO LS-SVM{xi,yi},where i is the experiment number,xithe cutting speed,feed rate and axial depth of cut,yithe i-th experiment value of surface roughness.
Step 3 Initialize particle swarm randomly,including generating nparticles of s1,s2,…,snto form initial population S(t)and acquiring the velocity matrix v(t)by using the velocity of each particle,where S(t)=[s1,s2,…,sn],v(t)=[v1,v2,…,vn].The initial value of particle best value pbest,iis the initial value of si.
Step 4 Calculat fitness function f(s)of each particle according to the mean squared deviation of
Step 5 Compare f(si)of each particle with f(pbest,i),if f(si)<f(pbest,i),then pbest,i=si,and if f(si)<f(gbest,i),then gbest,i=si,where f(si)is fitness function,f(pbest,i)the optimal fitness of iteration process,f(gbest,i)the optimum fitness of particle swarm,gbest,ithe global optimal solution.
Step 6 Acquire the new swarmS(t+1)by updating the velocity and the position of particle according to Eqs.(10-11).Adjustment rules of
Step 7 If the maximum iteration number is abtained,stop searching,and output the optimal solution b and{ai}ni=1,or else t=t+1,return to Step 2.
Step 8 Establish the prediction model of surface roughness based on modified PSO LSSVM by inserting b and {ai}ni=1into Eq.5.
The model response of^yiis acquired when xiis inserted into the prediction model based on modified PSO LS-SVM.The prediction error can be obtained by comparing predictive value and measured value.
4 CASE STUDY FOR SURFACE ROUGHNESS MODELING
Comparison test for surface roughness modeling are carried out by using BP neural network,LS-SVM and modified PSO LS-SVM according to Table 5,respectively.The initial parameters of BP algorithm are given as follows:learning rate:α=0.2;training epochs are equal to 10 000;the numbers of neuron in hidden layer are set as 9and 12.LS-SVM algorithm is directly realized based on Matlab′s(Matlab 7.1programming language)function of matrix operation.The initial parameters of LS-SVM are given as follows:kernel bandwidth:δ=0.45;penalty coefficient:γ=500.In order to solve high dimension problem efficiently,Gaussian radial basis functionφ(x,y)=exp[ -(x-y)(x-y)T/2δ2] is used as the kernel function of LS-SVM.
The experiments are exerted on a 2.0GHz(M)CPU personal computer with 512MB memory under the operation system of Microsoft Windows XP professional.Time cost of prediction models and learning accuracy of training sets of 4 methods are shown in Table 7.The time cost of modified PSO LS-SVM is one to two orders of magnitude lower than thant of BP neural network,and nearly one order lower than that of LSSVM.
The confirmation experiments are performed by using those parameters excluding experiment parameters.When the experiments are repeated three times,the following surface roughness results of actual values and prediction values are observed as shown in Table 8.The research results show that the mean square error(MSE)of modified PSO LS-SVM is nearly two to three orders of magnitude lower than that of BP neural network,while it is nearly one order of magnitude lower than that of LS-SVM.The modified PSO LSSVM prediction model can explain the influences of cutting speed,feed rate and axial depth of cut on surface roughness.The surface roughness decreases with the increase of the cutting speed.The higher feed rate and axial depth of cut lead to the increase of surface roughness.Higher cutting speed,lower feed rate and smaller axial depth of cut are more optimal cutting conditions.
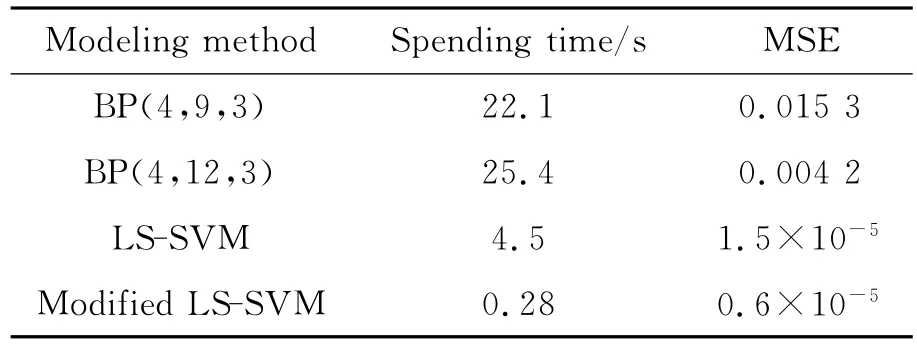
Table 7 Comparison of BP neural network,LS-SVM and modified PSO LS-SVM
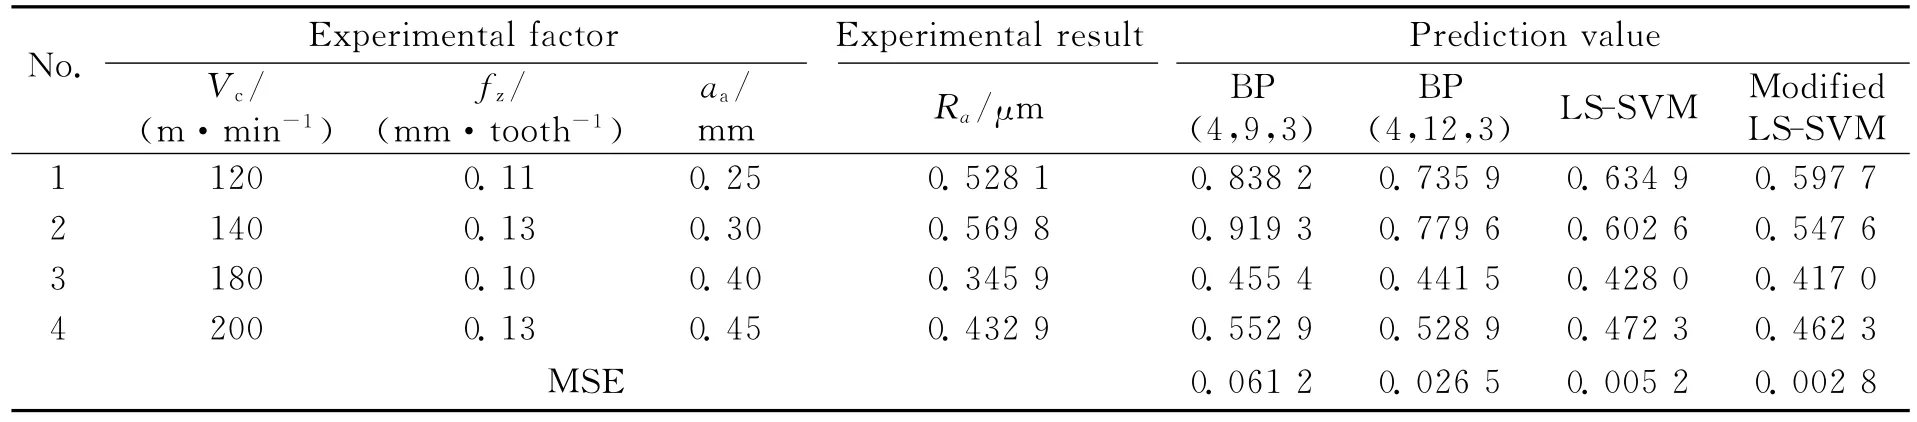
Table 8 Predictive result comparison of surface roughness
5 CONCLUSION
A novel prediction model based on modified PSO LS-SVM is proposed.The modified PSO LSSVM model is validated theoretically and experimentally.The research results show that the construction speed of the modified PSO LS-SVM model is two orders of magnitude faster than that of BP model.Moreover,the prediction accuracy is about one order of magnitude higher than that of BP model.The modified PSO LS-SVM prediction model can explain the influences of cutting speed,feed rate and axial depth of cut on the surface roughness of machined titanium alloys.
In future researches,we will further study the optimizing techniques hybridized with modified PSO LS-SVM to optimize all the cutting parameters that affect the predicted surface roughness.
[1] Ulutan D,Ozel T.Machining induced surface integrity in titanium and nickel alloys:A review[J].International Journal of Machine Tools and Manufacture,2011,51(3):250-280.
[2] Boyer R R.An overview on the use of titanium in the aerospace industry[J].Materials Science and Engineering,1996,213(1/2):103-114.
[3] Nouari M,Ginting A.Wear characteristics and performance of multi-layer CVD-coated alloyed carbide tool in dry end milling of titanium alloy[J].Surface and Coatings Technology,2006,200(18/19):5663-5676.
[4] Arrazola P J,Garay A,Iriarte L M,et al.Machinability of titanium alloys(Ti6Al4Vand Ti555.3)[J].Journal of Materials Processing Technology,2009,209(5):2223-2230.
[5] Li R,Hegde P,Shih A.High-throughput drilling of titanium alloys[J].International Journal of Machine Tools and Manufacture,2007,47(1):63-74.
[6] Cheharon C,Jawaid A.The effect of machining on surface integrity of titanium alloy Ti-6%Al-4%V[J].Journal of Materials Processing Technology,2005,166(2):188-192.
[7] Ginting A,Nouari M.Experimental and numerical studies on the performance of alloyed carbide tool in dry milling of aerospace material[J].International Journal of Machine Tools and Manufacture,2006,46(7/8):758-768.
[8] Tansel I N,G¨ulmez S,Demetgul M,et al.Taguchi method-GONNS integration: Complete procedure covering from experimental design to complex optimization[J].Expert Systems with Applications,2011,38(5):4780-4789.
[9] Quintana G,Rudolf T,Ciurana J,et al.Using kernel data in machine tools for the indirect evaluation of surface roughness in vertical milling operations[J].Robotics and Computer-Integrated Manufacturing,2011,27(6):1011-1018.
[10]Yallese M,Chaoui K,Zeghib N,et al.Hard machining of hardened bearing steel using cubic boron nitride tool[J].Journal of Materials Processing Technology,2009,209(2):1092-1104.
[11]Mukherjee I,Ray P.A review of optimization techniques in metal cutting processes[J].Computers &Industrial Engineering,2006,50(1/2):15-34.
[12]Palani S,Natarajan U.Prediction of surface roughness in CNC end milling by machine vision system using artificial neural network based on 2DFourier transform[J].The International Journal of Advanced Manufacturing Technology,2010,54(9/12):1033-1042.
[13]Costes J P,Moreau V.Surface roughness prediction in milling based on tool displacements[J].Journal of Manufacturing Processes,2011,13(2):133-140.
[14]Neşeli S,Yaldız S,T¨urkeşE.Optimization of tool geometry parameters for turning operations based on the response surface methodology[J].Measurement,2011,44(3):580-587.
[15]Brezocnik M,Kovacic M,Ficko M.Prediction of surface roughness with genetic programming[J].Journal of Materials Processing Technology,2004,157-158(20):28-36.
[16]Brecher C,Quintana G,Rudolf T,et al.Use of NC kernel data for surface roughness monitoring in milling operations[J].The International Journal of Advanced Manufacturing Technology,2010,53(19/12):953-962.
[17]Zhang Hongzhou,Ming Weiwei,An Qinglong,et al.Application of response surface methodology in surface roughness prediction model and parameter optimization[J].Journal of Shanghai JiaoTong University,2010,44(4):447-452.(in Chinese)
[18]Liu X,Shao C,Ma H,et al.Optimal earth pressure balance control for shield tunneling based on LS-SVM and PSO[J].Automation in Construction,2011,20(4):321-327.
[19]Luts J,Ojeda F,Van de Plas R,et al.A tutorial on support vector machine-based methods for classification problems in chemometrics[J].Analytica Chimica Acta,2010,665(2):129-145.
[20]Deng S,Yeh T H.Applying least squares support vector machines to the airframe wing-box structural design cost estimation[J].Expert Systems with Applications,2010,37(12):8417-8423.
[21]Oktem H,Erzurumlu T,Uzman I.Application of Taguchi optimization technique in determining plastic injection molding process parameters for a thin-shell part[J].Materials & Design,2007,28(4):1271-1278.
[22]Tansel I N,G¨ulmez S,Demetgul M,et al.Taguchi Method-GONNS integration: Complete procedure covering from experimental design to complex optimization[J].Expert Systems with Applications,2011,38(5):4780-4789.
[23]Suykens J A K,Vandewalle J,De Moor B.Optimal control by least squares support vector machines[J].Neural Networks,2001,14(1):23-35.
杂志排行

Transactions of Nanjing University of Aeronautics and Astronautics的其它文章
- EFFECTS OF INHALED TiO2NANOTUBES ON LUNG TISSUE AND SERUM BIOCHEMICAL INDEXES OF MICE
- ENERGY-SAVING MATCHING STRATEGY AND EXPERIMENTAL STUDY OF PUMPING SYSTEM FOR TRUCK-MOUNTED CONCRETE PUMP
- NOVEL HIGH-SPEED FPGA-BASED FFT PROCESSOR
- SPATIAL REGULARIZATION OF CANONICAL CORRELATION ANALYSIS FOR LOW-RESOLUTION FACE RECOGNITION
- SOFT IMAGE SEGMENTATION BASED ON CENTER-FREE FUZZY CLUSTERING
- EXPERIMENTAL INVESTIGATION ON R134AAIRBORNE VAPOR-COMPRESSION REFRIGERATION SYSTEM