Analysis of the Signal of Singing Using the Vibrato Parameter in the Context of Choir Singers
2013-11-26EdwardrolniczakandMichaKramarczyk
Edward Półrolniczak and Michał Kramarczyk
1.Introduction
The paper presents one of the aspects of assessing the quality of choral singing voices.The direct motivation for taking up the research on the appraisal of the quality of one’s singing voice is the need to support the training of the production of voice appropriate for choir groups.One of the aims of a choir as a whole is the constant development of artistic performance.The possibility of defining the criteria for appraisal may facilitate work of a vocal coach and a conductor.Some criteria of appraisal, if properly selected,may allow for self-correction of selected voice parameters.The quality can be assessed by using different parameters like intonation, timbre, vibrato, hoarseness, and others.The purpose of this paper is to analyze the vibrato parameter in the context of singing to assess the quality of singing voice.
The concept of vibrato is generally known as the waving of frequency and the volume occurring in the voices of singers.It is obtained also in play by using string instruments and brass instruments.Trainers of voice emission define the vibrato as a periodic, pulsing, and amount of intensity and tone, which is experienced as color impression.In this perspective, the vibrato concept is wider than usual waving of frequency.It seems, however, that the understanding of vibrato parameter as in the second concept is difficult in transferring into automated computer analysis.
2.Literature Review
The term “vibrato” can be seen at several points of view.The first of the points of view is the musical one.Another is the medical.For the purpose of this paper it is important to examine the methods to detect and estimate the vibrato in the signal of recorded singing.
2.1 Musical Point of View
Vibrato is one of the specificity of the singing voice and its natural feature.Vibrato is a musical effect used to add expression.It is sometimes defined inappropriately as frequency modulation and amplitude modulation.The fact is that vibrato in singing only refers to the periodic variation of pitch.The periodic variation of intensity should be named tremolo.A few musical instruments can produce simultaneously both types of modulations occurring.In wind and brass instruments, the amplitude modulation is predominant.In string instruments, the frequency modulation is predominant[1].In voice, both modulations occur at the same time.This is due to the mechanical aspects of the voice production system[2].Vibrato and tremolo can both be described by two elements: their frequencies (rate) and their amplitudes (extent).The average rate for the voice is around 6 Hz and increases exponentially over the duration of a note event[3].It is important to take a range of values in which we have to deal with vibrato in the case of singers.The average extent ranges from 0.6 to 2 semitones for singers[4].On the other hand, a range of vibrato frequency is also to be defined.It is claimed that this frequency lies within the values 2 Hz to 8 Hz.It can be assumed here that the results closer to the lower value are describing amateur singers.We assume that values above 6 Hz are characteristic for professional singers.Those having vibrato rate (in the term of frequency of vibrato) need to practice singing as their vibrato quality is not accepted for the group of singers.
2.2 Methods of Detection and Estimation of Vibrato
The methods of detection and estimation of vibrato are two issues significant for this paper.The detection gives the answer to the question whether vibrato is present in the analyzed signal.Estimation gives information about the scale of vibrato.A number of methods for this purpose can be found in the literature.
The vibrato can be detected in the frequency-domain.Some methods of vibrato detection have been described in[5].One of them is using spectral modeling synthesis (SMS)developed in [6].Within the SMS analysis framework, the extraction of high level time-evolving attributes starting from basic data analysis is performed.To estimate frequency envelopes, short-time Fourier transform (STFT)is applied.Then a prominent peak in the vibrato range is searched and some additional steps are used to achieve reliable results.
In the time-domain, there are several techniques for fundamental frequency estimation[7].Time-domain strategies offer some advantages such as the possibility of using shorter windows.In the situation when it is not necessary to characterize vibrato in details, a filtering strategy can be used.
Some other methods of detection and estimation of vibrato can be found in [8].One of them is based on the observation of phenomenon of spectral envelopes distortion.It is typical for the sound in which the vibrato is observed.This distortion can be easily shown by constructing spectral envelopes with use of two temporal windows centered at the same temporal position.The length of the first one chosen in this paper is sufficiently small (20 ms) in order to neglect vibrato influence while the length of the second one is large enough (60 ms) to exhibit the distortion due to vibrato.The relative difference d(f )= (es1-es2)/es1 between the two envelopes grows linearly with frequency f if the vibrato is present (where es1 and es2 denotes first and second spectral envelopes).
Another method described in [8]is based on AR(autoregressive) prediction.In this method, the vibrato is extracted directly from the f0 trajectory.When the parts of signal with vibrato are shorter than one second, the standard values of vibrato periods [0.1 s - 0.3 s]limit the number of vibrato periods to a maximum of two or three periods for segment.In such case, the vibrato frequency cannot be precisely extracted by a short-time Fourier spectral analysis,since the number of periods per segment of stationary signal is less than the required 4 to 5 periods for a sufficient frequency resolution.The idea of the method is to double the number of samples by extrapolating the f0 signal with a predictive model.0.3 second segments are considered.The sampling frequency of the f0 trajectory is 100 Hz, then each segment is composed of N = 30 samples.The N samples are 0-centered.An AR modeling is then performed.A fast Fourier transform (FFT) is computed and the vibrato frequency is extracted in the next steps by a precise localization of the maximum of the magnitude spectrum.
The method based on analytic signal is performed directly on the temporal evolution of the fundamental frequency f0, normally used directly on sound signals[7].The first step of the original method is to obtain an approximation of the fundamental component by using a low pass filter.An analytic version is obtained by using the Hilbert filtering.The obtained frequency is filtered as in [9].After that the vibrato parameter is estimated.
Another method is using minima and maxima detection.Local maxima of the f0 trajectory are detected and precisely pinpointed by interpolation.All the temporal distances between two successive local maxima are calculated.Then variance of these distances is computed as well as the number of distances comprised between 0.15 s and 0.25 s (which correspond to a 4 Hz to 7 Hz vibrato).The same processing is done for the local minima.In the presence of a vibrato, both variances have low values and the quantity of similar distances is high.More details concerning the method can be found in [10].
The approach presented in [11]is taken as a basis for the experiments provided here.The method uses the pitch contour calculated for each recording.The FFT and the autocorrelation of the contour are then calculated.Subsequently, a series of features are extracted from these two values, and then different statistical methods are applied.More precisely the method and modifications are described in Section 4.
3.Conditions of the Research
3.1 Examined Group
In the study samples of singing recorded by singers from The Jan Szyrocki Academic Choir of West Pomeranian University of Technology in Szczecin (Poland)have been used.The recorded singers represent different levels of advancement.It should be noted that all of them have passed an initial period of singing training.Most of the singers represent the intermediate group with several years of singing experience.Several people have musical education (not in the field of singing).One person has an education in the vocal.
3.2 Conditions of Recordings Acquisition
Appropriate equipment was chosen for the recording of the singing.The studio was acoustically modified to get rid of voice reflection and reverberation.This was achieved with the use of special sound-absorbing foam panels with an appropriate geometric profile and acoustic parameters.The capacitor microphone AT 4050 was connected to audio interface MOTU 896 MK3 and placed in the operator’s compartment.The audio interface was connected to a computer equipped with the software Sony Sound Forge 10 and Samplitude Pro.
All of the sound material was recorded with a 24-bit resolution, with the frequency of sampling at 96 kHz,which gave unlimited possibilities of editing the recordings.As a voice production session was recorded as a whole for a particular singer, the division into elementary parts, called sequences or phrases (piano, singer), was done with use of a tool for automatic segmentation, under supervision, which was created in the Matlab environment.
3.3 Developed Database
The task of the paper is to create a database in the frame of a research project of West Pomeranian University of Technology: “Computerized methods of supporting the process of training choir voices”.We decided to use the sound material of choir voices for the project.The reason was the necessity of having a database which would represent the abilities of choir voices as a specific class of voices.We assume that there are certain parameters of singing, which may be measured irrespectively, on what is being sung, and that these parameters are influenced by what is being sung.
Five vocal exercises were recorded as material for assessing the quality of singing.The exercises were selected from a set usually used during vocal trainings.The most important features for particular exercises are: the text,sound scheme in reference to the key of C-major, and the approximate tempo of the performance of the exercise.Exercises have been chosen to allow determination of the problems with various singing parameters.The problems may be caused by the sung intervals, text or just vowels.
4.Proposed Method
The proposed approach is based on that presented in[11].Subsection A gives a description to the method in [11]and Subsection B presents the extension of the method for our experiments.The extended approach has been completed with a number of changes and made possible carrying out the estimation of vibrato on samples of any duration.In this version, it is possible to estimate the vibrato for samples other than those sung at the same height.The improved version of the analysis is carried out on the windows and the corresponding inference allows to estimating the correct value of vibrato.
4.1 General Method
The method in [11]was based on the fact that vibrato is a periodic modulation of fundamental frequency, which is mostly found to be closely sinusoidal.A pitch detection algorithm (extraction of fundamental frequency) was based on the autocorrelation method[12].The F0 detection was performed over successive windows weighted with a Hamming window function.The autocorrelation function over each window was then interpolated.The obtained resolution of the peak determination was 0.12 Hz (0.23 cents), which is not distinguishable by a human ear.For the analysis, recordings longer than 2 s were used and it resulted in 200 pitch points for each analysis.Each pitch contour file was inspected visually and corrected where necessary because of possible errors of pitch detection algorithm (the pitch halving or doubling).The authors have pointed out that most of the methods for vibrato estimation give good results for trained voices but not for amateur singers.The large variability in pitch contours produced by the beginner singers made it necessary to increase the efficiency of the basic method by more general measures that would be able to detect whether vibrato exists at all,and assesses its quality if present.The methods originally used for detecting F0 were employed for this purpose as the vibrato is a periodic oscillation of F0.After that contour autocorrelation and the Fourier transform were calculated for the F0.The autocorrelation and the spectrum contours were treated then as data, from which meaningful features can be extracted.Those features are extracted to make more reliable the judgment process and then the estimation.After visual inspection of the results, the 10 hypothetical features describing the vibrato feature in the analyzed signals were defined by the authors.The measures were analyzed statistically in order to find a predictor that would correlate well with the judges’ average rating of the recordings.Using a linear regression analysis with a forward selection process, a total set of entry features was reduced to the 5 describing vibrato:
1) Absolute height of highest peak above 2 Hz in the FFT of the pitch contour,
2) Energy between 4.5 Hz and 7.5 Hz,
3) Location of first autocorrelation peak,
4) Energy of main spectral peak divided by its width,
5) The number of spectral peaks above one quarter of the highest peak.
Using above features on FFT of the pitch contour and on contour of the autocorrelation makes possible to judge a presence and the quality of vibrato.The set of features can be applicable for identifying presence of vibrato and for assessing its quality even in case of unclear periodicity in the signal.
4.2 Extended Approach
The method has been adapted to the operating conditions in a variety of exercises.The emission exercises analyzed here are similar to the real way of singing.Most of the examples from literature have analyzed the phone“a” sung at one tone.Mostly, the analyzed singers were people with extensive experience in singing.The singers analyzed here are not professionals as they are members of academic choir.In this group, there are also people who are just beginning to learn singing.The approach states that the samples studied here are close to the real conditions present during singing.It uses special database containing a series of exercises that allow highlighting the vocal problems.The presence of both the beginning and intermediate singers as well as the complexity of exercises made it necessary to extend the adapted approach to analysis of the vibrato.
An important change in the vibrato estimation is the two-pass calculation process of the fundamental frequency which is the base of the process of vibrato calculation.An implementation of autocorrelation method according to [13]has been used here.The first pass of the two-pass F0 calculation is a wide range calculation to determine the dominant frequency in the signal (median).
After the dominant frequency is found with a well-configured hardware and after eliminating noise from the environment, it is possible to narrow the range of F0 search.The second pass is done in a small range from the previously found median of F0.It should be done by selecting the range around the expected sound, for example:400 Hz to 480 Hz (+/- 40Hz) for the expected sound “a” in the fourth octave (which is 440 Hz).The search range for the second pass is empirically chosen to give more accurate results and avoid manual inspection of the intermediate results.
In summary, the both calculation passes use the same method of F0 estimation.Before the F0 calculation, the range of frequencies which will be searched should be considered.It is closely related to the conditions in which the recording took place, the equipment and the pitch to be sung.
In case the environmental conditions are not known in advance, it is advised to set the minimal frequency of search to, at least, 60 Hz.It is because the sung sound usually has frequency higher than 50 Hz.This will help to eliminate some problems, which could be affected by power supply with 50 Hz frequency.In practice, the lowest voice (bass) should not sing lower than 82 Hz (E2)[14].
To calculate F0 first, the signal is divided into the frames of a corresponding length.A frame length cannot be shorter than the wave period corresponding to the lowest frequency in the range in which the F0 is calculated.The calculation starts with the estimation of the simple autocorrelation matrix for each subsequent frame.For a single-channel signal subjected to analysis, the matrix is a vector.Applying the fast Fourier transform (FFT) and the inverse fast Fourier transform (IFFT), we have
where R is an autocorrelation matrix, y is the input signal,and N is the number of frequency components.
In accordance with the recommendations in [15], the appropriate number of frequency components in the transform should be specified to avoid the errors associated with the IFFT processing.To do that, it is proposed to use the power of 2 as
where N is the number of frequency components of FFT,P=nextpow2(2M-1) which returns the exponents for the smallest powers of two that satisfy 2P>=|2M-1| for each element in 2M-1 vector and M is the length of input vector.
The next step is the calculation of the range boundaries by using

where P is the position of frequency component in vector of signal, Fsis the sampling frequency of signal, and F is the searched frequency.
The maximum value of the autocorrelation function within the range shall be considered as the equivalent to the basic tone frequency (for a given range).The resulting F0 value is the median value of all the frequencies calculated for all the frames in the range.
Fig.1.Process of vibrato estimation for one frame.
Fig.2.Process of vibrato estimation for one frame.
As mentioned above, the same process of F0 calculation is used twice to prepare precisely data for vibrato calculation.
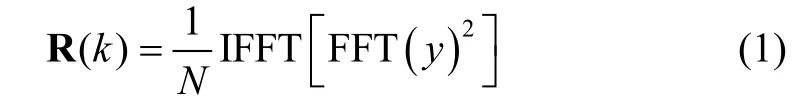
The next step is the elimination of the trend of pitch(singing melody and singing imperfections in terms of melody) in F0 trajectory.To do this the local average values of F0 are subtracted from F0.On the resulting waveform, significant peaks are detected and are eliminated by interpolating them with the neighbors belonging to the“proper” trajectory.Finally, the autocorrelation waveform of the so-prepared fundamental frequency F0 is calculated as in [12].Then the contour of autocorrelation is calculated for the Fourier transform of F0.The process is partially presented on Fig.1, which shows various stages of the calculation of vibrato in a graphical way.The first line in Fig.1 contains the analyzed field frequency signal, the second one shows the basic tone deviation values from the mean, and the third one is the graph of autocorrelation.The last line is the fundamental frequency of oscillation in the range of 0 Hz to 10 Hz, with marked local maxima.The highest maximum is identified as the value of frequency vibrato around 6 Hz.
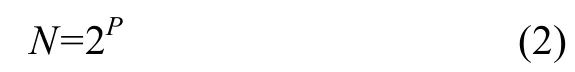
On the contrary, the reference method, for the same signal as presented on Fig.1, gives the highest maximum out of range of 10 Hz (which is rejected as invalid vibrato value) and the higher peak below 10 Hz is low and ignored as unimportant value.Fig.2 shows the result obtained using reference method.
The reference approach which uses one vowel phrase to estimate the vibrato is not suitable for analyzing the samples used in this paper, because it returns only single value for the entire audio file.The signal analysis method proposed in this paper allows assessing changes of vibrato over the time according to changes of vowels.The comparison shows that the changes in sung phrase in fairly short period of time can cause the apparent imbalance of fundamental frequency.The imbalance causes higher value of vibrato in reference method than that estimated in the proposed one.
In the proposed method, the oscillation of fundamental frequency for the entire sample is analyzed.The analysis is performed over successive 1 s windows with overlap of 25 ms.Moving windows with such a small overlap makes it possible to avoid the problems caused by noise and makes it possible to observe the vibrato during various changes(for example during change of the type of phoneme while singing single tone).
In the next steps, like in [11], additional features are extracted to detect and estimate vibrato reliably.In the next stage, an attempt is made to assess whether vibrato or only errors related to the intonation are estimated.The solution was found by estimating vibrato for different hypothetic parameters and comparing the results to the evaluation made by experts.Some of the tested parameters were the same as in the method mentioned in Section 4.1.A new and important parameter was named “level of confidence”.It is a value that specifies the percentage of the analyzed F0 segments in which vibrato must be detected.Another factor was the minimum value of vibrato, which can be heard by the experts.In [3]and [16], an average vibrato rate of 6.0 Hz was shown.Knowing this and basing on expert’s knowledge, the algorithm was adjusted to find the vibrato values within the range of 2 Hz to 10 Hz (+/-4Hz) to cover wide range of expected values.
Fig.3 shows the signal (top) and estimated trajectory(bottom) of vibrato on the sound file containing the sequence of phonemes “a-e-i-o-u” sung on one pitch.It can be observed that the vibrato value varies for different phonemes.For example, it can be seen how the sound “o”decreased the value of vibrato in the case of that particular singer.
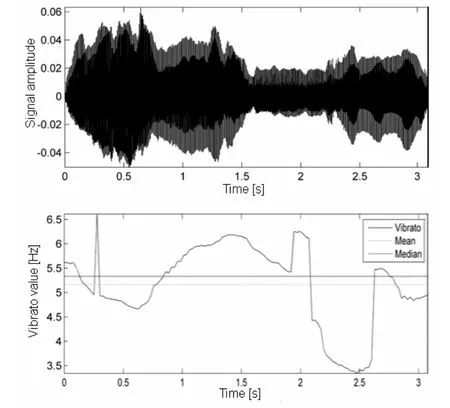
Fig.3.Result of vibrato estimation for a sung sequence.
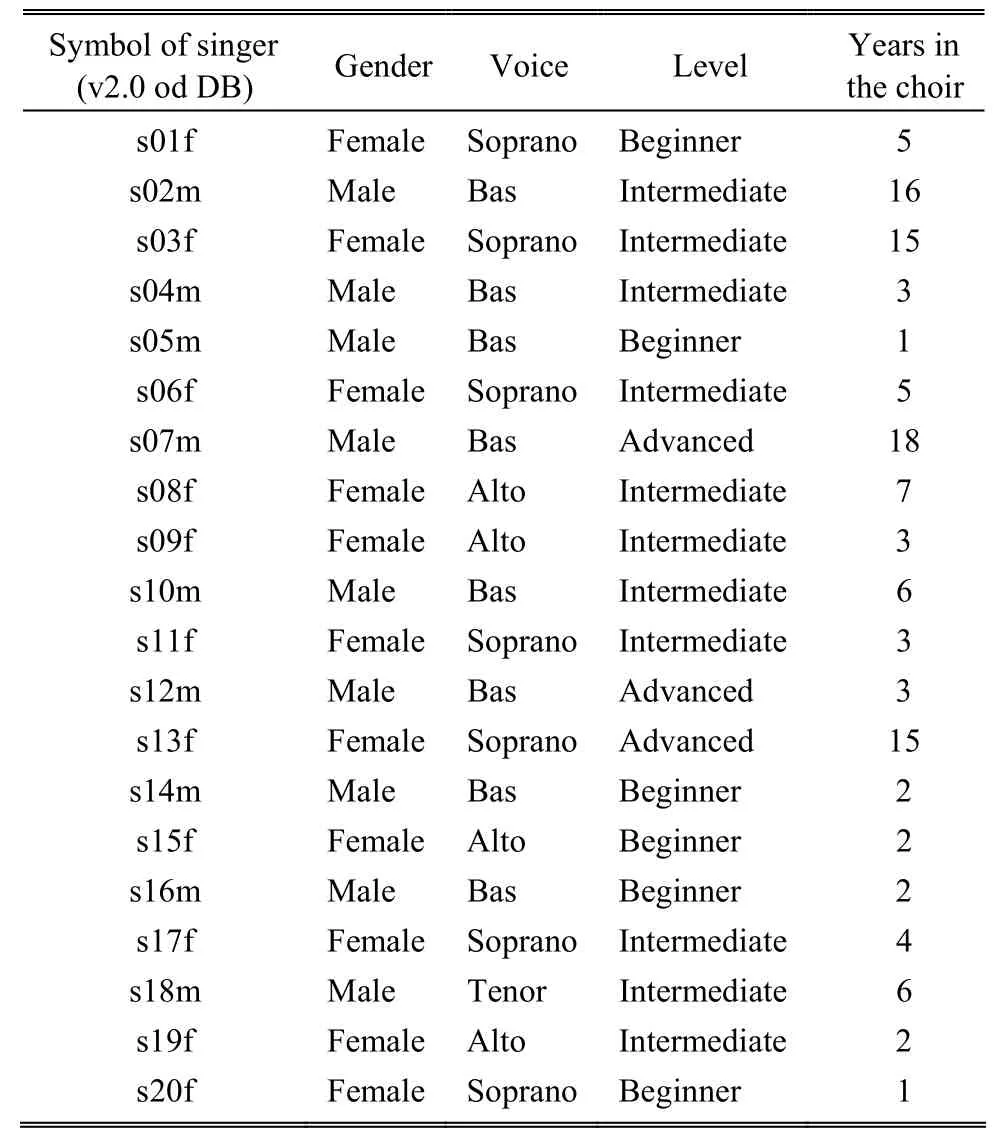
Table 1: Set of examined group
5.Experimental Results
During the study, a group of 11 women and 9 men were assessed.They represented different levels of advancement in the technique of singing as shown in Table 1.
Table 1 shows the characteristics of the analyzed group including gender, type of voice, level of advancement, and the number of years in the choir.The advancement was assessed subjectively by an expert (instructor of voice production).
For the research samples of exercise, E01 from the database was used.Exercise E01 is consisted of singing vowels "a-e-i-o-u" at one pitch.The sequence lasted about 3 s to 4 s.
Exercise E01 was chosen because it is sung at one pitch on the one hand and introduces an obstacle, on the other hand, for the singer in the form of changing vowels.This situation is similar to the real conditions of singing.It is assumed that a person with higher vocal skills will keep the singing parameters more stable, including vibrato parameter.The vibrato parameter was assessed separately for men and women.The calculations were carried out for exercises sung on successive pitches to the extent consistent with the person’s capabilities.
In addition to the visual assessment of the stability of vibrato and vibrato charts, for all the samples for an individual person the following parameters were also evaluated:
- mean confidence value of vibrato (MCV),
- standard deviation of confidence of vibrato (STDCV),
- mean value of vibrato (MV),
- standard deviation of vibrato (STDV).
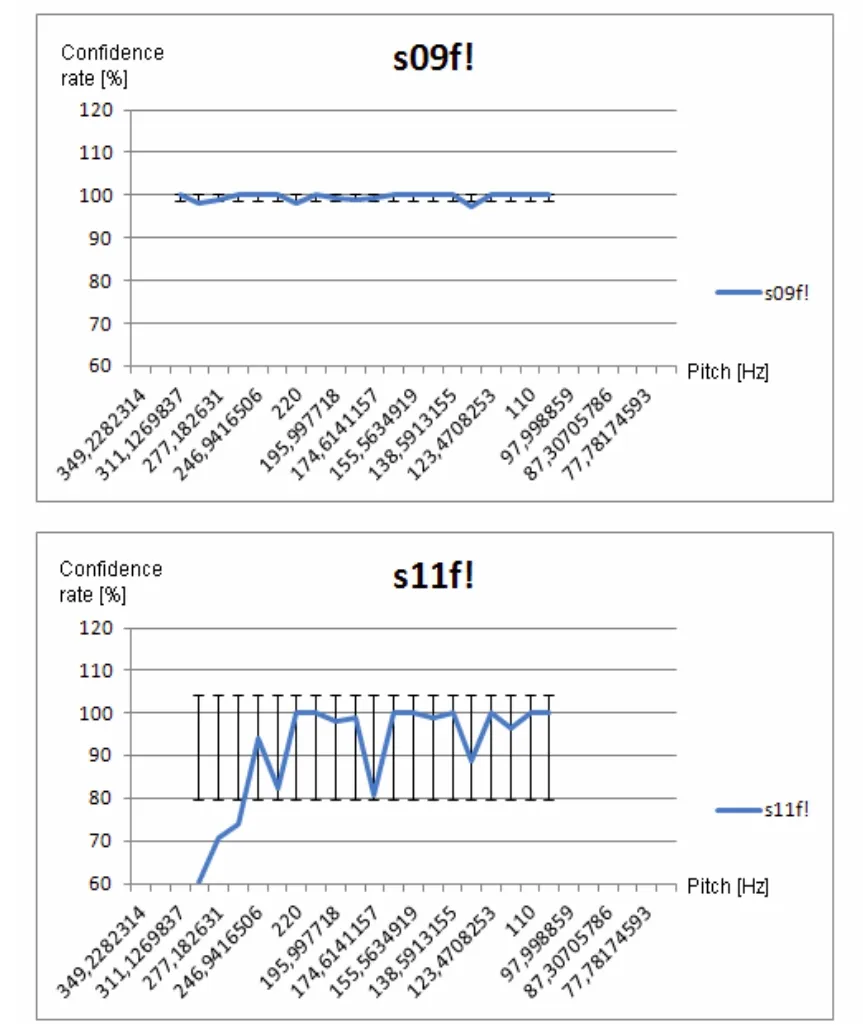
Fig.4.Confidence of vibrato for two example female voices.
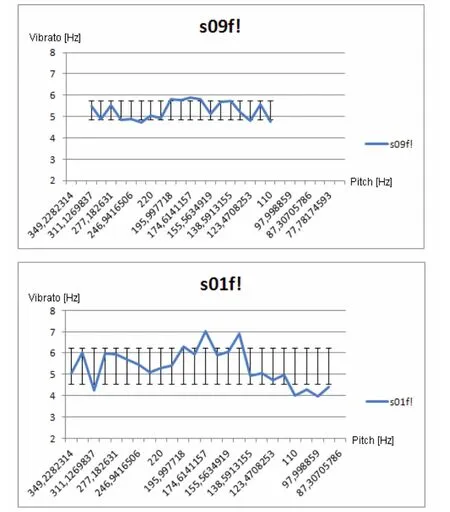
Fig.5.Vibrato estimation for two example female voices.
The confidence of vibrato is here understood as a percentage of the number of frames in the analyzed sequence for which the vibrato was assigned.The example results of confidence of vibrato for the group of women are shown in Fig.4.
The graphs show how a particular person copes technically with maintaining vibrato at different pitches.Fig.4 illustrates the estimation of vibrato confidence for two greatly distinctive cases.In the case of s09f, there is a high confidence in the estimated vibrato.s11f person probably has problems with the stability of this parameter.This may be caused by voice trembling resulting from nervousness or poor vocal technique.
More comprehensive assessment of quality of vibrato in singers is possible during the observation of vibrato parameter specified for each person for the consecutive singing sequences.It appears that the person s09f maintains constant vibrato throughout the tonal range.s11f person achieves a similar effect but with much less certainty and in lesser tonal range.The s09f person should therefore be classified higher than s11f.To illustrate the differences in the stability of the vibrato Fig.5 is presented.
The figure shows how different the skills of example persons are.The women and the men were evaluated in a similar manner.Due to the lack of possibility of inclusion of all the received graphs, the collected results of statistical evaluation determined for previously obtained results for the vibrato and its confidence are presented in Table 2.
The reliable assessment of the singers on the basis of a single value specifying the mean and standard deviation is probably impossible.
The table shows that the singers represent equaled level.For each person, the vibrato parameter was detected in the common range for singers.This means that the evaluated persons are good choristers and are not soloists.In the case of soloists, the vibrato should exceed 6 Hz.The average value of vibrato shown in the table is close to 5 Hz.There were a few singers whose vibrato approached the frequency of 6 Hz, but the confidence of vibrato (presented by the STDCV parameter) was low.For higher values of this parameter, it should be considered that the increase in the value of MV (mean vibrato) could be affected by voice tremor associated with nervousness.
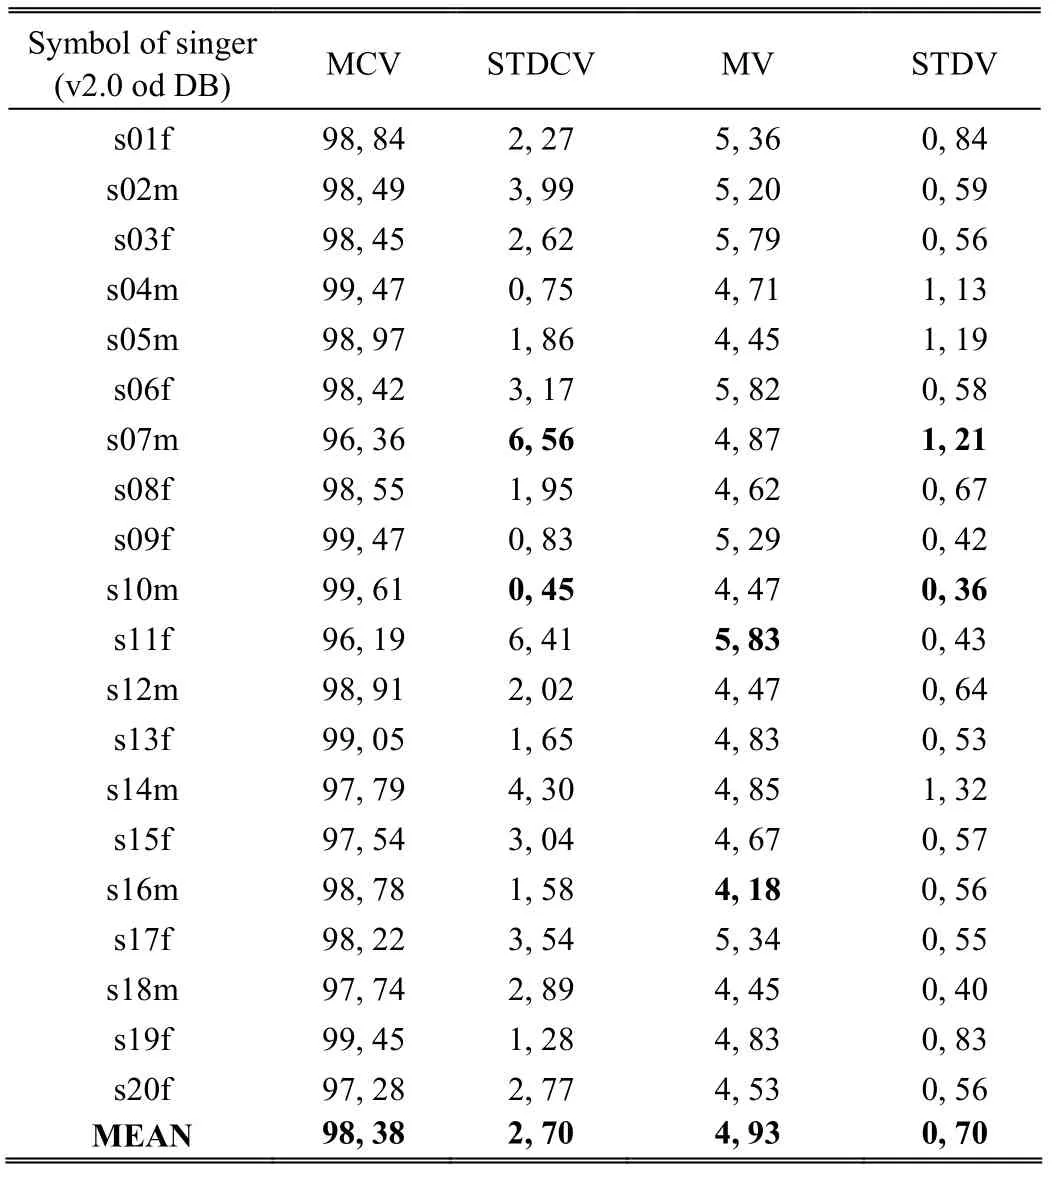
Table 2: Statistics of vibrato feature
6.Conclusions
This paper presents an approach to assessment of the quality of singing in the context of vibrato parameter.To achieve the goal, a method for measuring the vibrato,functioning in conditions similar to the real singing, is necessary.To this end, the method using determinate F0 trajectory and determining vibrato by autocorrelation method was adapted.The estimation of vibrato has been reinforced by an appropriate choice of parameters, ensuring that the measured values are the values of vibrato.It is possible to determine additionally the level of certainty at a given degree of acceptance.
The observation of the results leads to the conclusion that in order to assess the singers reliably, the results should be analyzed in a broad context.In addition, it is necessary to take into account the type of voice and the related tonal range of sung notes.In this context, the results may be distorted in the case that the singer sang out of range of abilities.
The results obtained in such a case indicate vocal problems.On the other hand, the developed method allows finding a range of vocal abilities and strengthening the process of assigning the singer to the right type of voice.
The developed approach aims at the assessment of choral voices.We have demonstrated that the members of a group from choral singers keep the correct mean value of vibrato parameter but not all singers present the same quality of the parameter in terms of STDCV.Additionally,thanks to the developed method, more valuable observations can be made.
[1]L.Regnier and G.Laurent, “Singing voice detection in music tracks using direct voice vibrato detection,” in Proc.of ⅠEEE Ⅰnt.Conf.on Acoustics, Speech and Signal Processing, Paris, 2009, pp.1685-1688.
[2]V.Verfaille, C.Guastavino, and P.Depalle, “Perceptual evaluation of vibrato models,” presented at the Conf.on Interdisciplinary Musicology, Montreal, 2005.
[3]E.Prame, “Measurements of the vibrato rate of ten singers,”Journal of the Acoustical Society of America, vol.96, no.4,pp.1979-1984, 1994.
[4]R.Timmers and P.Desain, “Vibrato: Questions and answers from musicians and science,” presented at Int.Conf.on Music Perception and Cognition, Staffordshire, 2000.
[5]P.Herrera and J.Bonada, “Vibrato extraction and parameterization in the spectral modeling synthesis framework,” presented at Digital Audio Effects Workshop,Barcelona, 1998.
[6]X.Serra, “A system for sound analysis/transformation/synthesis based on a deterministic plus stochastic decomposition,” Ph.D.Dissertation, Dept.of Music,Stanford University, 1989.
[7]W.Hess, Pitch Determination of Speech Signals, Berlin:Springer-Verlag, 1983.
[8]S.Rossignol, P.Depalle, J.Soumagne, X.Rodet, and J.-L.Collette, “Vibrato: detection, estimation, extraction,modification,” presented at Digital Audio Effects Workshop,Trondheim, 1999.
[9]S.Kay, “Statistically/computationally efficient frequency estimation,” in Proc.Ⅰnt.Conf.on Acoustics, Speech, and Signal Processing, New York, 1988, pp.2292-2295.
[10]S.Rossignol, X.Rodet, J.Soumagne, J.L.Collette, and P.Depalle, “Automatic characterization of musical signals:Feature extraction and temporal segmentation,” Journal of New Music Research, vol.28, no.4, pp.281-295, 1999.
[11]A.Noam, M.Orit, and A.Ofer, “Acoustic and perceptual assessment of vibrato quality of singing students,”Biomedical Signal Processing and Control, vol.1, no.2, pp.144-150, 2006.
[12]P.Boersma, “Accurate short-term analysis of the fundamental frequency and the harmonics-to-noise ratio of a sampled sound,” in Proc.ⅠFA, vol.17, pp.97-110, 1993.
[13]X.Huang, A.Acero, and H.-W.Hon, Spoken Language Processing: A Guide to Theory, Algorithm, and System Development, New Jersey: Prentice Hall, 2001.
[14]C.T.Herbst, E.Duus, H.Jers, and J.G.Švec, “Quantitative voice class assessment of amateur choir singers: a pilot investigation,” Ⅰnt.Journal of Research in Choral Singing,vol.4, no.1, pp.47-59, 2012.
[15]S.J.Orfanidis, Optimum Signal Processing: an Introduction 2nd ed.New Brunswick: Rutgers University, 2007.
[16]S.Anand, Judith M.Wingate, B.Smith, and R.Shrivastav,“Acoustic parameters critical for an appropriate vibrato,”Journal of Voice, vol.26, no.6, pp.820.e19-820.e25, 2012.
杂志排行

Journal of Electronic Science and Technology的其它文章
- FPGA-Based Network Traffic Security: Design and Implementation Using C5.0 Decision Tree Classifier
- Characterization of Fundamental Logics for the Sub-Threshold Digital Design
- Saudi License Plate Recognition Algorithm Based on Support Vector Machine
- Mobile Web Middleware of NFC Context-Awareness Applications
- Metamaterial Absorbers in Terahertz Band
- Broadcasting with Controlled Redundancy and Improved Localization in Wireless Sensor Networks