An experiment to estimate the revolution of DC motor
2013-11-01AcharyaPrajapati
N K Acharya, A N Prajapati
(Applied Physics Department, Faculty of Technology and Engineering, The Maharaja Sayajirao University of Baroda, Vadodara-390001, India)
An experiment to estimate the revolution of DC motor
N K Acharya, A N Prajapati
(Applied Physics Department, Faculty of Technology and Engineering, The Maharaja Sayajirao University of Baroda, Vadodara-390001, India)
In this paper we have reported a simple and cost effective lab level experiment to determine the revolution of DC motor at various voltages. This experiment is designed on the basis of laser light pulses observed in cathode ray oscilloscope (CRO) output through an aperture. These output waveforms are directly related with the revolution of DC motor. A laser light beam was allowed to pass through a slot attached with the shaft of DC motor. The outcoming light is in the form of light pulses that falls on the photodetector which was connected to CRO. The frequency of light pulses is the function of applied voltage to DC motor. The CRO output was measured at different voltages. The visual waveforms on CRO interpret the different values of revolutions per minute (rpm) at different values of voltages given to DC motor. Analysis was made to determine the voltage depended revolution.
cathode ray oscilloscope (CRO); revolution; DC motor; laser source; photodetector
0 Introduction
The main objective of performing this experiment is to measure the speed or revolution per minute (rpm) of DC motor using easily available laboratory equipments. The equipments required to perform this experiment are usually available in any undergraduate/postgraduate laboratory. One can perform easily without procuring additional equipments. The idea is innovative because the people are using various methods including, tachometer, stroboscope and microchip (PIC16F877a) based electronics to measure rpm of DC motor[1]. This is first proposed cost effective laboratory method to determine the rpm of DC motor by using laser beam and oscilloscope. Because of the distinct properties, laser beam has variety of applications to characterize the physical parameters for verities of systems. Gogoi et al proposed an experiment to determine the size of nanoparticles using scattering of laser light[2].
A DC motor has different characteristics including speed of motor and the most conventional unit of measuring the speed of a motor is in rpm. This stands for revolutions per minute, or the number of times the motor’s shaft will rotate in one minute. Analogous to this is the second hand on a clock. It rotates the circumference of the clock once a minute, at a speed of 1 rpm. The typical rpm range of most DC motors is from 3 000 to 8 000. Although it may seem that a higher speed is advantageous, this is not always the case. Depending upon required application, for robots with slow responding reactors, a higher than normal rpm speed may cause discordance with the brain, and thus malfunctioned responses. For instance, cooling fans normally have rpm speeds ranging from 3 000 to 6 500, which are considered very fast. On the other hand, robot arms doing precision work operate below 50 rpm. For this purpose some stepper arrangements are to be required[3]. These arrangements will reduce the rpm value upto a certain limit.
There are several devices and methods available to measure the rpm of a given motor. When electric current passes through a coil in a magnetic field, the magnetic force produces a torque which turns the DC motor. A stroboscope, also known as a strobe, is an instrument used to make a cyclically moving object appear to be slow-moving, or stationary. The principle is used for the study of rotating, reciprocating, oscillating or vibrating objects. Machine parts and vibrating strings are common examples. A more accurate and conventional method of measuring rpm is using a device called a tachometer, which can precisely measure the speed of up to thousands of rpm. There are namely two types of tachometers, the “contact” and “non-contact” tachometers. The contact tachometer is physically attached to the motor shaft, thereby reducing the speed, and providing an inaccurate rpm reading. The non-contact tachometer utilizes a brightness sensor that detects rotations. For instance, when a motor spins with a black-white colored disc attached to the shaft, the tachometer flashes the rotating disc with an light-emitting diode(LED) and can “see” the varying light reflection from light to dark, through its brightness sensor. A chip measures the time for a light to dark to light progression, and thus the rpm speed[4].
DC motors that are used in feedback controlled devices are called dc-servomotors[5-8]. Applications of dc-servomotors abound, e.g., in robotics, computer disk drives, printers, aircraft flight control systems, machine tools, flexible manufacturing systems, automatic steering control, etc. DC motors are classified as armature controlled dc-motors and field controlled dc-motors[8].
The cathode ray oscilloscope (CRO) is a common laboratory instrument that provides accurate time and amplitude measurements of voltage signals over a wide range of frequencies. Its reliability, stability and ease of operation make it suitable as a general purpose laboratory instrument. Oscilloscopes are commonly used to observe the exact wave shape of an electrical signal. In addition to the amplitude of the signal, an oscilloscope can show distortion, the time between two events (such as pulse width, period or rise time) and relative timing of two related signals[9].
Methods available to determine the rpm of an electric motor are very expensive. This laboratory experiment will focus on the determination of rpm of DC motor in simpler way by using laser beam and oscilloscope. In present work we proposed a simple cost effective experiment to measure the rpm of dc motor with the innovative idea. One can measure and compare the rpm value at different voltages. The outputs on CRO are very interesting and give the clear and distinguishable value in visual form. The main advantage of this method is that it is cost effective.
1 Experimental details
Most of the equipments used for the present experiment are common for an undergraduate or post graduate laboratory. Systematic data gives well support to theory and one can estimate the rpm of any electrical motor. No previous literature is available by using the proposed technique to determine the rpm of an electric motor. Here, we propose a lab scale experiment which was performed at department of Applied Physics, The M. S. University of Baroda. The experiment requires various apparatus that are usually available in laboratory i.e. A He-Ne laser source with its standard power supply, a DC motor, a 1.5-12 V variable DC power supply, a CRO, etc.
In present proposed work, A He-Ne Laser (2.0 mW, Red 632.8 nm) supplied from Jain Lasertech Pvt. Ltd. Mumbai was used for the present experiment. The typical laser parameter named beam diameter and beam divergence of given He-Ne Laser was 1.0 mm and 1.0 mrad, respectively. We estimated spot size of laser beam around 1.5 mm from three independent readings at 600 mm distance. Caddo-804, 2-channel and 4-trace high sensitivity microcontroller based digital CRO supplied by scientech Technology Pvt. Ltd., Indore (India) was used to record the output of the photodiode. A circular disc having a small slot was attached with the shaft of dc motor. This slot is allowed to pass the laser beam, while motor was connected through variable power supply. The laser beam after passing through the slot falls on a photodetector. The output of photodetector was set as the input of CRO. The schematic of experimental arrangement is shown in Fig.1.

Fig.1 Schematic of experimental arrangement to determine the rpm of DC motor
2 Results and discussion
2.1 Observed rpm of DC motor
Usually DC motors have almost linear characteristics with their speed of rotation being determined by the applied DC voltage and their output torque being determined by the current flowing through the motor windings. The speed of rotation of any DC motor can be varied from a few revolutions per minute to many thousands of revolutions per minute making them suitable for electronic, automotive or robotic applications.
In the present study we have observed the different outputs and analyze them using standard formula. The frequency (rpm) is calculated by using the time scale between two consecutive peaks appear on CRO screen at a particular voltage and the corresponding speed of DC motor, rpm has been calculated. The output on CRO is clearly distinguishable for different voltages applied to the DC motor. The peaks were well separated and readable through CRO scales. It was found that the time scale between two consecutive peaks varies from 60 ms i.e. for 1.5 V to 15 ms, i.e. for 10.5 V. As the applied voltage increases, the distance between two consecutive peaks decreases that gives an increase in the speed of motor. The photographs of various visual outputs are shown in Fig.2.

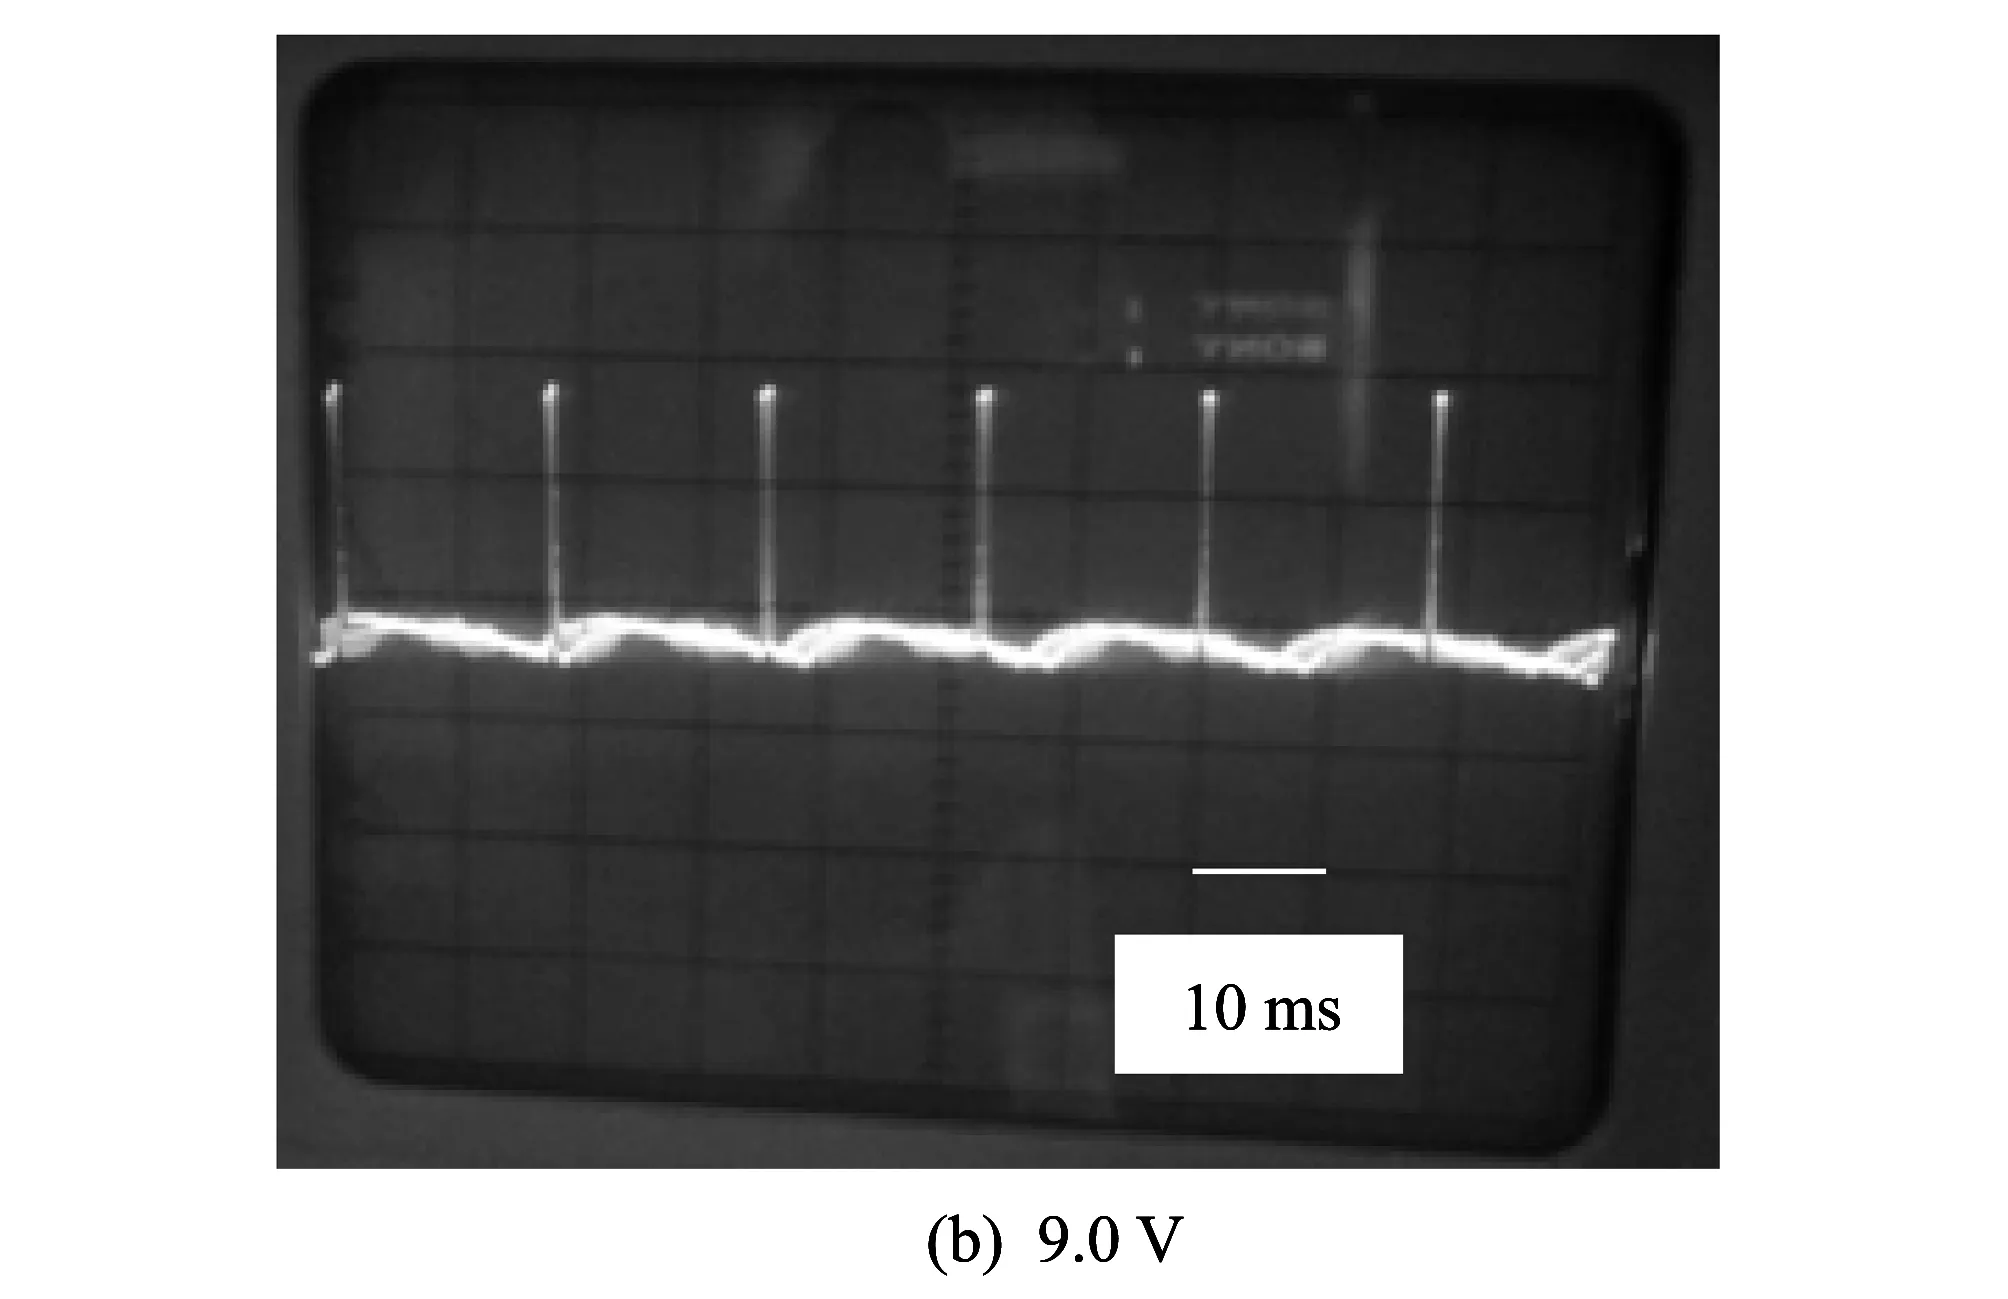
Fig.2 CRO output signals
The data observed from CRO has been verified by photograph images using the scientific software GetData version 2.21. These are in well agreement with the observed data. The peak difference was direct observed and noted for various applied voltages. The time scale was chosen such that the minimum two peaks can be visualized on CRO screen. This is as obvious to measure the revolution of dc motor at that particular applied voltage. The data of frequency and rpm at various voltages, from 1.5 V to 10.5 V with the voltage interval of 1.5 V is given in Table 1.
It was found that the rpm value varies from 1 000 (at the lowest voltage, i.e. 1.5 V) to 4 000 ((at the highest voltage, i.e. 10.5 V). It is obvious that as we increase the input applied voltage to DC motor, the corresponding rpm value of dc motor increases. This increment behavior is linear within the range of voltage value taken for measurements.

Table 1 Rpm of DC motor at different voltages
2.2 Statistical approach
We have used a simple statistical approach to analyze the obtained results. Fig.3 shows the graph of observed rpm value versus the applied voltage.

Fig.3 Graph of revolution per minute versus the applied voltage. (a) Linear fitting of observed data; (b) Linear fitting through origin
Fig.3 shows the linear dependence of rpm on voltage which is obvious within the range of a certain applied voltage. We made the calculation in two distinct ways (a) linear fitting of experimentally observed data and (b) linear regression of observed data by using standard scientific software Origin 6. It is assumed that at 0 V input the DC motor does not give any output to CRO, It means revolution at 0 V is to be considered as zero. Statistically, it gives a value which is negligible as compared to the any of aqplied voltage. In this case, it should follow the following linear relationship as
where Y is the rpm of DC motor and X is the applied voltage. From Fig.3(a), it can be got Y=488.09+328.37X. In simple linear fitting, we found that the value of intercept is 488.09 and the slope is 328.37 rpm/V. Statistically, the intercept value (488.09) indicates the rpm of DC motor at 0 V, but experimentally it is not possible because at this moment the voltage/current combination is not enough to produce torque in the shaft of DC motor. Hence practically no CRO output has been observed at 0 V. On the other hand, when the data are fitted linearly and passes through origin, the value of slope is 355.48 rpm/V. In this situation the, data obey the following relation
where Y is the rpm of DC motor and X is the applied voltage. From Fig.3(b), it can be got Y=355.48X, both the slopes of data are in close proximity indicate the linear relationship between rpm and applied voltage. Howeves, the linear relationship between rpm of a DC motor and applied voltage is followed after a certain voltage and also up to a certain voltage. This voltage range is the characteristics of a DC motor.
3 Conclusion
This simple and cost effective experiment is very easy to perform in any undergraduate or postgraduate laboratory. The visual output on time scale of CRO gives the idea about the rpm of DC motor. The rpm of DC motor depends on the input voltage applied to DC motor. Increase in rpm value by increasing the applied voltage is the characteristics of DC motor within a given voltage range. This technique is applicable for determining the rpm of any electric motor in ease and within the limiting ranges of the used equipments.
[1] Liptak B G. Instrument Engineers' Handbook: Process Control and Optimization. CRC Press, 2005: 2464.
[2] Gogoi A, Ahmed G A, Choudhury A. Nanoparticle size characterization by laser light scattering, Indian Journal of Physics, 2009, 83(4): 473-477.
[3] Gottlieb I M. Electric Motors & Control Techniques. 2nd edition. 1994.
[4] Lander C W. 8 DC Machine Control// Power Electronics. 3rd edition. Mc Graw Hill International UK, London, 1993.
[5] Bolton W. Mechatronics: electronic control systems in mechanical and electrical engineering. Addison Wesley, New York, 1999.
[6] Dorf R C, Bishop R H. Modern Control Systems. Addison Wesley, CA, 1998.
[7] Kuo B. Automatic Control Systems. Prentice-Hall, Englewood Cliffs, NJ, 1995.
[8] Ogata K. Modern Control Engineering, Prentice-Hall, NJ, 1997.
[9] Kularatna N. Digital and Analogue Instrumentation testing and measurement, Institution of Engineering and Technology, 2003: 165-208.
date: 2012-09-29
N K Acharya (sarnavee@gmail.com)
CLD number: TM301.2 Document code: A
1674-8042(2013)01-0010-04
10.3969/j.issn.1674-8042.2013.01.003
杂志排行
Journal of Measurement Science and Instrumentation的其它文章
- Radiation characteristics of ring patch antennas with capacitive feed patch
- Acetonitrile (CH3CN) and methyl isocyanide(CH3NC) adsorption on Pt(111) surface: a DFT study
- Image enhancement and post-processing for low resolution compressed video
- Dynamic calibration method of capacitive pressure measuring device
- Automatic measurement of air-pressure sensor based on two-pressure control instrument
- An analytical model for predicting battery lifetime