A COMPARISON OF REGULARIZED LINEAR DISCRIMINANT ANALYSIS AND MAXIMUM SCATTER DIFFERENCE DISCRIMINANT ANALYSIS ALGORITHMS
2013-10-28LILiGAOJianqiang
LI Li, GAO Jian-qiang
A COMPARISON OF REGULARIZED LINEAR DISCRIMINANT ANALYSIS AND MAXIMUM SCATTER DIFFERENCE DISCRIMINANT ANALYSIS ALGORITHMS
*LI Li1, GAO Jian-qiang2
(1. Department of Applied Mathematics, Nanjing University of Finance and Economics, Nanjing, Jiangsu 210023, China)(2. College of Computer and Information Engineering, Hehai University, Nanjing, Jiangsu 210098, China)
A calculation formula of recognition rate deviation wave (RRDW) is introduced in this paper. Meanwhile, the recognition performance of regularized linear discriminant analysis (RLDA) and maximum scatter difference discriminant analysis (MSD) methods were compared by using different parameters in three UCI data sets. The experimental results show that the recognition performance of RLDA is outperforms MSD under appropriate parameters. In addition, for different K values of K-nearest neighbor classifier (K-NNC), the RRDW of MSD is smaller than RLDA. Therefore, in practical applications, RRDW should be considered as a stable method to handle recognition tasks.
RRDW; parameter selection; classification rate; RLDA; MSD
1 Introduction
Dimensionality reduction and classification of data are important in many applications of data mining, machine learning and face recognition. Many methods have been proposed for this problem, such as principal component analysis (PCA) [1] and LDA [2-3]. PCA is one of the most popular methods for dimensionality reduction in compression and recognition problem, which tries to find eigenvector of components of original data. LDA is one of the most popular linear projection methods for feature extraction, it aims to maximize between-class scatter and minimize within-class scatter, thus maximize the class discriminant. An intrinsic limitation of LDA is that its objective function requires one of the scatter matrices being nonsingular. LDA can not solve small sample problems [4], in which the data dimensionality is larger than the sample size and then all scatter matrices are singular.
In order to overcome the problems caused by the singularity of the scatter matrices, several methods have been proposed [5-7]. Recently kernel methods have been widely used for nonlinear extension of linear algorithms [8-11]. The original data space is transformed to a feature space by an implicit nonlinear mapping through kernel methods. As long as an algorithm can be formulated with inner product computations, without knowing the explicit representation of a nonlinear mapping we can apply the algorithm in the transformed feature space, obtaining nonlinear extension of the original algorithm. Gao and Fan [12] presented WKDA/QR and WKDA/SVD algorithms which are used weighted function and kernel function use QR decomposition and singular value decomposition to solve small sample problems. In addition, by taking advantage of the technology of fuzzy sets [13], some studies have been carried out for fuzzy pattern recognition [14-18]. However, kernel-based and fuzzy methods are very time-consuming for computational complexities.
In addition, a maximum scatter difference discriminant analysis method (MSD) [19] was proposed by Song, which adopts the difference of both between-class scatter and within-class scatter as discriminant criterion, due to the inverse matrix is need not constructed, so the small sample problems occurred in LDA is avoided in nature.
In this paper, the recognition performances of RLDA and MSD are compared with respect to different parameters in three UCI [20] data sets. Meanwhile, the influence of K values also will be studied from K neighbor classifier. The results show that the comparison is very significantly.
The paper of the rest is organized as follows: The review of RLDA method, existing MSD model, and K-nearest neighbor classifier are briefly introduced and discussed in Section 2, Section 3, and Section 4, respectively. A new calculation formula of recognition rate deviation wave (RRDW) is proposed in Section 5. In Section 6, Experiments and analysis are reported. Conclusion follows in Section 7.
2 RLDA

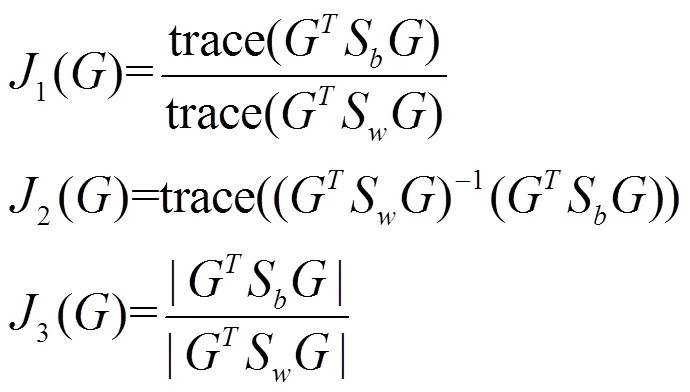
In discriminant analysis, the between-class, within-class and total scatter matrices are defined as follows (see [3, 12, 16]):




3 MSD
From the LDA method, the samples can be separated easily if the ratio of the between-class scatter and the within-class scatter is maximized. In this paper, a maximum scatter difference based discriminant rule is defined as follows [19]:


4 K-NNC
In this subsection, on the one hand, the basic idea of the nearest neighbor classifier is introduced. On the other hand, the basic idea of K-nearest neighbor classifier (K-NNC) is pointed out. The nearest neighbor rule is quite simple, but very computationally intensive. For the digit example database, each classification requires 60,000 distance calculations between 784 dimensional vectors (28×28 pixels). The nearest neighbor code was therefore written in the C programming language in order to speed up the matlab testing.

K-NNC is a nonparametric approach for classification. It does not require the priori knowledge such as priori probabilities and the conditional probabilities. It operates directly towards the samples and is categorized as an instance-based classification method.
5 RRDW
In this subsection, the concept of range is introduced to pattern recognition. Some application can be found in [22-23]. We have been made the appropriate changes for range. In order to assess the merits of the RLDA and MSD model, we establish a recognition rate deviation wave (RRDW) criterion. This calculation is as follows.
RRDW= [(maximum recognition rate-minimum recognition rate)/maximum recognition rate]*100%
6 Experiments and Analysis
The performance of RLDA and MSD algorithms are evaluated on UCI database [20], which namely Iris plants, Dermatology and Wine recognition databases are used for experiments. All experiments are performed on a PC (2.40 GHZ CPU, 2G RAM) with MATLAB 7.1.

6.1 Experiments with Iris plants


Table 1 Classification rates ofIris database (under different parameters)

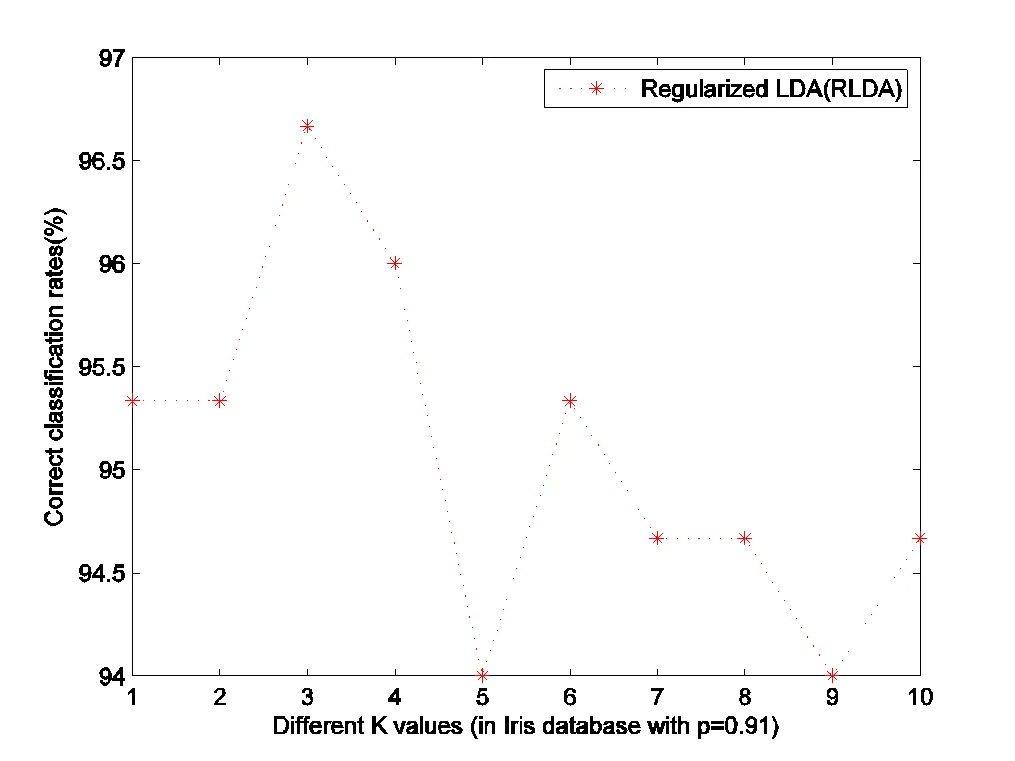
Fig.1 Classification rates of Iris database (under different parameters K ()


According to the RRDW formula, MSD model is more stable than RLDA. However, RLDA is outperforms MSD model based on highest classification rate.

Fig.2 Classification rates of Iris database with different parametersand K
6.2 Experiments with Dermatology
The data set contains 366 instances. Each instance contains 34 attributes. We have deleted the eight samples, which missing attribute values. The number of each class samples is different.


Table 2 Classification rates ofDermatology database with different parametersand KNN classifier (RLDA)
For RLDA and MSD, the classification rates corresponding to parametersare illustrated in figs.3 and 4, respectively.

Fig.3 Classification rates of Dermatology database

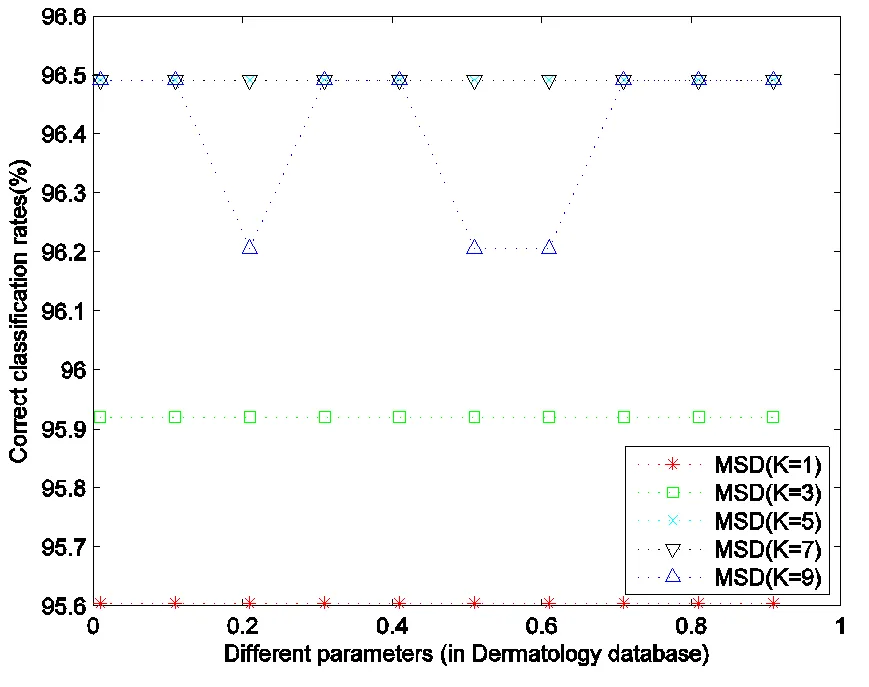
Fig.4 Classification rates of Dermatology database with different parametersand K


According to the RRDW, MSD model is more stable than RLDA. However, RLDA is outperforms MSD model according to highest classification rate.
6.3 Experiments with Wine recognition


Table 3 Classification rates ofWine recognition database (under different parameters)
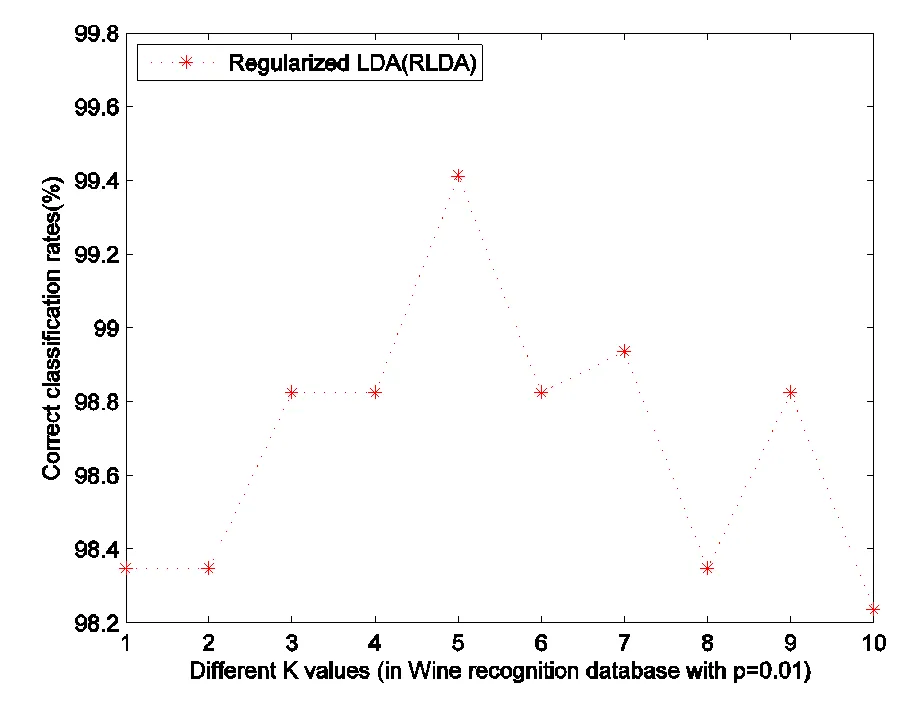
Fig. 5 Classification rates of wine recognition database with different K ()
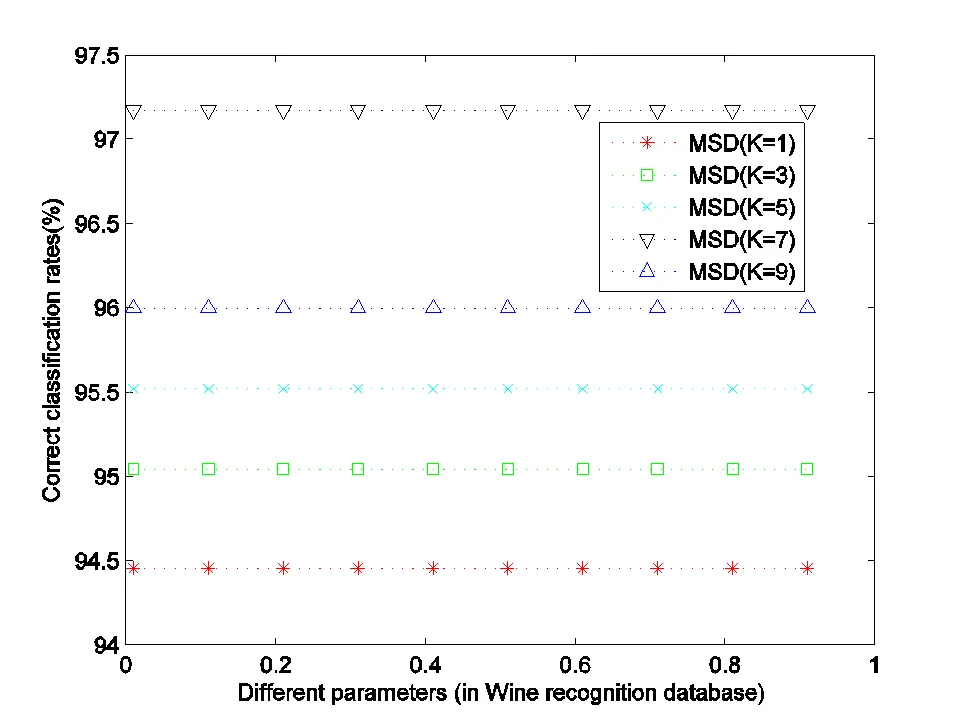
Fig.6 Classification rates of Wine recognition database with different parameters αand K
For RLDA and MSD, the classification rates corresponding to parametersare illustrated in fig.5 and 6, respectively.


It is obvious that the recognition performance of RLDA model is outperforms MSD according to the RRDW and highest classification rate. That is to say the wine recognition data set has less redundant information.
7 Conclusions
In this paper, a comparison of regularized linear discriminant analysis and maximum scatter difference algorithms is proposed for different parameters. We obtained different classification results by applying different criterions. There are different advantages of RLDA and MSD criterions. RLDA needs to compute inverse matrix, however, its classification results is better. And then, MSD does not need to compute inverse matrix, its computational complexity is small. Therefore, the comparison is very significantly.

In Iris plants database we should choose RLDA model and K=3, in Dermatology database we also should choose RLDA model and K=10, in Wine recognition database we also should choose RLDA model and K=5. However, for high dimensional data, in order to reduce computational complexity and obtain a stable method for recognition tasks, we should choose MSD model with more redundant information.
Through the above analysis, we can obtain following conclusions. The model and parameter are determined by applying RRDW formula. Therefore, the comparison of RLDA and MSD models are very significantly.
The future work on this subject will be investigating the influence of model parameter and kernel function in the classification problems. In addition, exploring the new algorithms to solve the corresponding optimization problems also is a further research direction.
Acknowledgement
The authors wish to thank the editor and the anonymous reviewers for a number of constructive comments and suggestions that have improved the quality of the paper. In addition, this work is supported by Graduate Education Innovation Project Fund of Jiangsu Province (CXZZ13_0239), PR China.
[1] Jolliffe I T. Principal component analysis[M]. Second ed., New York:Springer-Verlag, 2002.
[2] Lec H M, Chen C M, Jou Y L. An efficient fuzzy classifier with feature selection based on fuzzy entropy [J]. IEEE transactions on systems, man, and cybernetics B, 2001, 31(3): 426-432.
[3] Gao Jianqiang, Fan Liya, Xu Lizhong. Median null (Sw)-based method for face feature recognition[J]. Applied Mathematics and Computation, 2013, 219(12): 6410-6419.
[4] J Ye, Janardan R, Park C H, et al. An optimization criterion for generalized discriminant analysis on under sampled problem[J]. IEEE transaction, pattern analysis and machine intelligence, 2004, 26(8): 982-994.
[5] Lu J W, Plataniotis K N, Venetsanopoulos A N, Regularized discriminant analysis for the small sample size problem in face recognition [J]. Pattern Recognition Letters, 2003, 24: 3079-3087.
[6] Guo Y Q, Hastie T, Tibshirani R. Regularized linear discriminant analysis and its application in micro-arrays[J]. Biostatistics 2007, 8(1): 86-100.
[7] Zheng W, Zhao L, Zou C. An efficient algorithm to solve the small sample size problem for LDA[J]. Pattern Recognition, 2004, 37: 1077-1079.
[8] Yang J, Jin Z, Yang J, et al. The essence of kernel Fisher discriminant: KPCA plus LDA[J]. Pattern Recognition, 2004, 37: 2097-2100.
[9] Yang J, Frangi A F, Yang J Y, et al. KPCA Plus LDA: a complete kernel fisher discriminant framework for feature extraction and recognition[J]. IEEE Transaction. Pattern Anal. Mach. Intel., 2005, 27: 230-244.
[10] Shekar B H. Face recognition using kernel entropy component analysis[J]. Neurocomputing, 2011,74:1053- 1057.
[11] Eftekhari A. Block-wise 2D kernel PCA/LDA for face recognition [J]. Information Processing Letters, 2010, 110: 761-766.
[12] Gao Jianqiang, Fan Liya. Kernel-based weighted discriminant analysis with QR decomposition and its application face recognition[J]. WSEAS Transactions on Mathematics, 2011, 10(10): 358-367.
[13] Zadeh L A. Fuzzy sets[J]. Information Control, 1965, 8: 338-353.
[14] Kwak K C, Pedrycz W. Face recognition using a fuzzy Fisher face classifier[J]. Pattern Recognition,2005, 38(10): 1717-1732.
[15] Li Wei, Ruan Qiuqi, Wan Jun. Fuzzy Nearest Feature Line-based Manifold Embedding[J]. Journal of information science and engineering, 2013, 29: 329-346.
[16] Cui Yan, Fan Liya. Feature extraction using fuzzy maximum margin criterion[J]. Neurocomputing, 2012, 86: 52-58.
[17] An W, Liang M. Fuzzy support vector machine based on within-class scatter for classification problems with outliers or noises, Neurocomputing, [EB/OL].http:// dx.doi.org/ 10.1016/j.neucom.2012.11.023.
[18] 高建强, 范丽亚. 模糊线性判别分析中距离对面部识别的影响[J]. 井冈山大学学报:自然科学版,2012, 33(3):1-7.
[19] Song F X, Cheng K, Yang J Y, et al. Maximum scatter difference, large margin linear projection and support vector machines[J]. Acta Automatica Sinica, 2004, 30(6): 890-896 (in Chinese).
[20] http://archive.ics.uci.edu/ml/datasets.html.[EB/OL].Accessed 10January,2013.
[21] Ching Waiki. Regularized orthogonal linear discriminant analysis [J]. Pattern Recognition, 2012, 45: 2719-2732.
[22] 方开泰, 刘璋温. 极差在方差分析中的应用[J]. 数学的实践与认识, 1976(1):8-12.
[23] 潘世雄. 极差在卫生检验数据处理中的应用[J]. 中国卫生检验杂志, 1995, 5(6): 377-378.
正则线性判别分析和最大散度判别分析的算法比较
*李 莉1, 高建强2
(1. 南京财经大学应用数学学院,江苏,南京 210023;2. 河海大学计算机与信息学院,江苏,南京 210098)
我们给出了识别率偏差波动的计算公式,同时利用不同的参数在UCI的三个数据集上比较了正则线性判别分析和最大散度距离判别分析方法的识别性能。实验结果表明,在适当的参数下,正则线性判别分析的识别性能优于最大散度距离判别分析。另外,对于K近邻分类器中不同的K值,最大散度距离判别分析的识别率偏差波动要比正则线性判别分析的波动小。因此,在处理识别任务的实际应用中,对于一个稳定的识别方法,应该考虑识别率偏差波动。
识别率偏差波动;参数选择;分类率;正则线性判别分析;最大散度判别分析
TP391
A
1674-8085(2013)04-0005-07
10.3969/J.issn.1674-8085.2013.04.002
TP391 Document code:A DOI:10.3969/j.issn.1674-8085.2013.04.002
2013-01-18
Modified date:2013-05-28
Graduate Education Innovation Project Fund of Jiangsu Province (CXZZ13_0239).
Biographies: * Li li (1985-), female, rizhao shandong province, master, mainly engaged in nonlinear analysis and economic application and data mining research (E-mail: lili880827@126.com).
Gao Jian-qiang (1982-), male, PhD student, mainly engaged in remote sensor and remote control, information processing system and pattern recognition(E-mail: jianqianggaoHH@126.com).
