基于羧甲基纤维素钠制备氮掺杂多孔炭及其电容性能研究
2013-10-18陈祥迎谢东华
陈 崇 陈祥迎 谢东华
(合肥工业大学化学工程学院,可控化学与材料化工安徽省重点实验室,合肥 230009)
1 Introduction
Carbon-based materials,primarily close to electrochemical double-layer capacitors(EDLC),are considered to be intriguing electrode materials for industrialization.The advantages of carbon materials include abundance,low cost,easy processing,non-toxicity,high specific surface area,good electronic con-ductivity,high chemical stability,and wide operating temperature range.1Up to now,various kinds of high surface area carbon materials mainly including activated carbon,carbon aerogels,carbon nanotubes,porous carbons,carbon nanofibres as well as graphene and graphene oxide emphatically noticed in recent period2have been adopted as electrode materials.However,in most cases the measured specific capacitances of carbon materials in real supercapacitors are less than those stated in literature,with values in the range of 75-175 F·g-1for aqueous electrolytes and 40-100 F·g-1for organic electrolytes.3
Alternatively,introducing heteroatoms such as oxygen,nitrogen,boron,and sulfur into carbon materials has been proved to be an effective strategy of improving the specific capacitances.4Among these,the introduction of nitrogen has been investigated most extensively because nitrogen can provide electron donor characteristics to the carbon.To realize the purpose,several protocols available were developed.The first one is to use nitrogen-rich precursors,representatively including melamine,5polypyrrole,6polyacrylamide,7and biomass8,9etc.,to obtain carbon with nitrogen heteroatoms.Another one is the treatment of carbons with nitrogen-rich reagents,basically including NH3gas,10ammonia water,11,12CO(NH2)2,13and amine.14On the other hand,the introduction of boron is also beneficial for enhancing the capacitive performances of carbons,commonly using H3BO3as the boron source.15,16As illustrated,B-doping may introduce holes,and B-doped sites would be polar,while N-doping introduces electrons into carbon as a carrier.17Of the great interest is the use of CO(NH2)2as nitrogen-dopant,as it is readily available and the doping process is simple,low cost,and reproducible.
In addition,carboxymethyl cellulose(CMC)is a cellulose derivative with carboxymethyl group(-CH2-COOH)bound to some of the hydroxyl groups of the glucopyranose monomers that make up the cellulose backbone.It is often used as its sodium salt,sodium carboxymethyl cellulose(NaCMC),which has wide applications in various industries such as polymer blends,water binder,tissue engineering,drug delivery etc.18As much as we know,no report has been thus far brought forward to prepare porous carbon using NaCMC as carbon source.
Herein,a kind of inexpensive,reproducible NaCMC for the first time was proposed to prepare porous carbon without activation process.The as-obtained carbons were further doped with nitrogen to improve the capacitive performances.The mass ratios of NaCMC and CO(NH2)2upon the nitrogen species,dopant dosages,specific surface areas,and pore structures and the resultant electrochemical properties of capacitors were emphatically investigated.The low-cost,simple synthetic procedure for carbon synthesis and its nitrogen doping procedure might make it available commercially.
2 Experimental
All the analytical chemicals were purchased from Sinopharm Chemical Reagent(Shanghai)Co.Ltd.and used as received without further purification.
For referring convenience in this work,we denominate the product obtained by directly heating NaCMC at 800°C for 2 h as carbon-blank.Also,we denominate the products obtained by heating NaCMC and CO(NH2)2with various mass ratios at 800°C for 2 h as carbon-N-1:5/1:20/1:30,respectively.The overall schematic drawing for the production of porous carbon containing nitrogen from NaCMC without complex activation process is given in Fig.1.
2.1 Typical synthesis procedure for carbon-blank directly from NaCMC
Certain amount of sole NaCMC powder was placed in porcelain boat,flushing with argon for about 30 min,and then heated in a horizontal tube furnace up to 800 °C at a rate of 5 °C·min-1,keeping for 2 h under Ar flow.The resulting product was subsequently immersed with dilute HCl solution to remove insoluble substances,which was further washed with adequate deionized water until pH=7.Finally,the sample was dried under vacuum at 100°C for 12 h to obtain the carbon sample.
2.2 Typical synthesis procedure for carbon-N-1:5/1:20/1:30 from NaCMC and CO(NH2)2by solid state method
A series of carbon-N-1:5/1:20/1:30 samples were obtained,using NaCMC and CO(NH2)2with various mass ratios as starting materials,while keeping other reaction parameters similarto that of carbon-blank,as mentioned above.
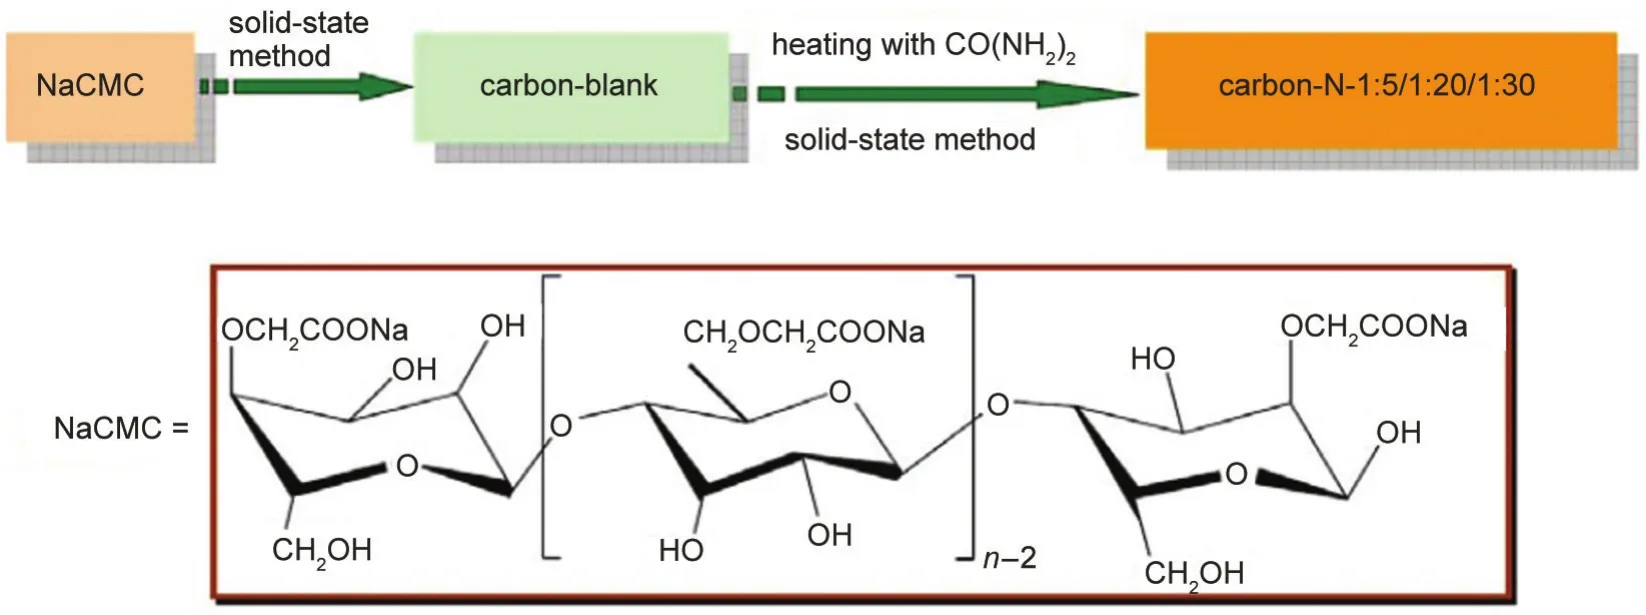
Fig.1 Schematic drawing for the production of nitrogen doped porous carbon from NaCMC without complex activation process
2.3 Characterization
The thermogravimetric analysis(TGA)using TG 209 F3 Tarsus(Netzsch)was employed to investigate the thermal decomposition behavior of NaCMC under the protection of Ar gas with a ramping rate of 10 °C·min-1.X-ray diffraction(XRD)patterns were obtained on a Rigaku D/MAX2500V with Cu Kαradiation.Field emission scanning electron microscopy(FESEM)images were taken with a Hitachi S-4800 scanning electron microscope.X-ray photoelectron spectra(XPS)were obtained on a VG ESCALAB MK II X-ray photoelectron spectrometer with an exciting source of Mg Kα(1253.6 eV).The specific surface area and pore structure of the carbon samples were determined by N2adsorption-desorption isotherms at 77 K(Micrometrics ASAP 2020 system)after being vacuum-dried at 200°C overnight.The specific surface area was calculated by the conventional BET(Brunauer-Emmett-Teller)method.
2.4 Electrochemical measurements
In order to evaluate the capacitive performances of the as-prepared carbon samples(ca 4 mg)in electrochemical capacitors,a mixture of 80%(mass fraction)carbon powder,15%acetylene black,and 5%polytetrafluoroethylene(PTFE)binder were fabricated using ethanol as a solvent.Slurry of the above mixture was subsequently pressed onto nickel foam under the pressure of 20 MPa,serving as a current collector.The prepared electrode was placed in a vacuum drying oven at 110°C for 24 h.A three-electrode experimental setup taking a 6 mol·L-1KOH aqueous solution as electrolyte was used in cyclic voltammetry and galvanostatic charge-discharge measurements on an electrochemical working station(CHI660D,ChenHua Instruments Co.Ltd.,Shanghai).Hereinto,the prepared electrode,platinum foil(6 cm2),and saturated calomel electrode(SCE)were used as the working electrode,counter electrode,and reference electrode,respectively.
3 Results and discussion
Thermogravimetric analysis was performed to determine changes in mass as a function of temperature in a controlled atmosphere.In this work,TGA curve of sole NaCMC sample under Arcondition is displayed in Fig.2.It is clear to us that there exist four basic stages towards drastic mass changes in the temperature scope from room temperature to 1000°C,indicating the complexity of its thermal behavior.In the first stage ending at 185.71°C,it mainly involves the removal of water molecules physically adsorbed within the NaCMC sample because of the strong hydrophilicity,which results in the mass loss of ca 8.56%.Notably,a kind of transition occurs at 170°C due to the structural transitions of the polymer chains,probably being related to the partial oxidation of the OH groups.19In the second stage ranging from 185.71 to 322.01°C,large mass loss of ca 38.02%appears mainly due to the thermal degradation,accompanying with the cleavage of alcoholic C-O and ether CO-C group.Besides,as there are COO-groups in the case of NaCMC,it is decarboxylated in this temperature range.20Consequently,in the next two steps ending at 532.73 and 907.54°C,respectively,hydrocarbons,solid carbons along with certain amount of Na2CO3etc.appear in the product.
To investigate the purity and crystallinity of samples from NaCMC,XRD serving as a powerful technique was carried out,and the corresponding patterns are displayed in Fig.3.By directly heating NaCMC sample at 800°C for 2 h in a flow of argon gas,large amount of black fluffy product emerges,which is mainly composed of amorphous carbon,monoclinic phase Na2CO3(JCPDS Card No.77-2082),and cubic NaCl phase(JCPDS Card No.05-0628),as shown in Fig.3(a).Regarding the formation of Na2CO3sample,it might originate from the reaction between gaseous CO2and Na2O freshly produced by the thermal degradation of NaCMC at high temperature in Ar gas,also as illustrated by TGA result in Fig.2.In addition,a side reaction occurs to form sodium glycolate(HOCH2CCONa)and NaCl simultaneously when producing CMC,usually leading to coexistence of minor amount of NaCl sample in NaCMC powder.Next,to obtain pure carbon from the above black carbonization product,certain amount of aqueous HCl solution and deionized water were added in sequence to remove the unwanted substances and the resulting carbon sample,named as carbon-blank,is displayed in Fig.3(b).The broad and low intensity diffraction peak locating at ca 22.5°in Fig.3(b)can be attributed to(002)of carbon,obviously indicating the low graphitization and amorphous nature.
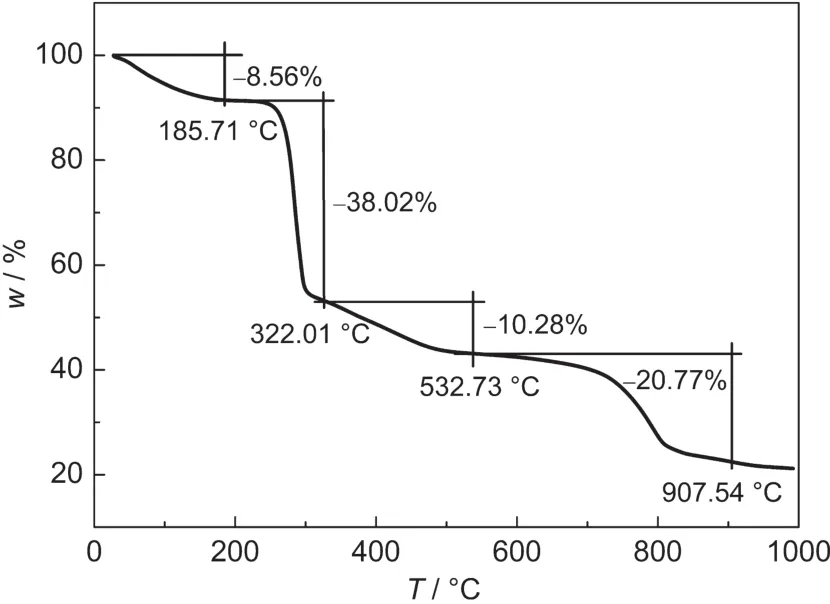
Fig.2 TGAcurve of sole NaCMC sample measured under argon condition
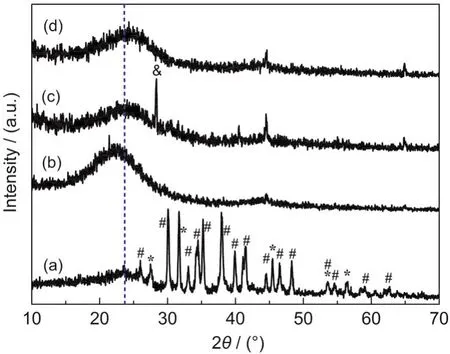
Fig.3 XRD patterns of the carbon-blank sample before(a)and after(b)being washed with aqueous HCl solution and deionized water;XRD patterns of the carbon-N-1∶20 sample before(c)and after(d)being washed with aqueous HCl solution and deionized water
On the other hand,in order to promote the capacitive performance of NaCMC in an efficient manner,CO(NH2)2with various mass ratios were introduced.When heating black carbon previously produced from NaCMC and CO(NH2)2(1:20,w/w)at 800°C for 2 h,nitrogen doped carbon named as carbon-N-1:20 comes forth,which keeps unchanged seemingly,whose typical XRD patterns in Fig.3(c,d)are almost the same as that of the undoped carbon.It is noteworthy to us that the diffraction peaks in Fig.3(c,d)locating both at ca 25.0°shift to higher degrees than that at ca 22.5°in Fig.3(b),undoubtedly revealing that doping carbon with nitrogen produced from CO(NH2)2can availably enhance its crystallinity.
FESEM technique was employed to vividly depict the genuine sizes and shapes of carbon samples obtained under various conditions.Fig.4(a)shows the representative FESEM image of the carbon-blank sample obtained by directly heating NaCMC sample at 800°C for 2 h in Ar gas,apparently consisting of large numbers of irregular block particles of several micrometers in sizes and porous cavities covering on their surfaces.Interestingly,when heating the carbon-blank sample at elevated temperatures especially beyond 300°C,large quantity of black smoke emerges out of the tubular furnace,which definitely favors for the formation of porous structures within carbon materials.As for the carbon-N-1:20 sample obtained by heating NaCMC and CO(NH2)2(1:20,w/w)at 800°C for 2 h,it also takes on porous structure in substance and some cavities with the sizes ranging from hundreds of nanometers to several micrometers appear on the surfaces,as shown in Fig.4(b),which belong to the scope of macroporous ones.Even so,large quantity of invisible cavities locating in the scope of micro/mesoporous sizes is believed to exist within these samples,which will be further detected by the following N2adsorption-desorption analysis.
X-ray photoelectron spectroscopy(XPS)is a quantitative spectroscopic technique to measure the elemental composition,empirical formula,chemical state,and electronic state of the elements that exist within a material.Fig.5 shows the typical XPS of the carbon-blank,carbon-N-1:5/1:10/1:20 samples.By the analysis of binding energy values,the nature of the binding between carbon and nitrogen is expected to be confirmed.The survey spectra in Fig.5(A)clearly reveal that all the samples are primarily comprised of carbon,oxygen and/or nitrogen elements,in which the oxygen basically originates from the surface contamination.
Fig.5(B)shows the typical C 1s spectra with binding energies ranging from 282.5 to 295.0 eV of the carbon-blank,carbon-N-1:5/1:10/1:20 samples.Obviously,all the samples exhibit lower binding energies locating at ca 284.6 eV,convincingly proving graphitic structure of the carbons.The C 1s peak at 284.6 eV commonly corresponds to the energy of the sp2C-C bond in C 1s spectrum of pyrolytic graphite.21The one at ca 285.8 eV is due to phenolic,alcohol,ether,or C=N groups.22

Fig.4 FESEM images of the(a)carbon-blank sample and(b)carbon-N-1∶20 sample
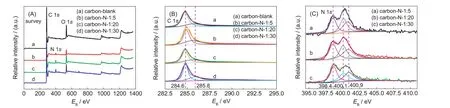
Fig.5 XPS of the carbon-blank,carbon-N-1∶5/1∶10/1∶20 samples
For N-doped carbon materials,four types of N-containing groups are mostly recognized.23,24In details,quaternary N,also called graphitic N,is incorporated into the graphite plane and bonded to three carbon atoms,locating at ca(401.3±0.3)eV.Pyridinic N bonding to two carbon atoms exists at the edge of graphite planes and donates one p-electron to the aromatic π-system near ca(398.6±0.3)eV.Pyrrolic N is bonded to two carbon atoms and contributes two p-electrons to the π-system at ca(400.5±0.3)eV.Oxidized pyridinic N at ca 402-405 eV commonly forms after the sample is exposed to air and is bonded to two carbon atoms and one oxygen atom.It should be noted that Usachov et al.25also reported that there exist eight types of nitrogen impurities in case of graphene.Fig.5(C)gives us the typical N 1s spectra of the carbon-N-1:5/1:10/1:20 samples,which primarily consist of three peaks centered at ca 398.4,400.1,and 400.9 eV.It is apparent that the ones at ca 398.4 eV can be assigned to pyridinic N,whilst the ones at ca 400.1 and 400.9 eV are due to pyrrolic N and graphitic N,respectively.26Besides,all the carbon/oxygen/nitrogen contents are listed in Table 1.It can be clearly seen that increasing the mass ratio of NaCMC and CO(NH2)2from 1:5 to 1:20/1:30 can effectively enhance the total nitrogen content in the products from 2.72%up to 4.83%and 5.36%.
The specific surface area and pore structure of the carbon samples obtained by heating calcium citrate at various carbonization temperatures were further determined by N2adsorption-desorption isotherms,as displayed in Fig.6.Regarding carbon-blank and carbon-N-1:5/1:10/1:20 samples,all their isotherms in Fig.6(a)have evident hysteresis loops with sharp capillary condensation steps at relative high pressures of p/p0>0.45 and exhibit characteristics of type-IV(H2 type)based on the IUPAC classification,which essentially corresponds to themesoporous structure.Besides,the pore size distribution curves in Fig.6(b)also prove that these carbon samples principally take on multi-modal structures containing mesoporosity(2-6 nm)and micropore(<2 nm).All the characteristic pore properties of the investigated carbon samples are listed in Table 2.
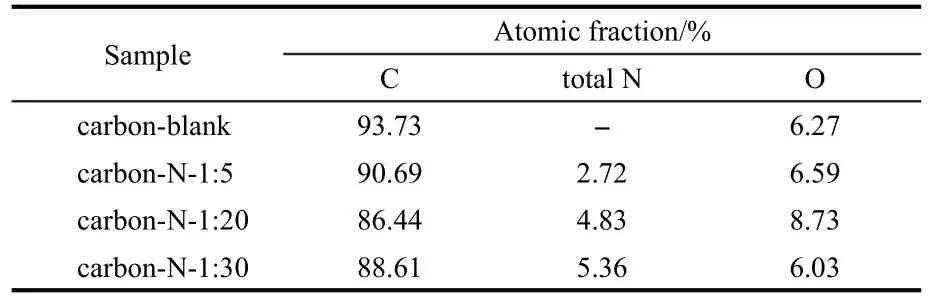
Table 1 XPS peak analysis of the carbon samples by heating NaCMC and CO(NH2)2with various mass ratios at 800°C for 2 h
As we can see,the carbon-blank sample has relatively high BET surface area(463 m2·g-1)and large total pore volume(0.23 cm3·g-1).The reason for engendering porous structure could be illustrated as follows.When heating sole NaCMC sample at high temperature,especially ranging from 300 to 400°C,massive black and irritating gases come forth,indicating the occurrence of decomposition.Along with the outward diffusion of gases,the freshly produced channels appear in the body of carbon materials,which would eventually connect to each other to form porous structures.Meanwhile,certain amounts of NaCl and Na2CO3particles covered with amorphous carbon appear in the process of carbonization of NaCMC and they might serve as hard templates for producing porous carbons after being washed with diluted HCl solution.Similarly,Guo and co-workers27also reported the direct carbonization method for preparing porous carbon starting from sodium alginate,in which the in situ formed Na2CO3particles are responsible for the formation of macropores.Besides,the chemical activation of Na+ions in sodium alginate can lead to micropores and the interspaces between the packed carbon nanoparticles form the mesopores.
To further modulate the porosity and pore structure of the carbon-blank sample,certain amounts of CO(NH2)2with mass ratios of NaCMC and CO(NH2)2as 1:5/1:20/1:30 were introduced.As a result,the corresponding SBETand VTvalues havebeen improved remarkably while keeping average pore widths almost unchanged.For example,the SBETvalue towards carbon-N-1:5/1:20/1:30 has been enhanced up to 44.28%,85.31%,and 40.17%,respectively,compared with that of carbon-blank sample.The VTvalue towards carbon-N-1:5/1:20/1:30 has been elevated up to 47.83%,91.30%,and 43.48%,respectively,compared with that of carbon-blank sample.That is to say,increasing the mass ratio of NaCMC and CO(NH2)2favors for the enhancement of SBETand VTvalues when designating the mass ratio below 1:20,whereas the higher the mass ratio beyond 1:20 is unfavorable for the increase of SBETand VTvalues.And thus,the maximum SBETand VTvalues only appear in case of carbon-N-1:20 sample.

Table 2 Characteristic surface areas and pore structures of the carbon samples

Fig.6 N2adsorption-desorption isotherms and pore size distributions of the carbon samples with various mass ratios
Hence,it is apparent to us that the mass ratio of NaCMC and CO(NH2)2plays a crucial impact upon the determination of SBETand VTvalues of the final nitrogen-containing carbon materials.Similarly,Huang and Teng28once reported that urea impregnation can result in a promoted formation of closed pores during carbonization due to the escape of some fragments from urea decomposition in the scope of low urea content(~10%),while the porosity decreases upon further urea impregnation owing to the destruction of the exterior pores.
Cyclic voltammetry(CV)technique was commonly performed in a potential range to investigate the electrochemical characteristics and qualitatively estimate the specific capacitance of electrode materials since the specific capacitance is proportional to the integral area surrounded by CV curves.Fig.7 shows the overall CV curves of the carbon-blank,carbon-N-1:5,carbon-N-1:20,and carbon-N-1:30 samples measured in 6 mol·L-1KOH aqueous solution at various scan rates including 10,20,50,and 100 mV·s-1.In case of 10 mV·s-1depicted in Fig.7(a),the CV curves exhibit nearly rectangular shape between-0.8 and 0.2 V especially without any kind of visible anodic/cathodic peaks,indeed revealing no pseudocapacitance involved or very little contribution from redox reaction.On the other hand,from the viewpoint of integral areas surrounded by CV in Fig.7(a),we can discern that the sequences of specific capacitances are as follows:carbon-N-1:20>carbon-N-1:5>carbon-N-1:30>carbon-blank.This result is well consistent with the fact that the carbon-N-1:20 sample possesses the maximum SBETand VTvalues among these carbons,as illustrated in Table 2.Furthermore,with increasing the scan rate up to 20/50/100 mV·s-1,the resultant CV curves in Fig.7(b-d)gradually deviate from rectangular shape.It indicates that the higher scan rate,the more distorted CV curves in shapes,which mainly originates from the limited ion incorporation into the active electrode material.

Fig.7 Cyclic voltammograms of the carbon-blank,carbon-N-1∶5,carbon-N-1∶20,and carbon-N-1∶30 at various scan rates
Considering the utmost SBETand VTvalues together with the excellent CV curves towards carbon-N-1:20 sample,we emphatically investigated its capacitive properties.Fig.8(a)represents the CV curves of the carbon-N-1:20 sample at various scan rates from 10 to 100 mV·s-1.By all appearances,the lower scan rates of 10-50 mV·s-1can result in the nearly rectangular outlines whereas the higher scan rates beyond 100 mV·s-1make the CV curve more deformed in shape.Also,the galvanostatic charge-discharge behaviors of the carbon-N-1:20 sample were measured at various current densities further and the potential profiles between-0.8 and 0.2 V are shown in Fig.8(b).During the charge-discharge processes,the potential behaviors are approximately linear with constant slopes.And the charge and discharge curves exhibit the almost triangular wave in a symmetrical manner,clearly revealing the quick response as electrochemical capacitor.Moreover,along with the current density ranging from 1 to 20 A·g-1,the charge-discharge time decreases expeditiously;this is mainly caused by insufficient ions transport between carbons within electrodes and electrolytes at high current densities.
Designated at the current density of 1 A·g-1,galvanostatic charge-discharge curves towards carbon-blank,carbon-N-1:5,carbon-N-1:20,and carbon-N-1:30 samples were measured to quantify their specific capacitances,as shown in Fig.8(c).Commonly,the specific capacitances of active electrode materials can be calculated according to the following equation:

where Cm(F·g-1)is the specific capacitance of the electrode based on the mass of active materials;I(A)is the discharge current;t(s)is the discharge time;ΔV(V)is the potential window(in this work,ΔV=1.0 V);and m(mg)is the mass of active materials in working electrode.
Consequently,specific capacitances at the current density of 1 A·g-1of the carbon-blank,carbon-N-1:5,carbon-N-1:20,and carbon-N-1:30 samples are ca 94.0,139.2,156.7,and 133.8 F·g-1,respectively.As is seen,the carbon-N-1:20 sample exhibits the highest Cm,and the carbon-N-1:5 sample and the carbon-N-1:30 sample have the almost same Cm,distinctly indicating that introducing nitrogen into carbons can indeed improve the capacitive properties.However,the intrinsic reason for improving capacitance by nitrogen doping is still ambiguous up to now,and it is often attributed to faradic reactions of the nitrogencontaining functional groups or enhanced wettability of the pore walls by the formation of polar functional groups.29
To further investigate the rate capability for electrochemical capacitors,the specific capacitances at various current densities of the carbon samples were measured,as given in Fig.8(d).As a commonsense,specific capacitances will gradually decrease when increasing the current densities.All the nitrogen doped carbons can exhibit higher behaviors than that of carbon-blank undoped with any nitrogen,revealing the crucial impact of nitrogen doping.Apparently,the carbon-N-1:20 sample displays the superior rate capability even at high current density as 20 A·g-1,clearly demonstrating the excellent rate capability.
Along with the increase of cycle numbers,high capacitance stability is conventionally required for excellent electrochemical capacitors.Fig.8(e)indicates the result of specific capacitance of the carbon-N-1:20 sample as a function of cycle numbers,which were conducted at relatively high current density of 5 A·g-1,keeping the potential range between-0.8 and 0.2 V.We found that its specific capacitance has decreased from initial value of 123.5 F·g-1to the final one as 119.6 F·g-1with the loss up to ca 3.16%.That is to say,the specific capacitance of carbon-N-1:20 is almost invariable within 3000 cycles,undoubtedly revealing the excellent capacitance stability.And the galvanostatic charge-discharge curves of the 1st and 3000th cycles of carbon-N-1:20 at the current density of 5 A·g-1are shown in Fig.8(f).

Fig.8 (a)Cyclic voltammogramsofthe carbon-N-1∶20 measured atvarious scan rates;(b)galvanostatic charge-discharge curves ofthe carbon-N-1∶20 measured atvariouscurrentdensities;(c)galvanostatic charge-discharge curvesofthe carbon samplesmeasured at the currentdensity of1 A·g-1;(d)specific capacitances of the carbon samples atvariouscurrentdensities;(e)cycling stability ofthe carbon-N-1∶20 atthe current density of5 A·g-1;(f)galvanostatic charge-discharge curvesofthe 1stand 3000th cycles of carbon-N-1∶20 atthe currentdensity of 5 A·g-1
Energy storage devices can be compared using Ragone plots,which map power density(the rate of charge-discharge)against energy density(the storage capacity).These values can be calculated according to the following equations:
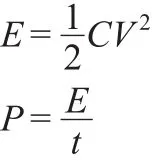
where E(Wh·kg-1)is the average energy density;C(F·g-1)is the specific capacitance;P(W·kg-1)is the average power density;and t(s)is the discharge time.
Fig.9(a)shows the typical Ragone plots regarding energy density vs power density of the carbon samples.The overall samples exhibit nearly linear relationship in the range of energy density(5-22 Wh·kg-1)and power density(0.50-10.50 kW·kg-1).Taking carbon-N-1:20 as an example,the energy density drops from 22.0 to 10.8 Wh·kg-1in accompany with the power density increasing from 0.5 to 10.5 kW·kg-1.Since intensive attention has been so far focused on electrochemical capacitors with increasing their energy density while keeping the minimum sacrifice in power capability and cycle life for deep discharges,the present carbons are believed to be excellent electrode candidates for high-rate electrochemical capacitors.
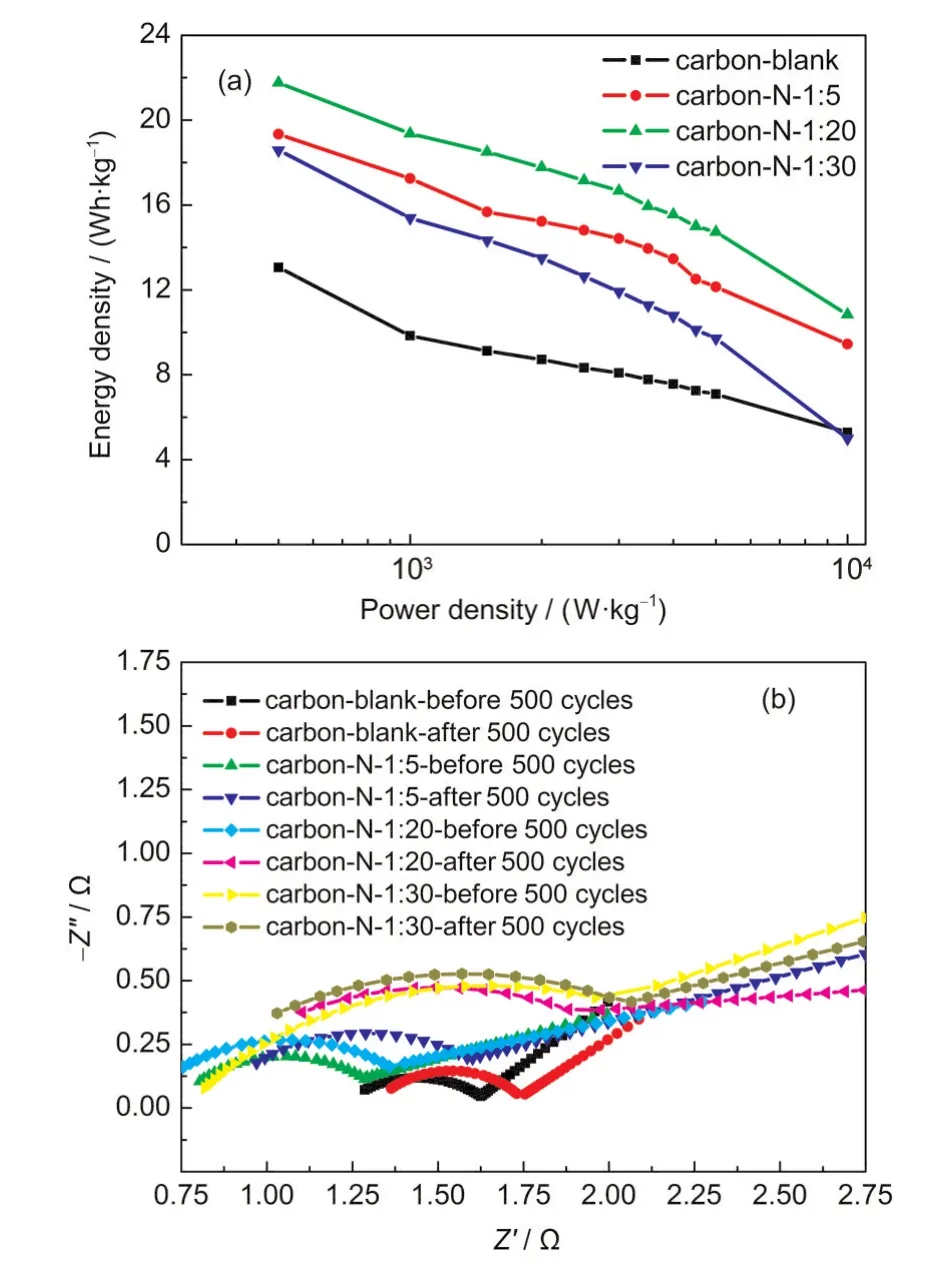
Fig.9 (a)Ragone plots showing energy density vs power density of the carbon samples;(b)Nyquist plots before/after 500 cycles of the carbon samples

Fig.10 Equivalent circuit model for the circuit plot at whole frequency range
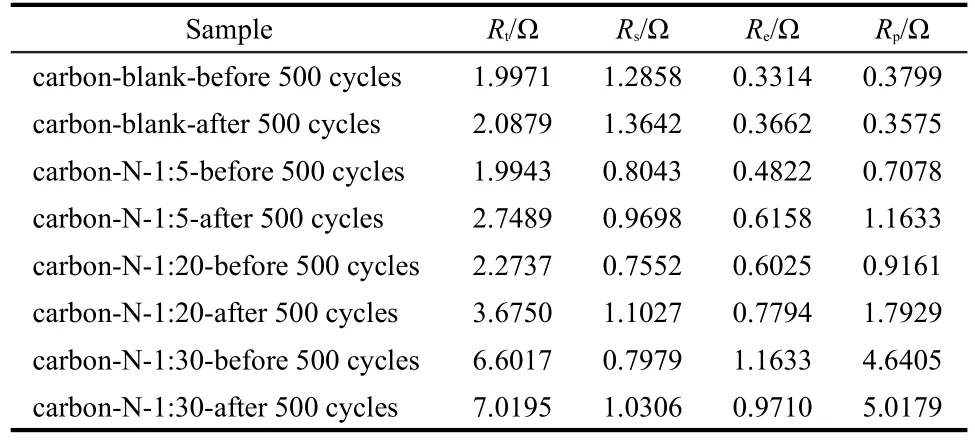
Table 3 Overall resistance(R t),electrical connection resistance(R e),electrolyte resistance(R s),and resistance of ion migration in carbon micropores(R p)of the carbon samples
Fig.9(b)shows the electrochemical impedance spectroscopy(EIS)often represented in Nyquist plots of the carbon samples before and after 500 cycles,which were conducted by applying a sine wave with amplitude of 5.0 mV over the frequency ranging from 100 kHz to 0.01 Hz.All the impedance curves in Fig.9b exhibit a depressed semicircular arc in the high-frequency region followed with a linear tail along the imaginary axis in the low-frequency region.In details,the semicircular arc is the impedance characteristics of the contact situation between carbon particles in an electrode as well as that between the carbon film and backing plate.30Besides,the line in low frequency region is a 45°Warburg line,most likely due to the frequency dispersion in active materials,which is slowed down by difficult accessibility of hydrated ions in micro-sized pores.31
In addition,the proposed equivalent circuit by fitting of impedance spectra was further performed by the code ZView,as shown in Fig.10.The overall resistance(Rt),including electrical connection resistance(Re),electrolyte resistance(Rs),and resistance of ion migration in carbon micropores(Rp)is summarized in Table 3.Hereinto,the intercept on the Zʹaxis at the high-frequency end is Rs,which is anticipated to be identical towards all carbon samples involved in this work since they used the same electrolyte.32However,the corresponding Rsvalues in Table 3 are not the same as yet and especially the ones after 500 cycles are always larger than those before cycles,also revealing that the electrolyte has changed slightly after 500 cycles.
4 Conclusions
In summary,a direct but efficient carbonization method was developed to prepare porous carbons as electrode materials,using NaCMC as the carbon source.The as-obtained carbons were further doped with nitrogen to improve the capacitive performances.We believe that several scientific merits exist in this work as follows:the precursor of NaCMC involved is inex-pensive;the corresponding synthetic process only needs carbonization while circumventing further chemical activation,revealing its environmentally benign features;the doping processes for nitrogen are also simple and reproducible;doping nitrogen into carbons can distinctly improve the specific surface areas and capacitive performances.It is believed that the present strategies involved can help us to understand and to enrich the fields of carbons for EDLCs.
Supporting Information∶The capacitive performances of boron-doped carbons have been included.This information is available free of charge via the internet at http://www.whxb.pku.edu.cn.
(1)Zhai,Y.P.;Dou,Y.Q.;Zhao,D.Y.;Fulvio,P.F.;Mayes,R.T.;Dai,S.Adv.Mater.2011,23,4828.doi:10.1002/adma.201100984
(2)Su,P.;Guo,H.L.;Peng,S.;Ning,S.K.Acta Phys.-Chim.Sin.2012,28,2745.[苏 鹏,郭慧林,彭 三,宁生科.物理化学学报,2012,28,2745.]doi:10.3866/PKU.WHXB201208221
(3)Wang,G.P.;Zhang,L.;Zhang,J.J.Chem.Soc.Rev.2012,41,797.doi:10.1039/c1cs15060J
(4)Frackowiak,E.Phys.Chem.Chem.Phys.2007,9,1774.doi:10.1039/b618139m
(5)Hulicova,D.;Yamashita,J.;Soneda,Y.;Hatori,H.;Kodama,M.Chem.Mater.2005,17,1241.doi:10.1021/cm049337g
(6)Su,F.B.;Poh,C.K.;Chen,J.S.;Xu,G.W.;Wang,D.;Li,Q.;Lin,J.Y.;Lou,X.W.Energy Environ.Sci.2011,4,717.doi:10.1039/c0ee00277a
(7)Konno,H.;Ito,T.;Ushiro,M.;Fushimi,K.;Azumi,K.J.Power Sources 2010,195,1739.doi:10.1016/j.jpowsour.2009.09.072
(8)Zhao,L.;Baccile,N.;Gross,S.;Zhang,Y.J.;Wei,W.;Sun,Y.H.;Antonietti,M.;Titirici,M.M.Carbon 2010,48,3778.doi:10.1016/j.carbon.2010.06.040
(9)White,R.J.;Antonietti,M.;Titirici,M.M.J.Mater.Chem.2009,19,8645.doi:10.1039/b911528e
(10)Horikawa,T.;Sakao,N.;Sekida,T.;Hayashi,J.;Do,D.D.;Katoh,M.Carbon 2012,50,1833.doi:10.1016/j.carbon.2011.12.033
(11)Lai,L.F.;Chen,L.W.;Zhan,D.;Sun,L.;Liu,J.P.;Lim,S.H.;Poh,C.K.;Shen,Z.X.;Lin,J.Y.Carbon 2011,49,3250.doi:10.1016/j.carbon.2011.03.051
(12)Zhang,D.Y.;Hao,Y.;Ma,Y.;Feng,H.X.Appl.Surf.Sci.2012,258,2510.doi:10.1016/j.apsusc.2011.10.081
(13)Gorgulho,H.F.;Gonçalves,F.;Pereira,M.F.R.;Figueiredo,J.L.Carbon 2009,47,2032.doi:10.1016/j.carbon.2009.03.050
(14)Chen,P.;Xiao,T.Y.;Li,H.H.;Yang,J.J.;Wang,Z.;Yao,H.B.;Yu,S.H.ACS Nano 2012,6,712.doi:10.1021/nn204191x
(15)Guo,H.L.;Gao,Q.M.J.Power Sources 2009,186,551.doi:10.1016/j.jpowsour.2008.10.024
(16)Zhao,X.C.;Wang,A.Q.;Yan,J.W.;Sun,G.Q.;Sun,L.X.;Zhang,T.;Zhang,T.Chem.Mater.2010,22,5463.doi:10.1021/cm101072z
(17)Kwon,T.;Nishihara,H.;Itoi,H.;Yang,Q.H.;Kyotani,T.Langmuir 2009,25,11961.doi:10.1021/la901318d
(18)Chang,C.Y.;Zhang,L.N.Carbohydrate Polymer 2011,84,40.doi:10.1016/j.carbpol.2010.12.023
(19)Li,W.;Sun,B.J.;Wu,P.Y.Carbohydrate Polymer 2009,78,454.doi:10.1016/j.carbpol.2009.05.002
(20)Biswal,D.R.;Singh,R.P.Carbohydrate Polymer 2004,57,379.doi:10.1016/j.carbpol.2004.04.020
(21)Chen,L.F.;Zhang,X.D.;Liang,H.W.;Kong,M.G.;Guan,Q.F.;Chen,P.;Wu,Z.Y.;Yu,S.H.ACS Nano 2012,6,7092.doi:10.1021/nn302147s
(22)Maldonado,S.;Morin,S.;Stevenson,K.J.Carbon 2006,44,1429.doi:10.1016/j.carbon.2005.11.027
(23)Dommele,S.;Romero-Izquirdo,A.;Brydson,R.;Jong,K.P.;Bitter,J.H.Carbon 2008,46,138.doi:10.1016/j.carbon.2007.10.034
(24)Matter,P.H.;Zhang,L.;Ozkan,U.S.J.Catal.2006,239,83.doi:10.1016/j.jcat.2006.01.022
(25)Usachov,D.;Vilkov,O.;Grüneis,A.;Haberer,D.;Fedorov,A.;Adamchuk,V.K.;Preobrajenski,A.B.;Dudin,P.;Barinov,A.;Oehzelt,M.;Laubschat,C.;Vyalikh,D.V.Nano Lett.2011,11,5401.doi:10.1021/nl2031037
(26)Pevida,C.;Drage,T.C.;Snape,C.E.Carbon 2008,46,1464.doi:10.1016/j.carbon.2008.06.026
(27)Wu,X.L.;Wang,W.;Guo,Y.G.;Wan,L.J.J.Nanosci.Nanotech.2011,11,1897.doi:10.1166/jnn.2011.3525
(29)Inagaki,M.;Konno,H.;Tanaike,O.J.Power Sources 2010,195,7880.doi:10.1016/j.jpowsour.2010.06.036
(30)Li,Q.Y.;Wang,H.Q.;Dai,Q.F.;Yang,J.H.;Zhong,Y.L.Solid State Ionics 2008,179,269.doi:10.1016/j.ssi.2008.01.085
(31)Ma,Y.;Zhang,C.;Ji,G.;Lee,J.Y.J.Mater.Chem.2012,22,7845.doi:10.1039/c2jm30422h
(32)Zhang,W.F.;Huang,Z.H.;Gao,G.P.;Kang,F.Y.;Yang,Y.S.J.Power Sources 2012,204,230.doi:10.1016/j.jpowsour.2011.12.054